WiFi Analytics Configuration Guide
Introduction
WiFi Analytics is a built-in diagnostic feature of the CONTROL ACS platform that evaluates the quality of a CPE's WiFi network. After triggering a neighboring-WiFi scan from the device's Diagnostics tab, the engine collects radio, client, and neighbor data from the CPE and produces a structured score report.
The evaluation covers six quality factors: Signal, Noise, SNR, Interference, Standard, and Speed. Each factor is scored on a scale of 1–10 and then combined into a single Overall Score using configurable weights. This lets you tune the scoring model to reflect the conditions of your own network — for example, increasing the Interference weight for dense urban deployments.
The engine supports both TR-181 and TR-098 CPEs. For standard TR-181 devices with sequential radio indexes, the engine can auto-discover the radio configuration without any additional setup. For TR-098 or vendor-specific devices with non-standard parameter paths, an explicit Service configuration is required to supply the correct path templates and JSON key names.
Prerequisites
Before configuring WiFi Analytics, ensure the following conditions are met:
| Requirement | Details |
|---|---|
| Managed CPE | The device must be connected to CONTROL and actively reporting via TR-069/CWMP. |
| WiFi parameters in device Type | The Type profile must include parameters for periodic collection: Channel, OperatingFrequencyBand, AssociatedDevice tables, Noise, TX power, and supported standards. |
| ServiceType 23 present | The "CWMP WIFI Neighbor test" ServiceType must exist in CONTROL Settings. This is included in the default platform fixtures and should already be present. |
Note: If ServiceType 23 is missing, contact your platform administrator to load the WiFi Analytics fixtures.
Configuration Steps
Step 1: Create a Service for WiFi Analytics
A Service instance of ServiceType 23 holds all the configuration that tells the engine how to map radio and client parameters for a specific device model.
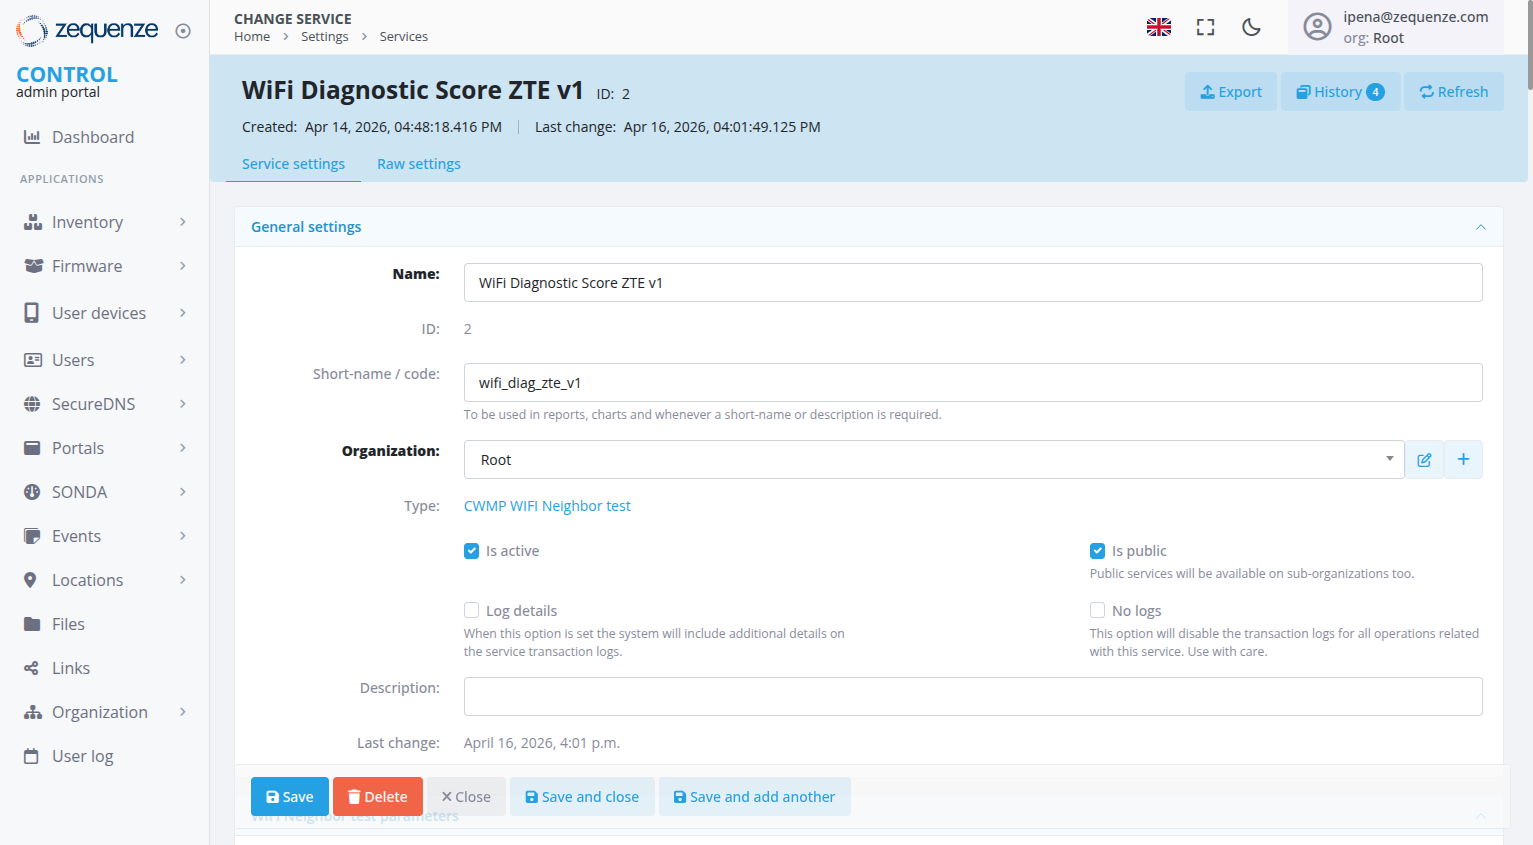
After saving, the Service will display four parameter groups:
| Parameter Group | Purpose |
|---|---|
| 2.4 GHz Band Configuration | Radio and client configuration for the 2.4 GHz band |
| 5 GHz Band Configuration | Radio and client configuration for the 5 GHz band |
| 6 GHz Band Configuration | Radio and client configuration for the 6 GHz band |
| Score Weights | Relative importance of each quality factor (must sum to 100%) |
Configure only the bands that are relevant to the device model. Bands that are left disabled are excluded from scoring.
Step 2: Configure Band Parameters
Each band group (2.4 GHz, 5 GHz, 6 GHz) contains the same set of fields. Repeat this configuration for every band the device supports.
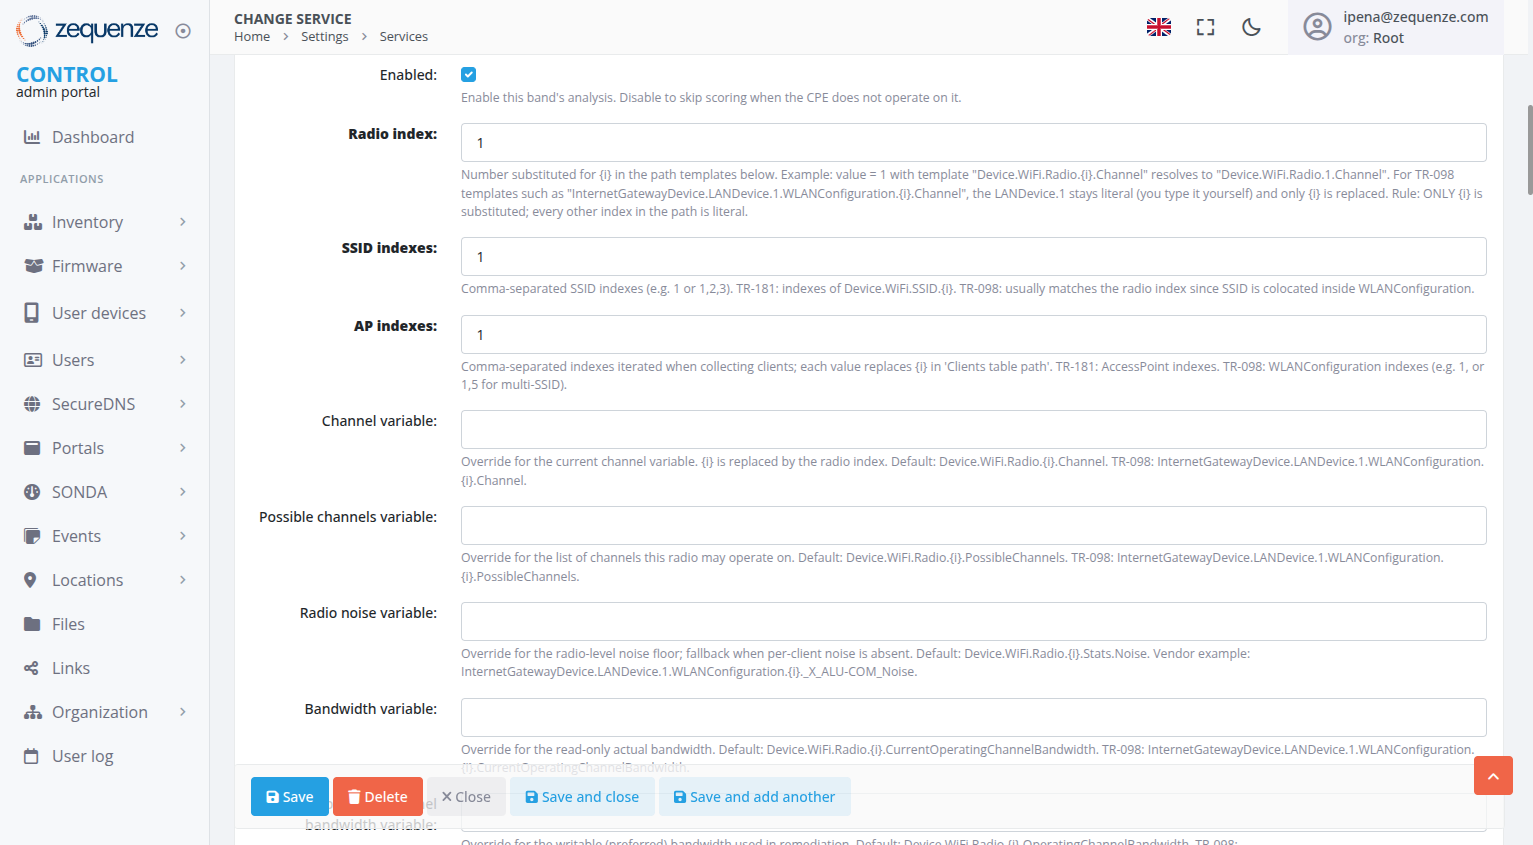
Band Enable and Index Fields
| Field | Description |
|---|---|
| Enabled | Enable or disable analysis for this band. Disabled bands are ignored entirely. |
| Radio index | The value substituted for the {i} placeholder at runtime. For TR-181, this is the Device.WiFi.Radio.{i} object index (e.g., 1 for 2.4 GHz, 2 for 5 GHz). For TR-098, this is the WLANConfiguration index. |
| SSID indexes | Comma-separated list of SSID object indexes to read SSID-level data from. |
| AP indexes | Comma-separated list of AccessPoint object indexes. These are iterated when collecting connected-client data. |
Important: The
{i}placeholder is the only token substituted by the engine. All other numbers in path templates (e.g.,LANDevice.1) are treated as literal strings and are never modified.
Variable Override Fields
These fields allow you to supply explicit TR-181 or TR-098 parameter paths. Leave them blank for standard TR-181 devices — the engine uses the correct Device.WiFi.* defaults automatically.
For TR-098 or vendor-specific devices, enter the full path template using {i} where the radio index should appear.
| Field | TR-181 default (auto) | TR-098 example |
|---|---|---|
| Channel | Device.WiFi.Radio.{i}.Channel |
InternetGatewayDevice.LANDevice.1.WLANConfiguration.{i}.Channel |
| Possible channels | Device.WiFi.Radio.{i}.PossibleChannels |
InternetGatewayDevice.LANDevice.1.WLANConfiguration.{i}.PossibleChannels |
| Radio noise | Device.WiFi.Radio.{i}.Stats.Noise |
InternetGatewayDevice.LANDevice.1.WLANConfiguration.{i}.Stats.Noise |
| Bandwidth | Device.WiFi.Radio.{i}.CurrentOperatingChannelBandwidth |
Supply vendor-specific path |
| Standards | Device.WiFi.Radio.{i}.OperatingStandards |
InternetGatewayDevice.LANDevice.1.WLANConfiguration.{i}.Standard |
| TX power | Device.WiFi.Radio.{i}.TransmitPower |
Supply vendor-specific path |
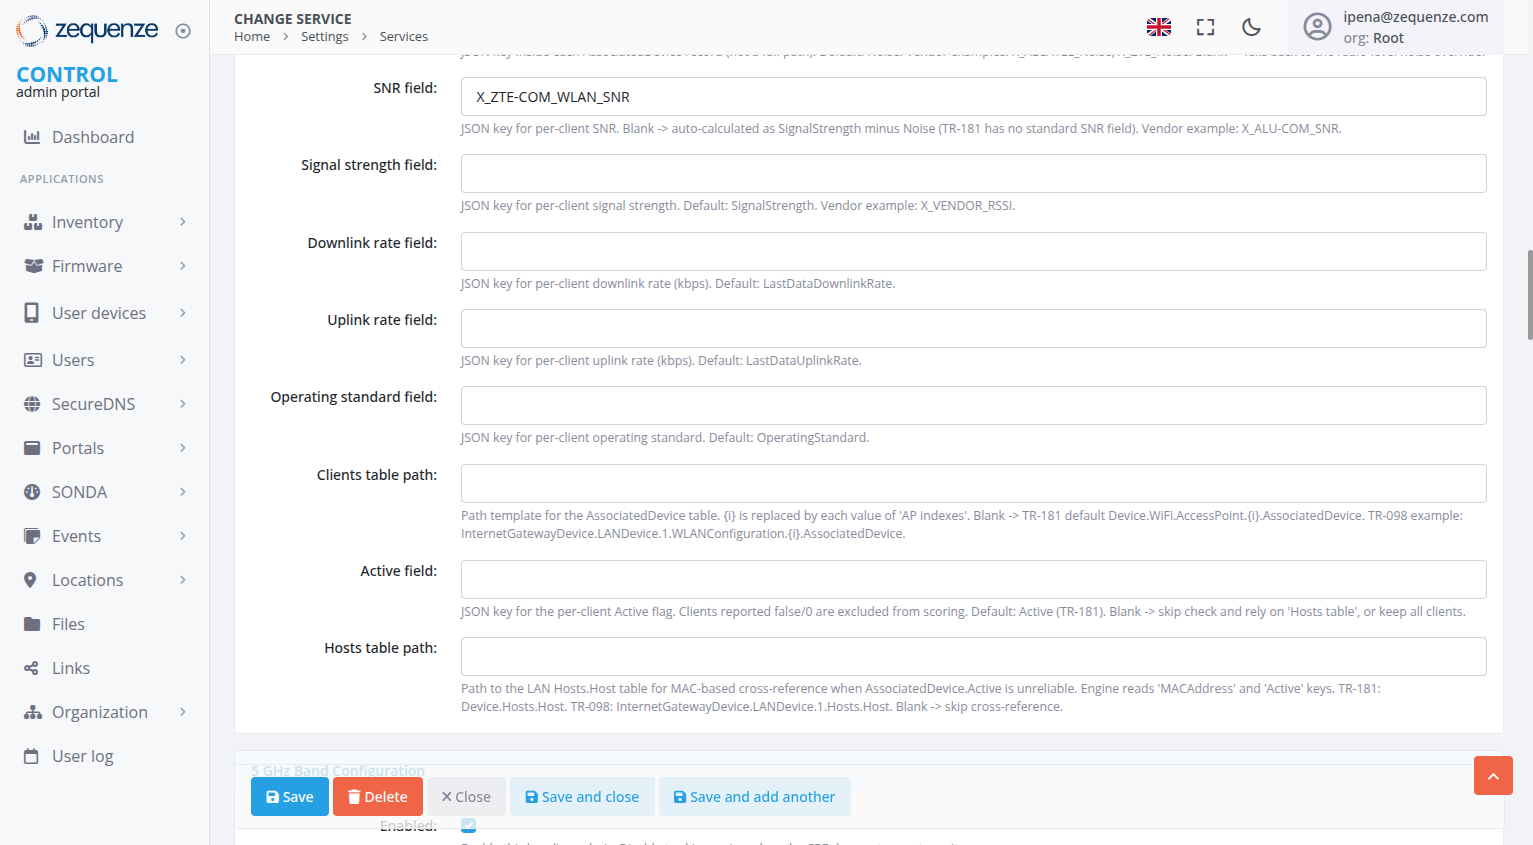
Client Field Override Fields
These fields specify the JSON key names used to read per-client metrics from the AssociatedDevice table entries. These are short key names, not full parameter paths.
Leave them blank for standard TR-181 devices. For TR-098 or vendor devices, enter the vendor-specific key name.
| Field | TR-181 default | Vendor example |
|---|---|---|
| Noise field | Noise |
X_ALCATEL_Noise |
| SNR field | (auto-calculated) | X_ALU-COM_SNR |
| Signal field | SignalStrength |
X_VENDOR_RSSI |
| Downlink rate | LastDataDownlinkRate |
— |
| Uplink rate | LastDataUplinkRate |
— |
| Standard field | OperatingStandard |
— |
Clients Table Path and Active Filter
| Field | Description |
|---|---|
| Clients table path | Template path for the AssociatedDevice table. Leave blank for TR-181 default. TR-098 example: InternetGatewayDevice.LANDevice.1.WLANConfiguration.{i}.AssociatedDevice. |
| Active field | JSON key for active-client filtering. Default: Active. Leave blank to skip filtering. |
| Hosts table path | LAN Hosts table for MAC-based cross-reference when AssociatedDevice.Active is unreliable. |
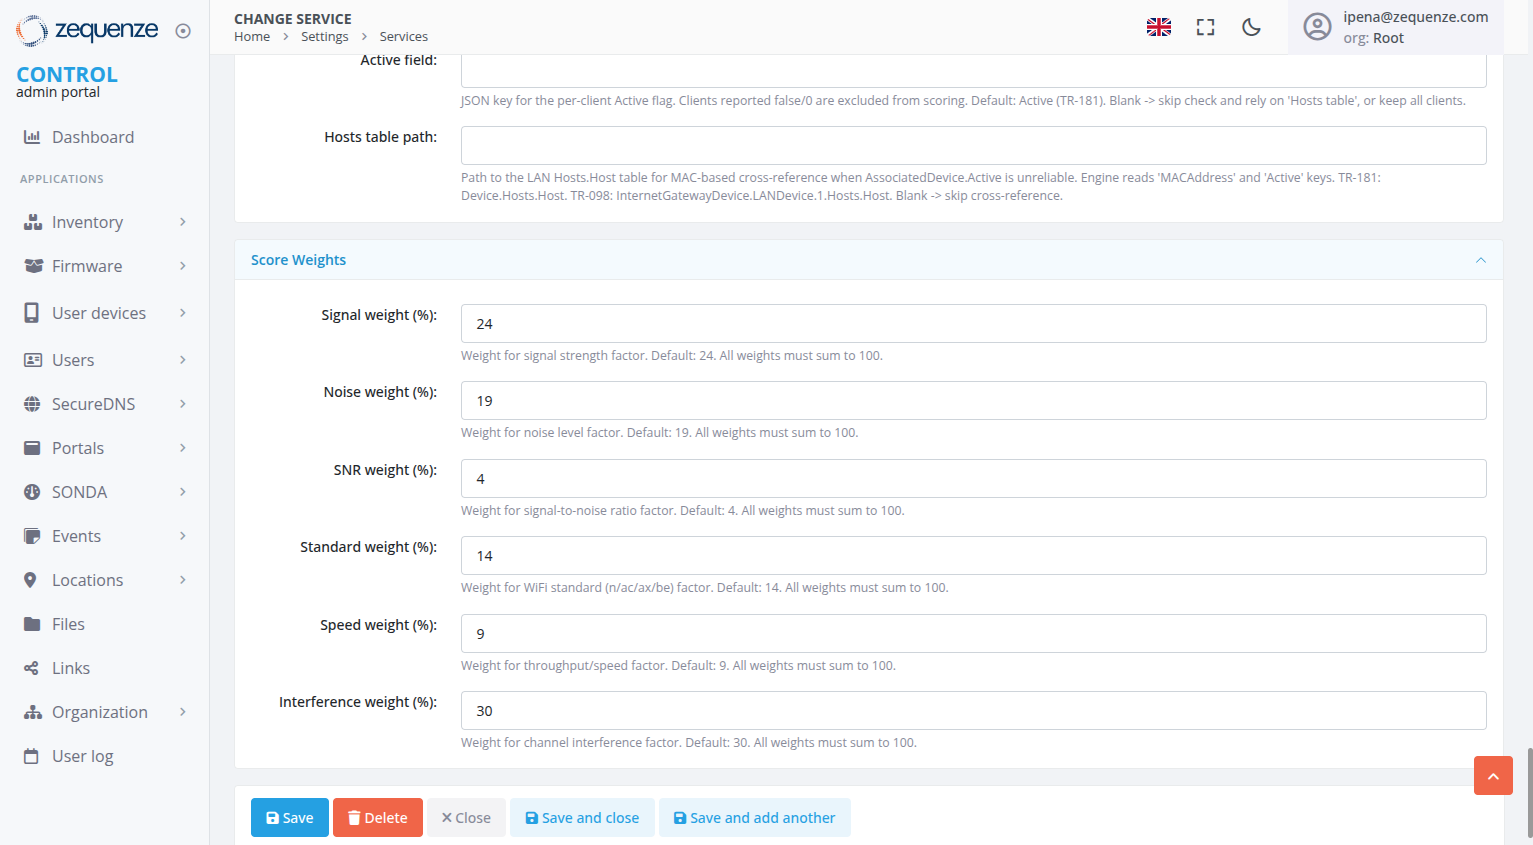
Step 3: Configure Score Weights
The Score Weights parameter group controls how much each quality factor contributes to the Overall Score. The six weights must add up to 100%.
| Quality Factor | Default Weight | What it measures |
|---|---|---|
| Signal | 24% | Client signal strength (RSSI in dBm) |
| Noise | 19% | Background noise level on the radio channel |
| SNR | 4% | Signal-to-noise ratio per client |
| Standard | 14% | WiFi standard in use (802.11n, ac, ax, etc.) |
| Speed | 9% | Per-client uplink and downlink rates |
| Interference | 30% | Neighboring network congestion on the channel |
Adjust these values to match your deployment environment. For example, increase Interference weight to 40–50% for dense urban areas, or increase Signal weight if coverage is the primary concern.
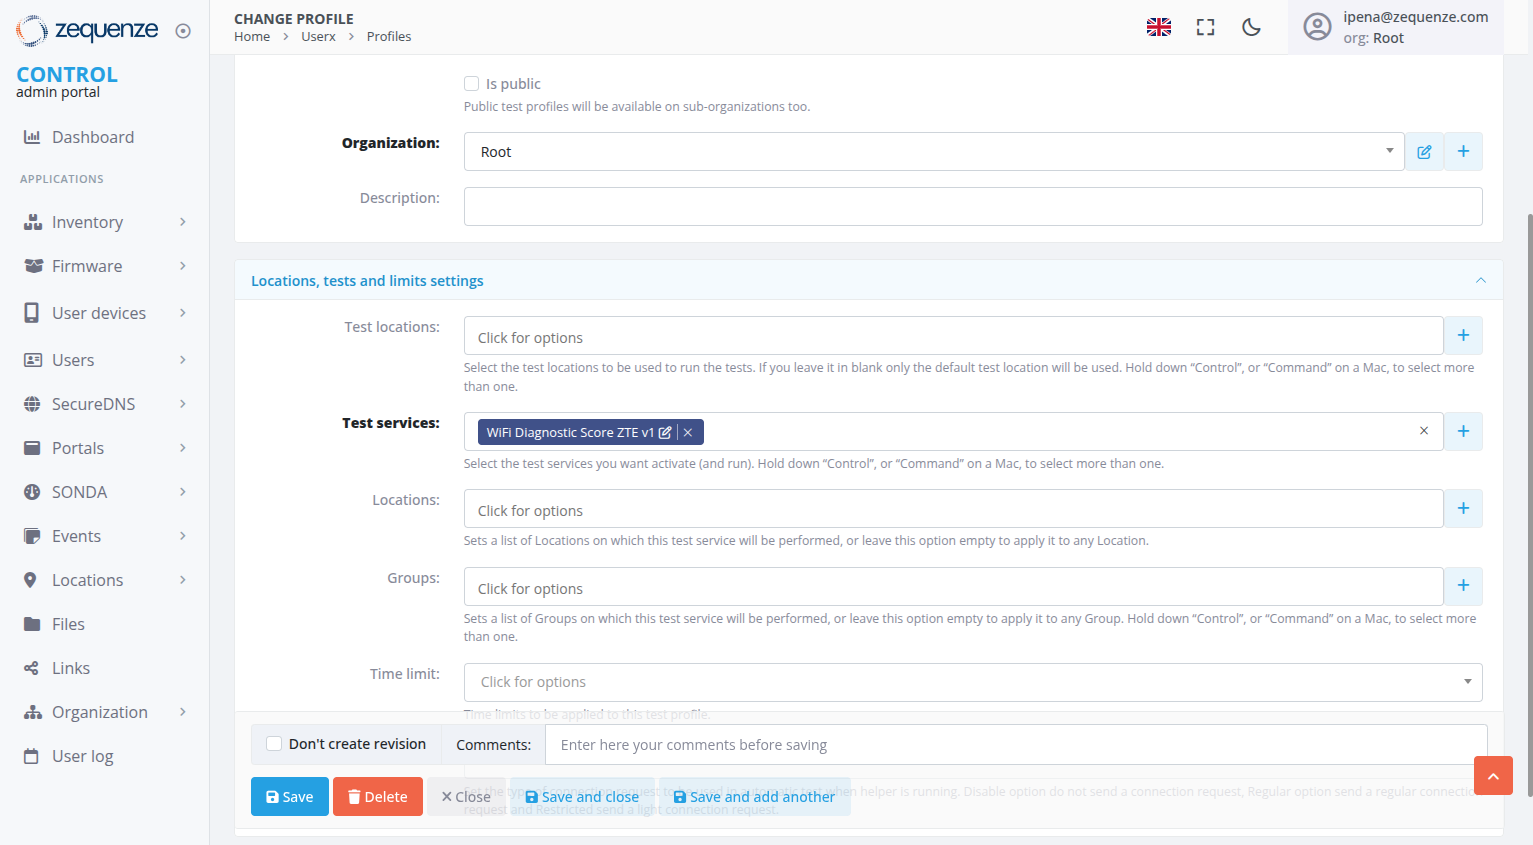
Step 4: Create a Test Profile
A Test Profile links the Service to a device Type, so the engine knows which Service configuration to use when running a diagnostic.
Step 5: Assign the Test Profile to a Device Type
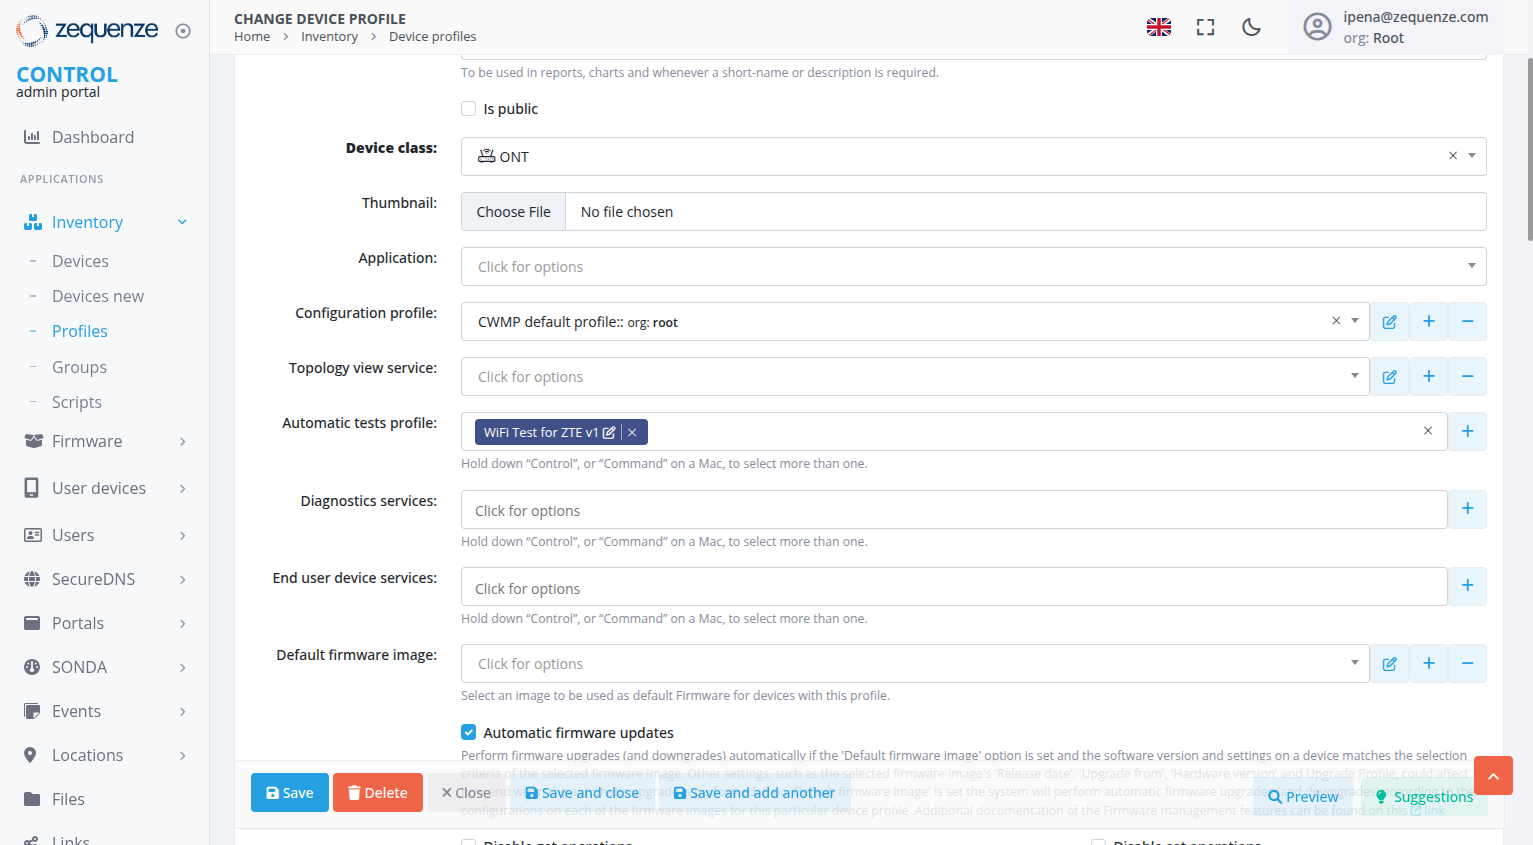
From this point on, any device of this Type will use the configured Service when a WiFi diagnostic is run.
Running the WiFi Diagnostic
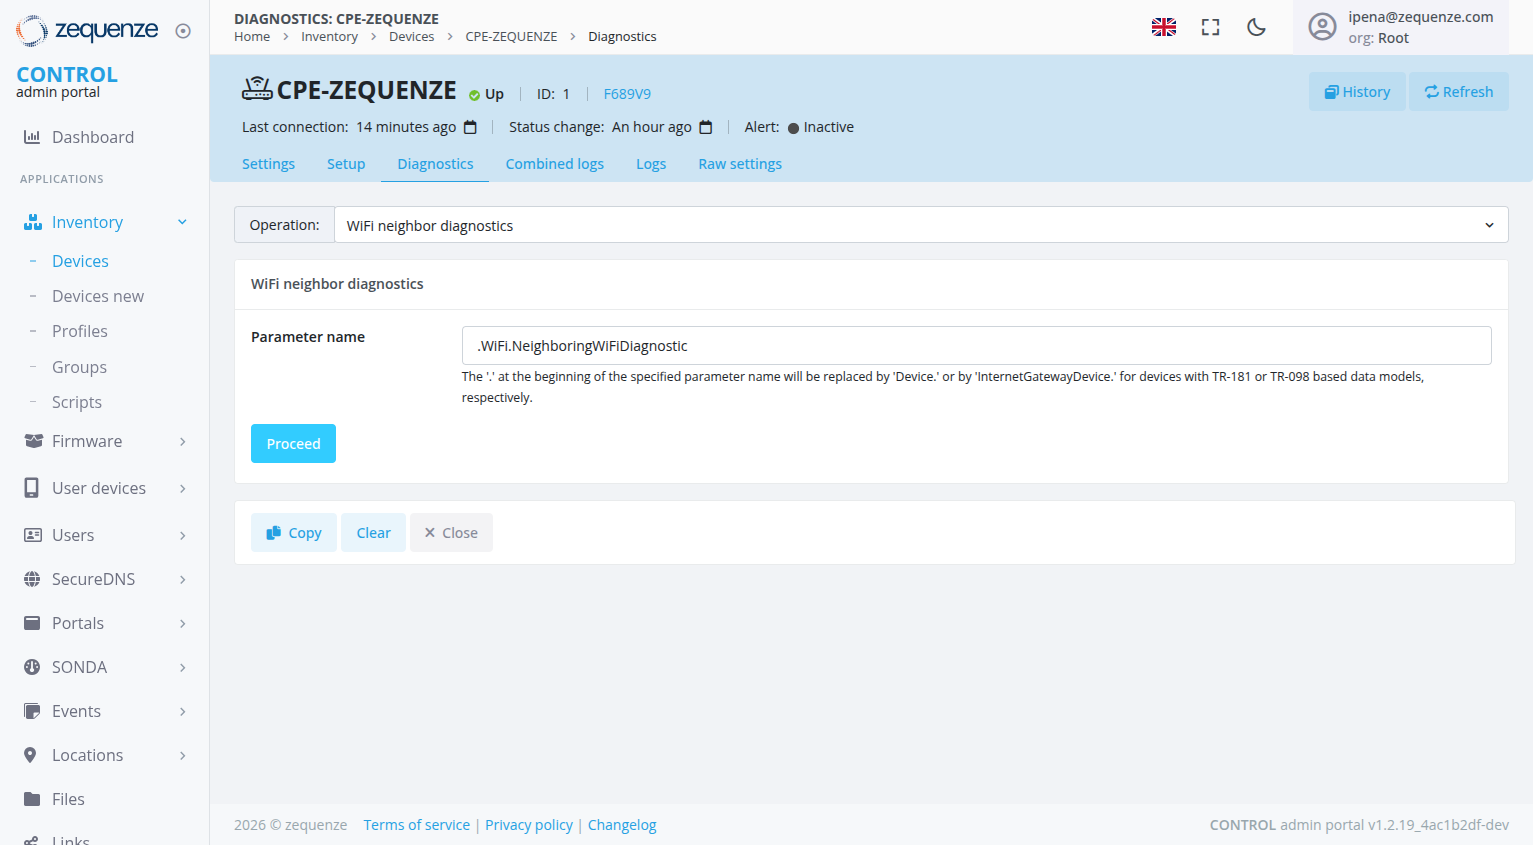
Understanding the Results
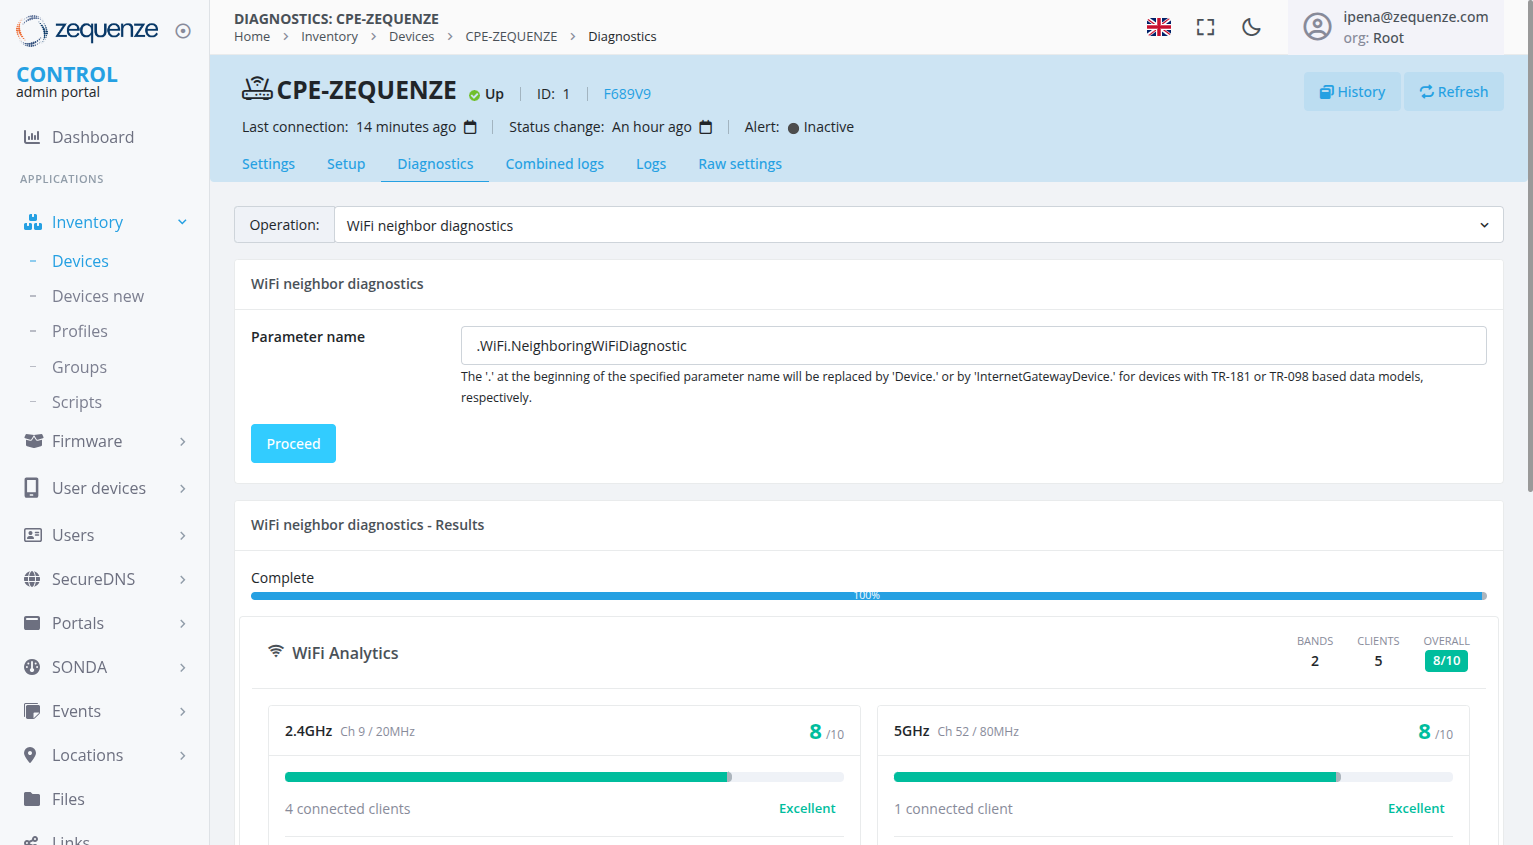
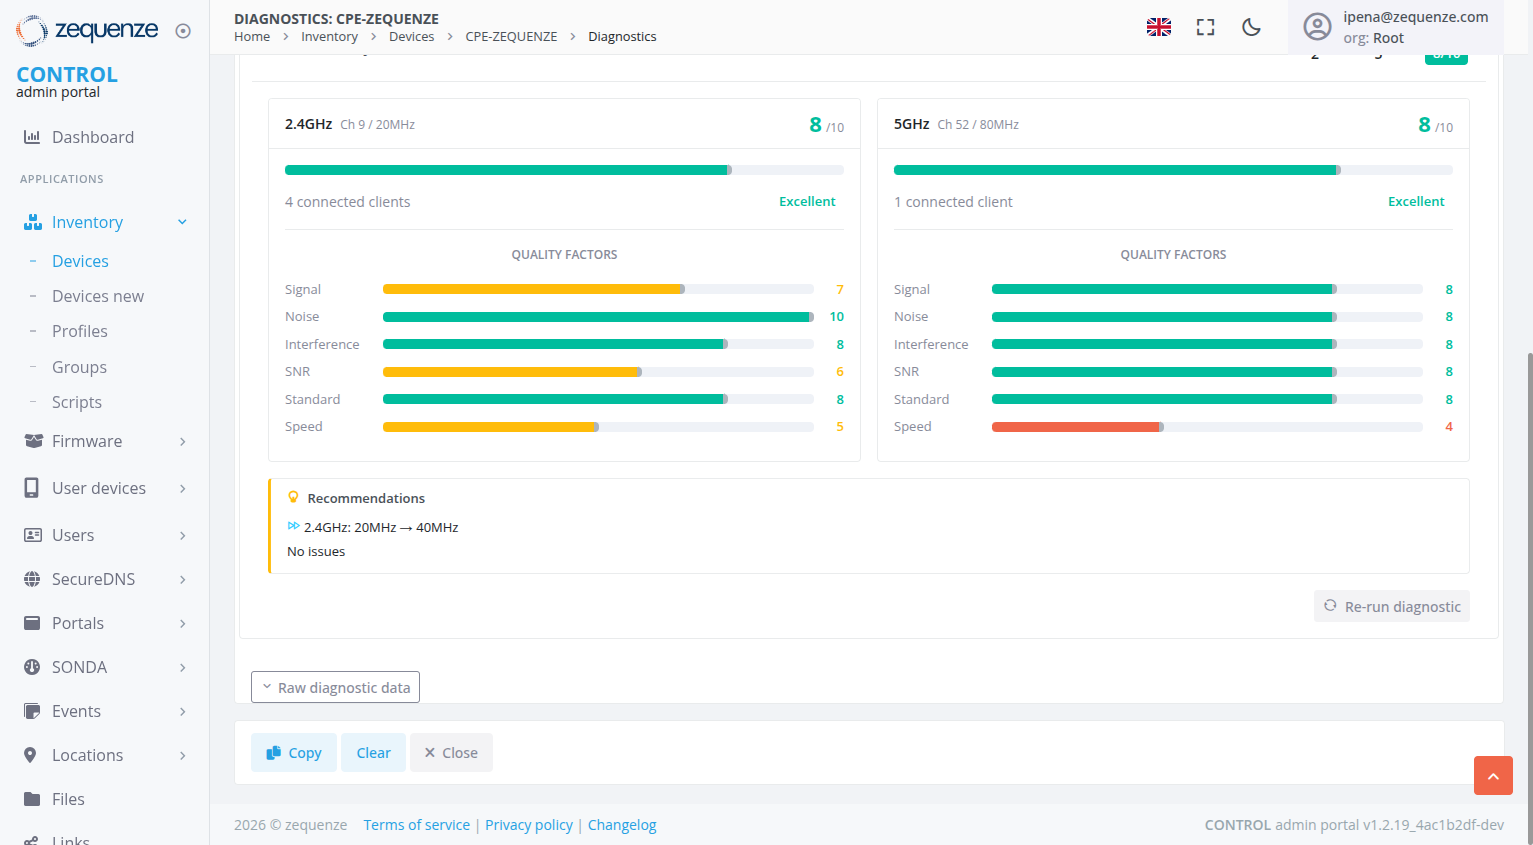
Once the diagnostic completes, a WiFi Analytics mini-dashboard appears below the form.
Header Summary
| Element | Description |
|---|---|
| Bands | Number of active bands analyzed |
| Clients | Total WiFi clients across all bands |
| Overall | Weighted average score as a colored badge (Green ≥8, Yellow ≥5, Red <5, Gray = N/A) |
Band Cards
Each band displays its current channel, bandwidth, connected client count, a score progress bar, and a quality label (Excellent / Fair / Poor).
Recommendations and Tips
- Recommendations (yellow accent): Channel changes, bandwidth suggestions, or "No issues" when optimal
- Tips (blue accent): Missing parameters, discovery suggestions, or vendor contact recommendations
- No clients: When no WiFi clients are connected, Overall shows N/A with an info message
How the Overall Score is Calculated
The Overall Score is a weighted average of all available factor scores across all bands:
- Each client's 6 factors are scored individually
- Factors with N/A are excluded; remaining weights are renormalized to sum to 100%
- The weighted average produces a per-client score (1–10)
- All client scores within a band are averaged to produce the band score
- All band scores are averaged to produce the Overall Score
The default weight distribution emphasizes Interference (30%) and Signal (24%) as the highest-impact factors for typical residential WiFi environments.
Quality Factors — Detailed Breakdown
Below each band card, six horizontal bars show the individual factor scores. Each factor is scored 1–10 based on specific inputs from the CPE. When a factor cannot be calculated, it shows N/A and its weight is redistributed proportionally across the remaining factors.
Signal Factor
Measures the received signal strength (RSSI) of each connected WiFi client.
Input: SignalStrength from the AssociatedDevice table (or the vendor-specific JSON key configured in the Service).
| Signal strength (dBm) | Score |
|---|---|
| ≥ −50 | 10 (Excellent) |
| ≥ −60 | 9 |
| ≥ −70 | 8 |
| ≥ −80 | 7 |
| ≥ −90 | 6 |
| < −90 | 4 (Poor) |
The final Signal score for the band is the average across all connected clients.
Noise Factor
Measures the background noise floor on the radio channel.
Input: Per-client Noise field from AssociatedDevice, or fallback to Device.WiFi.Radio.{i}.Stats.Noise (radio-level noise).
| Noise level (dBm) | Score |
|---|---|
| < −90 | 10 (Very quiet) |
| < −80 | 8 |
| < −70 | 6 |
| ≥ −70 | 4 (Noisy) |
Lower noise is better — a value below −90 dBm indicates a very clean radio environment.
SNR Factor (Signal-to-Noise Ratio)
Measures the gap between signal and noise for each client. Higher SNR means clearer communication.
Input: Either a vendor-specific SNR field (e.g., X_ALU-COM_SNR) or auto-calculated as SignalStrength − Noise when no dedicated SNR field is available.
| SNR (dB) | Score |
|---|---|
| ≥ 35 | 10 |
| ≥ 30 | 9 |
| ≥ 25 | 8 |
| ≥ 20 | 7 |
| ≥ 15 | 6 |
| ≥ 10 | 5 |
| ≥ 5 | 4 |
| ≥ 0 | 3 |
| ≥ −5 | 2 |
| < −5 | 1 |
Interference Factor
Evaluates how much congestion the CPE experiences from neighboring WiFi networks on the same or adjacent channels.
Inputs:
Device.WiFi.Radio.{i}.Channel— the CPE's current operating channelDevice.WiFi.Radio.{i}.CurrentOperatingChannelBandwidth— channel width (affects adjacency range)- Neighboring networks — the full list of detected WiFi neighbors from the NeighboringWiFiDiagnostic scan
How neighbors are scored:
Each detected neighbor contributes to a raw interference accumulator based on two criteria: whether it is on the same channel or an adjacent channel, and its signal strength:
| Neighbor position | Strong signal (≥ −60 dBm) | Medium (≥ −80 dBm) | Weak (< −80 dBm) |
|---|---|---|---|
| Same channel | +5.0 | +3.0 | +1.0 |
| Adjacent channel | +2.5 × proximity | +1.5 × proximity | +0.5 × proximity |
| Non-overlapping | 0 | 0 | 0 |
- Proximity is a value between 0 and 1 based on how close the neighbor's channel is within the adjacency range
- Adjacency range depends on the CPE's channel bandwidth: 20 MHz covers ~4 channels, 40 MHz covers ~8, 80 MHz covers ~16, 160 MHz covers ~32 (for 5 GHz / 6 GHz)
- A bandwidth multiplier is applied to the accumulated raw score based on the CPE's own bandwidth (40 MHz ×1.5, 80 MHz ×2, 160 MHz ×3)
The raw accumulator is then mapped to a score:
| Raw interference | Score |
|---|---|
| 0 (no neighbors on channel) | 10 |
| ≤ 10 | 8 |
| ≤ 20 | 6 |
| ≤ 30 | 4 |
| > 30 | 1 (Severe congestion) |
N/A condition: If the CPE's Channel parameter is missing from DeviceSettings, the engine cannot determine which neighbors overlap — the Interference factor shows N/A.
Standard Factor
Evaluates the WiFi standard (protocol generation) used by the CPE's radio.
Input: Device.WiFi.Radio.{i}.OperatingStandards — the active standard(s) for this radio.
The score depends on the band:
2.4 GHz band:
| Standard | Score |
|---|---|
| WiFi 7 (be) / WiFi 6 (ax) | 10 |
| WiFi 4 (n) | 8 |
| WiFi 3 (g) | 6 |
| WiFi 1 (b) | 4 |
5 GHz band:
| Standard | Score |
|---|---|
| WiFi 7 (be) / WiFi 6 (ax) | 10 |
| WiFi 5 (ac) | 8 |
| WiFi 4 (n) | 6 |
| WiFi 2 (a) | 4 |
Newer standards support higher throughput, better modulation, and features like OFDMA and MU-MIMO, which directly improve network quality.
Speed Factor
Measures actual throughput as a percentage of the theoretical maximum for the current standard and bandwidth combination.
Inputs:
LastDataDownlinkRateandLastDataUplinkRatefrom each client (in kbps)OperatingStandardsandCurrentOperatingChannelBandwidthfrom the radio
The engine calculates: average_speed = (downlink + uplink) / 2, then compares it against a reference throughput table:
| Standard | 20 MHz | 40 MHz | 80 MHz | 160 MHz |
|---|---|---|---|---|
| n | 300 Mbps | 600 Mbps | — | — |
| ac | 437 Mbps | 875 Mbps | 1750 Mbps | 3500 Mbps |
| ax | 574 Mbps | 1148 Mbps | 2402 Mbps | 4804 Mbps |
| be | 690 Mbps | 1380 Mbps | 2880 Mbps | 5760 Mbps |
| Actual / Max ratio | Score |
|---|---|
| ≥ 80% | 10 |
| ≥ 60% | 8 |
| ≥ 40% | 6 |
| < 40% | 4 |
N/A condition: If downlink or uplink rate data is missing for all clients, Speed shows N/A.
Additional Notes
- Without a Service/TestProfile, the system auto-discovers radios from DeviceSettings (works for standard TR-181 CPEs with sequential indexes 1, 2)
- For TR-098 or vendor-specific CPEs, explicit Service configuration is required
- Score weights are per-Service — you can create multiple Services with different weight profiles for different environments
- The
{i}placeholder is the only substitution the engine performs. All other numbers in paths are literal
TR-098 Quick Reference
| Field | Example value |
|---|---|
| Radio index | 1 |
| AP indexes | 1 |
| Clients table path | InternetGatewayDevice.LANDevice.1.WLANConfiguration.{i}.AssociatedDevice. |
| Channel override | InternetGatewayDevice.LANDevice.1.WLANConfiguration.{i}.Channel |
| Noise override | InternetGatewayDevice.LANDevice.1.WLANConfiguration.{i}.Stats.Noise |
| Hosts table path | InternetGatewayDevice.LANDevice.1.Hosts.Host. |
| SNR client field | X_ALU-COM_SNR (vendor-specific) |
No comments to display
No comments to display