Device logs
Overview
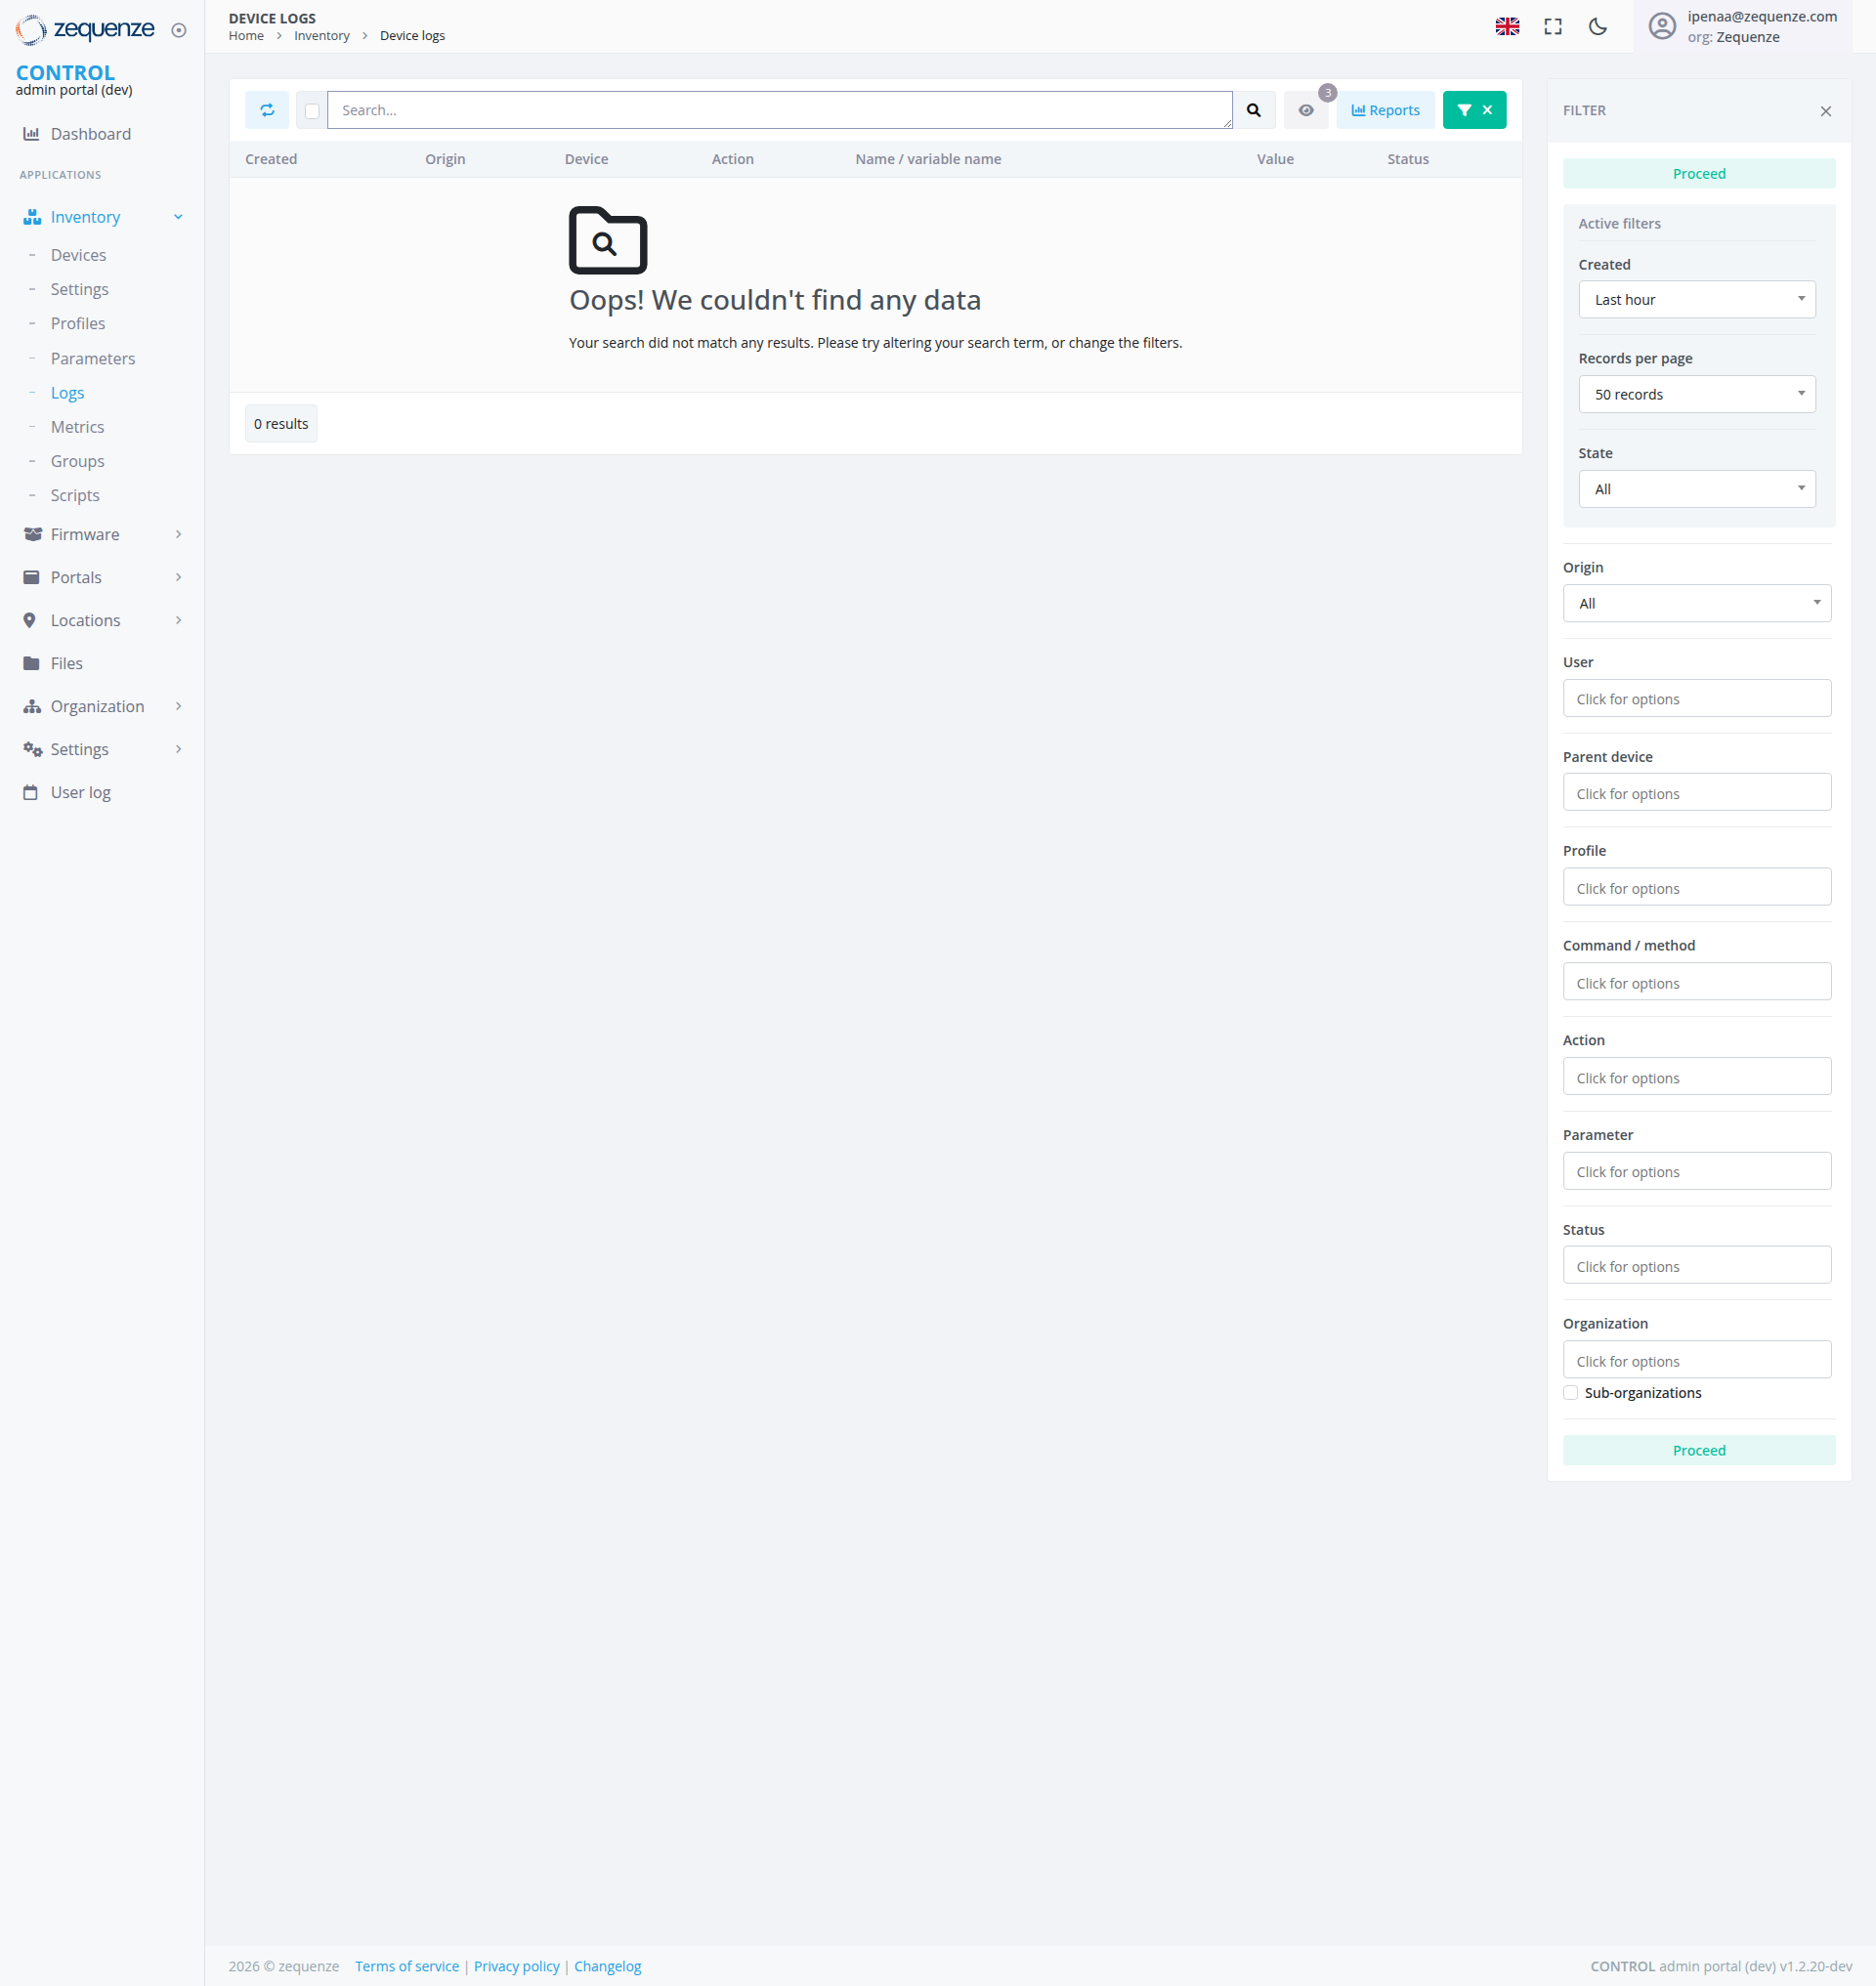
The Device Logs section of the Zequenze CONTROL Portal provides a comprehensive view of all device activity and configuration changes. This page displays real-time and historical log entries for network devices, allowing administrators to monitor device events, track configuration modifications, and troubleshoot network issues.
Key Features
- Real-time Log Monitoring: View live device events and configuration changes as they occur
- Comprehensive Search: Advanced search functionality to filter logs by various criteria
- Export Capabilities: Export log data for external analysis and reporting
- Reports Generation: Generate custom reports from filtered log data
- Advanced Filtering System: Expandable filter panel with comprehensive filtering options for precise log analysis
- No Data State Management: Clear messaging and guidance when search results return no data
UI Elements
Header Section
- Search Bar: Located at the top center for quick log entry searches
- Reports Button: Light blue "Reports" button for generating custom reports
- Filter Toggle: Green "FILTER" button with close (X) option for toggling the filter panel
Main Data Table
The central table displays log entries with the following columns:
- Created: Timestamp of when the event occurred
- Origin: Source of the event (e.g., "Automatic")
- Device: Device identifier or name
- Action: Type of action performed (e.g., "Set", "Create", "Event: Boot", etc.)
- Name/Variable Name: Specific parameter or event name affected
- Value: Current or new value of the parameter
- Status: Overall status indicator
Current Data Display
The page currently shows no search results with a "No Data" state displaying:
- Search Icon: Large magnifying glass icon with folder representation indicating search functionality
- No Data Message: "Oops! We couldn't find any data" prominently displayed
- Helpful Text: "Your search did not match any results. Please try altering your search term, or change the filters."
- Results Counter: "0 results" shown at the bottom left
Filter Panel (Right Side)
The expandable filter panel is currently open and displays comprehensive filtering options:
- Panel State: Currently expanded, showing all available filter options
- Toggle Control: Green filter button with X close option for showing/hiding the panel
- Active Filters Header: "Active filters" section at the top showing currently applied filters
- Primary Action: Green "Proceed" button at the top for applying filter selections
-
Filter Options (currently visible):
- Created: Time-based filtering with "Last hour" dropdown selection
- Records per page: Currently set to "50 records"
- State: Dropdown with "All" selected
- Origin: Dropdown with "All" selected
- User: "Click for options" field
- Parent device: "Click for options" field
- Profile: "Click for options" field
- Command / method: "Click for options" field
- Action: "Click for options" field
- Parameter: "Click for options" field
- Status: "Click for options" field
- Organization: "Click for options" field with "Sub-organizations" checkbox option
- Apply Button: Green "Proceed" button at the bottom of the panel to apply all selected filters
User Interactions
Searching and Filtering
- Quick Search: Enter search terms in the top search bar and click the search icon
- Filter Panel Access: Click the green "FILTER" button to expand the advanced filtering options
- Advanced Filtering: Use the expandable filter panel on the right with multiple filtering options including time-based, state, origin, and parameter filters
- Panel Management: Use the X button to close the filter panel when not needed
- Filter Application: Use the green "Proceed" buttons (at top and bottom of filter panel) to apply selected filters
- Dropdown Interactions: Click on dropdown menus for Created, Records per page, State, and Origin filters to select specific options
- Expandable Options: Click on "Click for options" fields to access additional filtering criteria
- Sub-organization Filtering: Use the "Sub-organizations" checkbox under Organization to include or exclude child organizations
Data Management
- Generate Reports: Use the "Reports" button to create custom analytical reports
- Filter Toggle: Use the green "FILTER" button to show/hide the filtering interface
- Pagination Control: Adjust records per page display using the dropdown in the filter panel
Event Analysis
- Search Refinement: When encountering no results, modify search terms or adjust filters as suggested
- Filter Adjustment: Use various filter options to expand or narrow search criteria
- Time-based Analysis: Use the "Last hour" filter and other time controls for temporal analysis
Navigation
Access Path
Related Sections
- Dashboard: Return to main dashboard for overview
- Inventory: Access device inventory and management
- Settings: Configure logging preferences and parameters
Data Displayed
No Results State
When no data matches the current search and filter criteria, the system displays:
- Clear Visual Indicator: Large search icon with folder to indicate the search function
- Informative Message: Clear explanation that no data was found
- Helpful Guidance: Suggestion to modify search terms or adjust filters
- Filter State Visibility: Current active filters remain visible for easy modification
Event Types (When Data Available)
- Configuration Events: Device parameter setting and management operations
- Creation Events: Device interface and component creation events
- Boot Events: CWMP '1 BOOT' events for device startup monitoring
- Auto-onboarding Events: Automated device provisioning and configuration events
- Management Events: Device management server configuration activities
Actions Available
Primary Actions
- Search: Filter and locate specific log entries
- Generate Reports: Create analytical reports from log data
- Toggle Filters: Use the green "FILTER" button to show/hide advanced filtering options
- Real-time Monitoring: View live device events and changes
Filtering Actions
- Panel Toggle: Click the green "FILTER" button to expand/collapse filtering options
- Time Filtering: Use "Created" dropdown to filter by time periods (Last hour, etc.)
- Records Control: Adjust "Records per page" to control data display (currently 50 records)
- State Filtering: Filter by device operational state using the State dropdown
- Origin Filtering: Filter by event source or origin using the Origin dropdown
- User-based Filtering: Access user filtering options by clicking "Click for options" in the User field
- Parent Device Filtering: Access parent device filtering by clicking "Click for options"
- Profile Filtering: Access profile filtering by clicking "Click for options"
- Command/Method Filtering: Access command/method filtering by clicking "Click for options"
- Action Filtering: Access action filtering by clicking "Click for options"
- Parameter Filtering: Access parameter-based filtering by clicking "Click for options"
- Status Filtering: Access status filtering by clicking "Click for options"
- Organization Filtering: Access organization filtering by clicking "Click for options", with option to include sub-organizations via checkbox
- Filter Application: Use the green "Proceed" buttons at the top and bottom of the filter panel to apply all selected filters
- Active Filter Management: View currently applied filters in the "Active filters" section at the top of the filter panel
Search Optimization Actions
- Search Term Modification: Alter search terms when no results are found
- Filter Adjustment: Modify active filters to broaden or refine search scope
- Filter Reset: Clear filters to expand search results
Notes/Tips
- No Results Guidance: When no data is found, the system provides clear guidance to modify search terms or adjust filters
- Filter Visibility: Active filters remain visible even when no results are found, making it easy to identify and modify search parameters
- Search Refinement: Use the search functionality combined with advanced filters for highly specific log queries
- Dual Apply Buttons: The filter panel includes "Proceed" buttons at both the top and bottom for convenient filter application regardless of scroll position
- Active Filter Tracking: The "Active filters" section at the top of the filter panel shows currently applied filters for easy filter state management
- Time-based Filtering: Use the "Last hour" and other time-based filters for temporal log analysis
- Pagination Control: Adjust the records per page (currently 50) to optimize data viewing and performance
- Filter Visibility: When the filter panel is expanded, all filtering options are clearly visible for immediate access
- Interactive Filter Fields: Several filter options display "Click for options" to indicate they contain expandable selection menus
- Organization Hierarchy: Use the "Sub-organizations" checkbox to include or exclude logs from child organizations in your search
- Search Optimization: When encountering no results, try broadening search criteria or adjusting time-based filters
- Real-time Updates: The log view updates automatically to show new events when they occur
No comments to display
No comments to display