Results: Traffic per AP (GBytes)
Overview
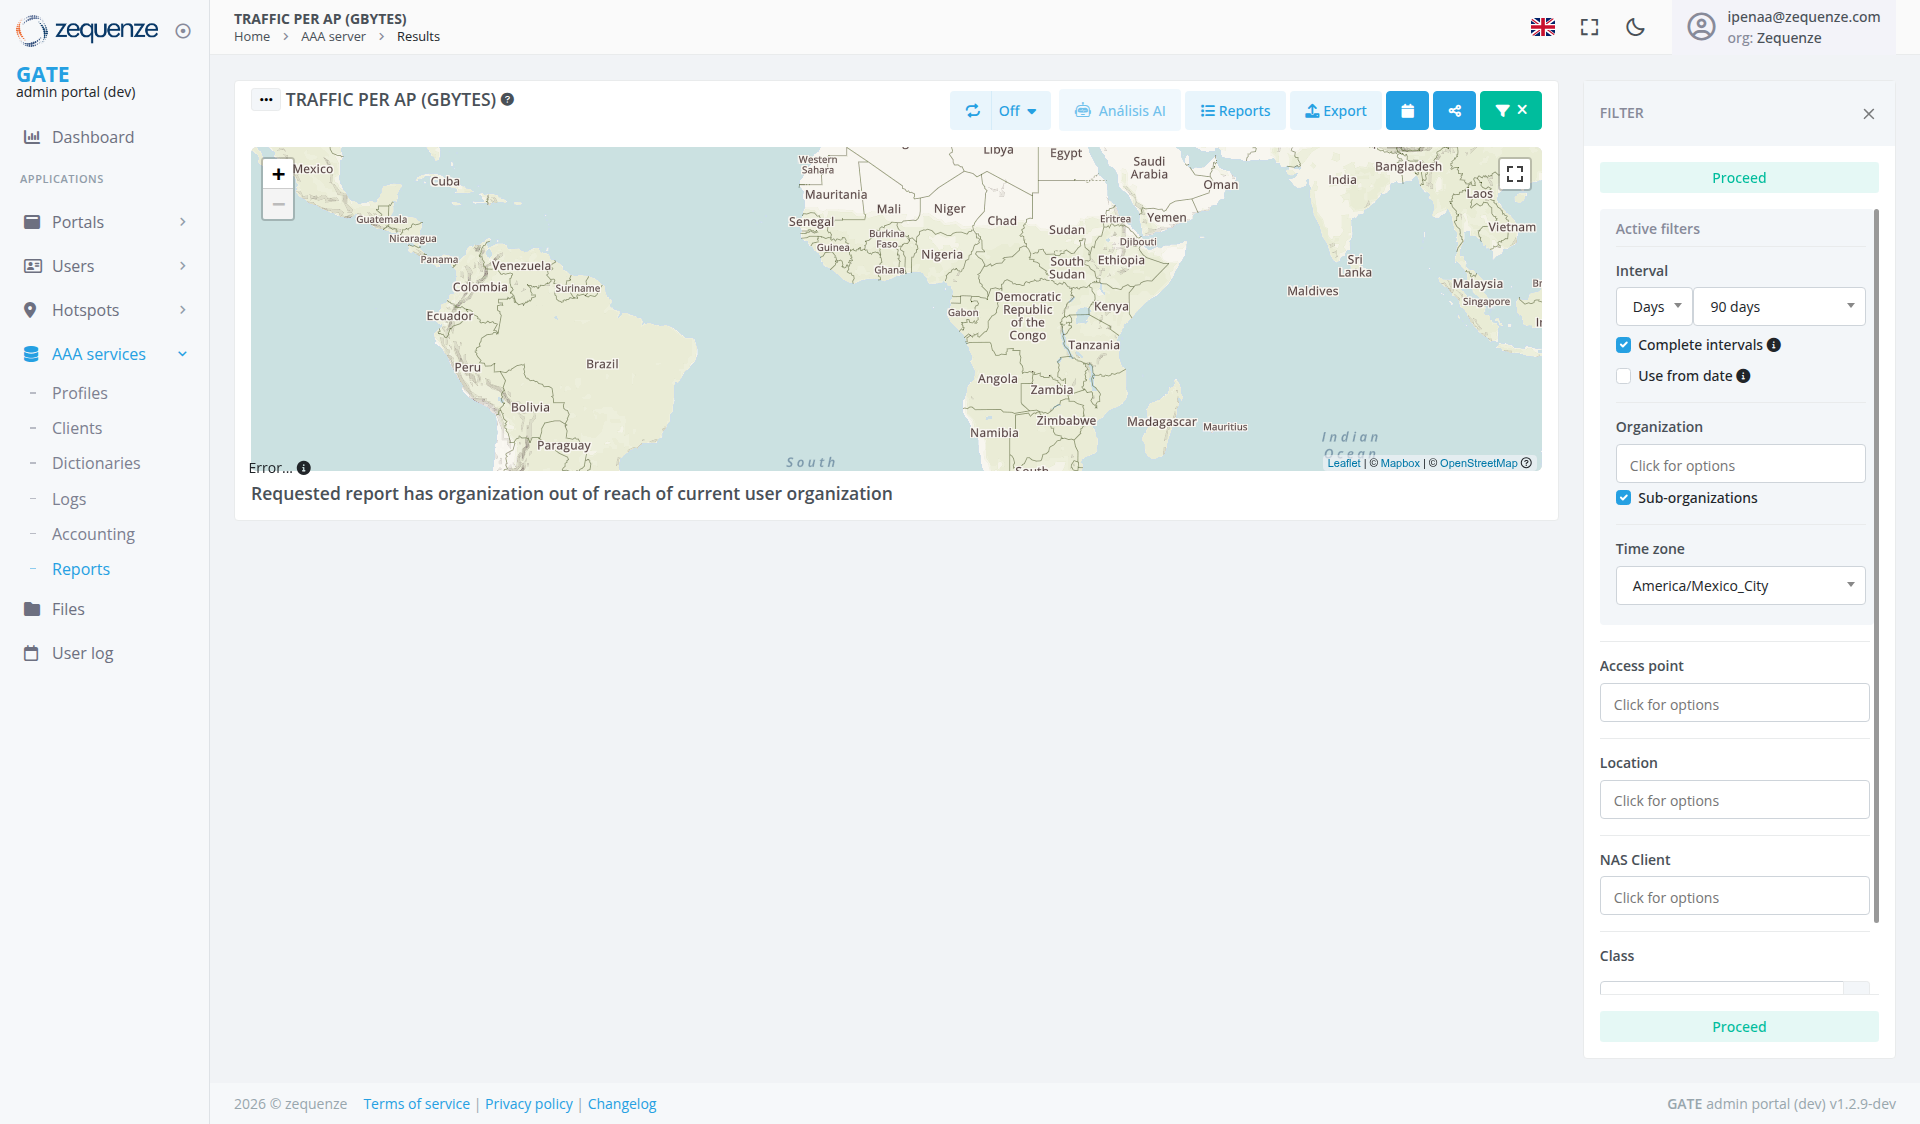
The Traffic per AP (GBytes) report provides a comprehensive view of data traffic usage across Access Points (APs) in your network infrastructure. This report displays both incoming and outgoing traffic data measured in gigabytes, with an interactive map visualization and detailed tabular data for network traffic analysis.
Key Features
- Interactive Map Visualization: Geographic representation of access points with traffic intensity overlays
- Real-time Traffic Monitoring: Displays current traffic data with configurable refresh intervals
- Customizable Time Periods: Filter data by specific date ranges (currently set to 90 days)
- Traffic Analysis: Separate columns for incoming, outgoing, and total traffic measurements
- Export Capabilities: Options to export data and generate reports
- Advanced Filtering: Multiple filter options for detailed data analysis
UI Elements
Map Controls
- Zoom Controls: Plus (+) and minus (-) buttons for map navigation
- Fullscreen Toggle: Expand map to full screen view
- Style Selector: Change map visualization styles
- Reset Button: Return to default map view
- Locations Toggle: Show/hide location markers
Top Control Bar
- Off Toggle: Option to disable certain display features (currently shown as "Off")
- Analysis AI Button: AI-powered analytics functionality
- Reports Button: Access to report generation
- Export Button: Data export functionality
- Share Button: Blue share functionality button
- Filter Toggle Buttons: Green button with white downward arrow for opening/closing the filter panel
Filter Panel (Right Side)
- Filter Header: "FILTER" heading with X close button in top-right corner
- Proceed Button: Blue "Proceed" button located at the top of the filter panel for applying changes
- Active Filters Section: Shows currently active filters with "Active filters" heading
- Interval Selector: Currently set to "Days" with 90-day period
- Complete Intervals: Checkbox option for complete data intervals (currently enabled)
- Use from date: Additional date filtering option (currently enabled)
- Organization Section: Shows "Click for options" placeholder text
- Sub-organizations: Checkbox option for including sub-organizations (currently enabled)
- Time Zone: Set to America/Mexico_City
- Access Point Field: Shows "Click for options" placeholder text
- Location Field: Shows "Click for options" placeholder text
- NAS Client Field: Shows "Click for options" placeholder text
- Class Field: Empty field for class-based filtering
- Bottom Proceed Button: Blue "Proceed" button at the bottom of the filter panel
Data Status
- Error Message: The system displays "Requested report has organization out of reach of current user organization" indicating a permissions or access issue with the selected organization scope
User Interactions
Map Visualization Controls
- Use Off toggle to disable specific display elements
- Access Analysis AI functionality for intelligent traffic pattern insights
- Use Reports and Export functions from the top control bar
- Click the Share button (blue) to share report data or views
- Click the green filter toggle button (with white downward arrow) to open or close the filter panel
Filtering Data
- Click either Proceed button (top or bottom of filter panel) to apply filter changes
- Use the X close button in the filter panel header to close the filter panel
- Use the green filter toggle button in the top control bar to open or close the filter panel
- View Active filters section to see currently applied filters
- Use the Interval dropdown to select time periods (Days, Weeks, Months)
- Adjust the date range using the period selector (currently 90 days)
- Toggle Complete intervals checkbox for comprehensive data sets (currently enabled)
- Enable Use from date for specific start date filtering (currently enabled)
- Click Organization field to select specific organizations from the dropdown options
- Toggle Sub-organizations checkbox to include or exclude sub-organization data (currently enabled)
- Click Access point field to select specific access points from the dropdown options
- Click Location field to filter by specific location from the dropdown options
- Click NAS Client field to filter by specific NAS clients from the dropdown options
- Use Class field for class-based filtering options
Map Navigation
- Use zoom controls to focus on specific geographic areas
- Click locations on the map to view detailed AP information
- Toggle between different map styles for better visualization
- Use fullscreen mode for detailed geographic analysis
Data Export and Sharing
- Click the Export button in the top control bar to download current data set
- Use the Share button (blue) to share reports or data views with team members
- Use Reports option to generate formatted reports
- Use Analysis AI for automated insights and pattern recognition
- Use the green filter toggle button to manage filter panel visibility
Navigation
Current Data Status
The report currently shows an "Error" with the message "Requested report has organization out of reach of current user organization" indicating that there is a permissions or access issue preventing the display of traffic data for the selected organizational scope.
Data Access Status
- An access permission error is preventing data retrieval
- The current user organization may not have sufficient privileges to view the requested report data
- Organization filter settings may need to be adjusted to match user permissions
Actions Available
Data Management
- Filter Results: Apply various filters to refine data display using either Proceed button (top or bottom of filter panel)
- Toggle Filter Panel: Use the green filter toggle button in the top control bar to open or close the filter panel
- Export Data: Download traffic data using the Export button in top control bar
- Share Data: Use the Share button (blue) to collaborate and share report views
- Generate Reports: Create formatted reports using the Reports button
- AI Analysis: Leverage artificial intelligence for traffic pattern analysis using the Analysis AI button
- Refresh Data: Update display with latest traffic information
- Manage Filters: Close filter panel using the X button in the filter header, use the green filter toggle button in the top control bar to open or close the panel
- Select Organizations: Use the Organization dropdown field to select appropriate organizations within user permissions
- Select Access Points: Use the Access point dropdown field to filter specific access points
- Select Locations: Use the Location dropdown field to filter by specific locations
- Select NAS Clients: Use the NAS Client dropdown field to filter by specific network access servers
- Class Filtering: Use the Class field for additional filtering options
Visualization Options
- Display Controls: Use Off toggle to disable specific visual elements
- Style Changes: Modify map appearance and data representation
- Time Range Adjustment: Change reporting periods for trend analysis
Notes/Tips
- Permission Issues: If you see "organization out of reach" error, contact your administrator to verify organization access permissions or adjust organization filter to match your user privileges
- AI-Powered Insights: Use the Analysis AI button for automated traffic pattern analysis and recommendations
- Filter Panel Management: Use the green filter toggle button in the top control bar to open or close the filter panel, or the X close button in the filter header for closing
- Filter Application: Use either Proceed button (available at both top and bottom of filter panel) to apply filter changes after making selections
- Active Filters: Monitor the Active filters section to see which filters are currently applied
- Sub-organization Control: Toggle the Sub-organizations checkbox to include or exclude data from child organizations (currently enabled)
- Collaboration: Utilize the Share button for team collaboration and report distribution
- Organization Selection: Use the Organization dropdown to select organizations within your access permissions
- Access Point Selection: Use the Access point dropdown to filter data for specific access points
- Location Filtering: Use the Location dropdown to focus on traffic data from specific geographic locations
- NAS Client Filtering: Use the NAS Client dropdown to filter by specific network access server clients
- Class-based Filtering: Utilize the Class field for additional filtering criteria
- Data Completeness: Enable "Complete intervals" and "Use from date" for more accurate reporting (both currently enabled)
- Time Zone Awareness: Ensure correct time zone setting for accurate temporal analysis
Best Practices
- Use either Proceed button to ensure filter changes are properly applied
- Leverage the Analysis AI functionality for automated insights and anomaly detection
- Use the Share functionality to collaborate with team members on traffic analysis
- Use the green filter toggle button for efficient filter panel management while preserving workspace
- If encountering permission errors, verify organization selection matches your user access level
- Contact system administrator if persistent access issues occur with organizational data
- Export data for historical trend analysis and reporting
- Apply appropriate filters using the dropdown options to focus on specific network segments or time periods
- Utilize the filter panel's toggle and close buttons for efficient filter management
- Toggle sub-organization inclusion based on reporting scope requirements and permissions
- Use the green filter toggle button to open or close the filter panel when you need to maximize map viewing area for detailed geographic analysis
- Monitor the Active filters section to stay aware of currently applied filters
- Use the Organization, Access point, Location, NAS Client, and Class dropdown fields to narrow down results to specific network components or criteria within your permitted scope
- Ensure selected organization scope aligns with your user permissions to avoid access errors
No comments to display
No comments to display