Results: New accounting sessions
Overview
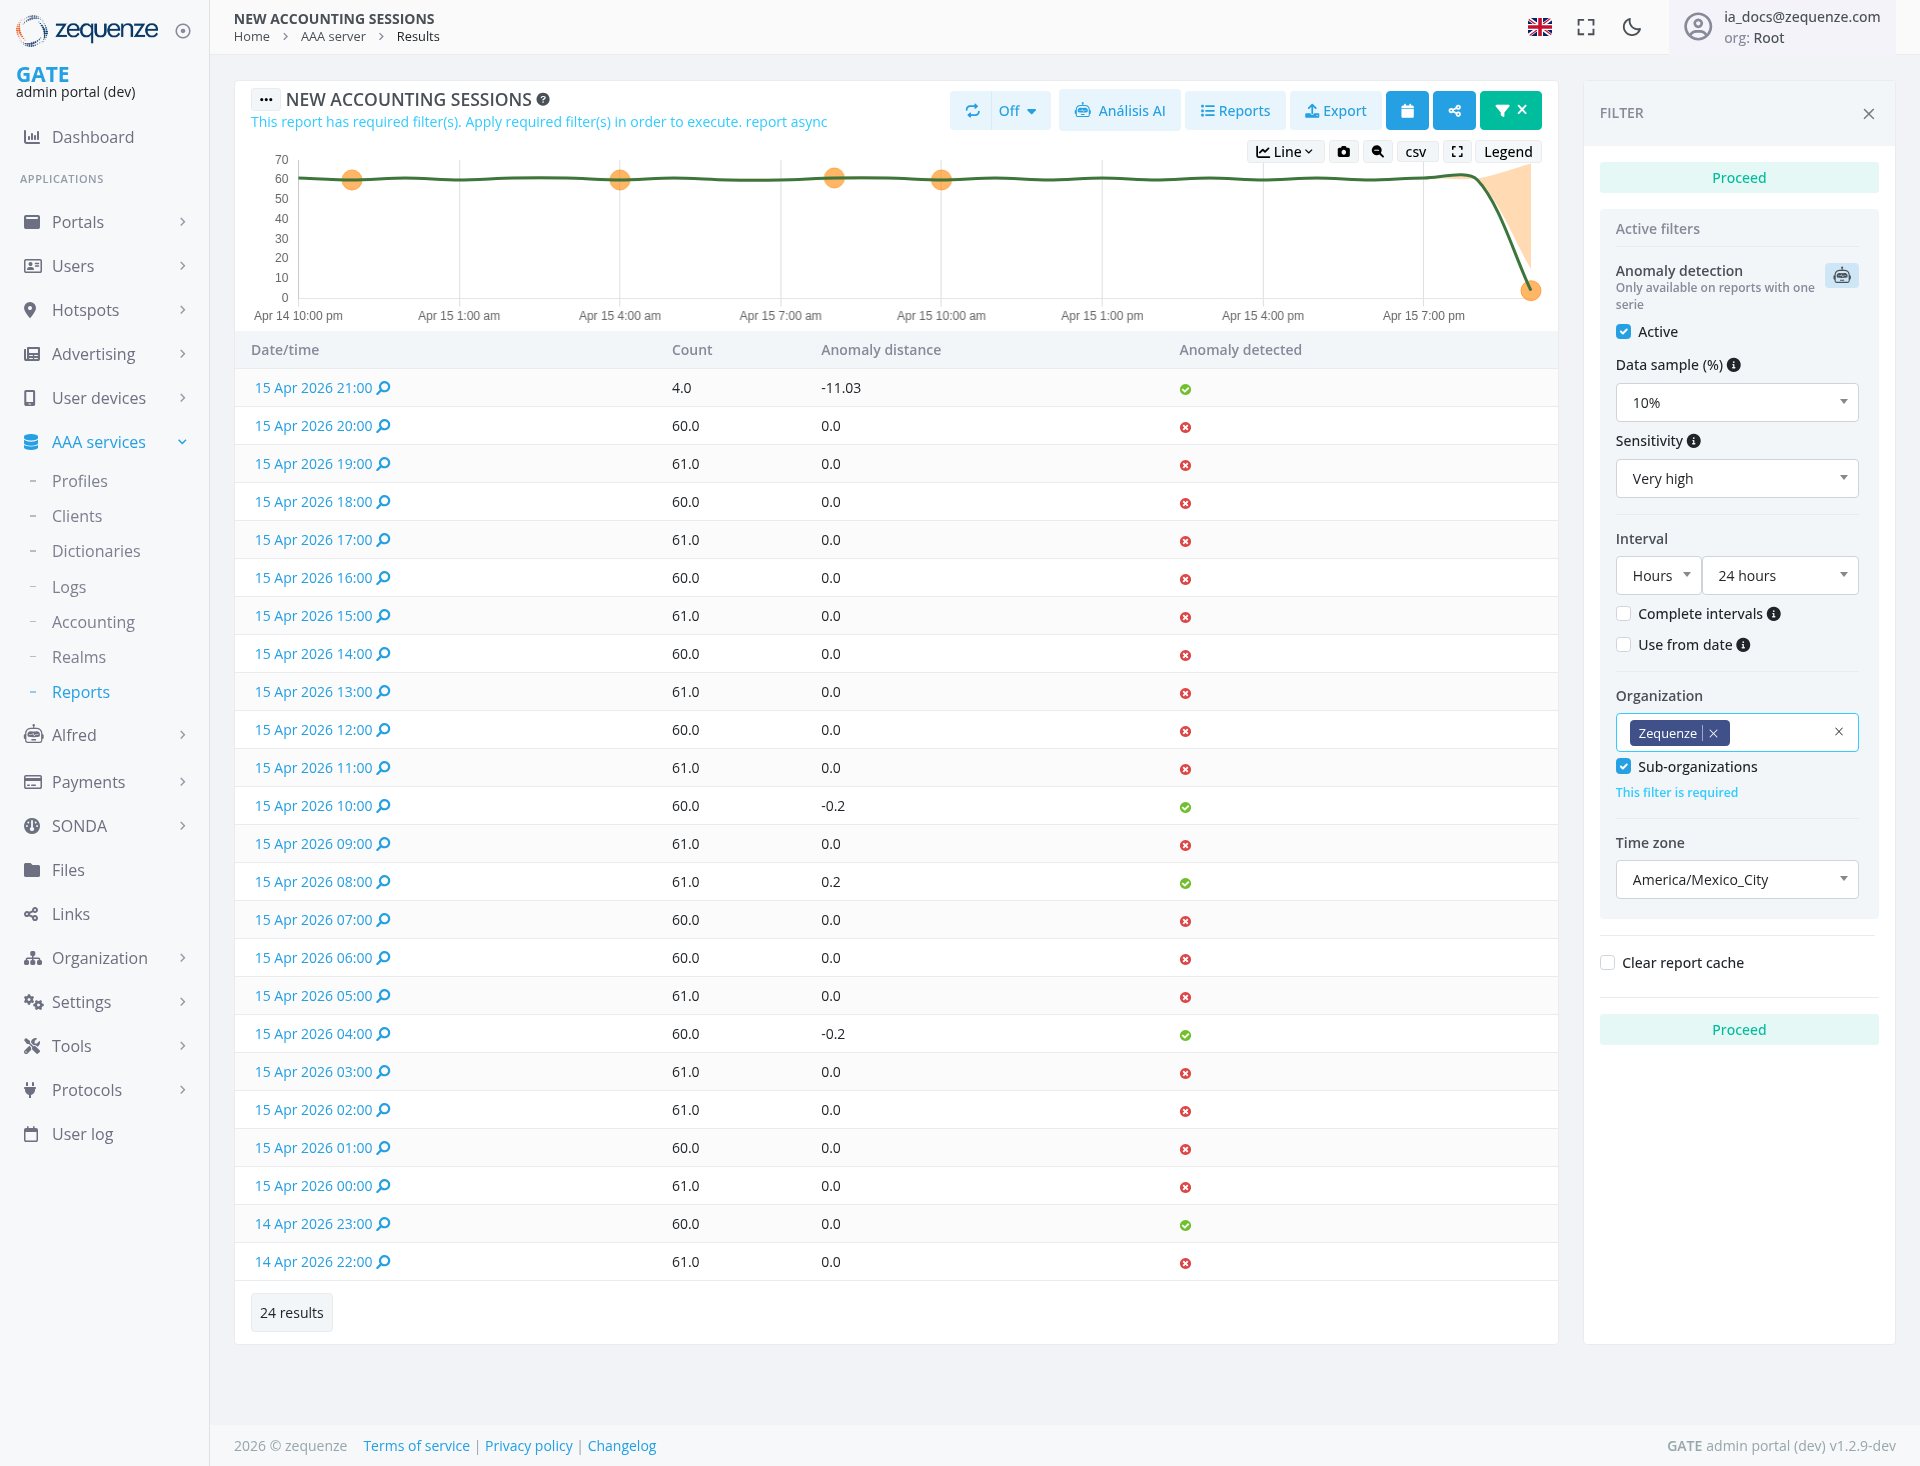
The NEW ACCOUNTING SESSIONS report in the GATE admin portal provides comprehensive monitoring and anomaly detection for AAA (Authentication, Authorization, and Accounting) server sessions. This page displays time-series data with advanced analytics capabilities, allowing administrators to track session counts, identify anomalies, and analyze patterns over time.
Key Features
- Real-time Session Monitoring: Visualizes accounting session data with interactive line graphs showing session counts over time
- Anomaly Detection: Automated detection system that identifies unusual session patterns and flags them with distance metrics
- Time-series Analysis: Displays historical session data with customizable time intervals
- Multi-organization Support: Includes sub-organization filtering capabilities
- Export Functionality: Allows data export for external analysis and reporting
- Configurable Sensitivity: Adjustable anomaly detection parameters for fine-tuned monitoring
UI Elements
Top Action Bar
Filter Panel (Right Sidebar)
Anomaly Detection Settings
- Active: Checkbox to enable/disable anomaly detection (currently checked)
- Data sample (%): Dropdown set to "10%" - controls the percentage of data used for analysis
- Sensitivity: Dropdown set to "Very high" - adjusts the threshold for anomaly detection
Time Configuration
- Interval: Set to "Hours" with "24 hours" selected - defines the time window for data aggregation
- Complete intervals: Checkbox option for interval boundary alignment
- Use from date: Checkbox for custom date range selection
Organization Filters
- Organization: Shows "Zequenze" tag with an "X" for removal
- Sub-organizations: Checkbox (checked) to include data from sub-organizations
Time Zone
- Time zone: Dropdown showing "America/Mexico_City" - sets the timezone for all timestamps
Report Cache Management
- Clear report cache: Button to refresh cached report data for updated results
Main Chart Area
The line graph displays:
- X-axis: Date/time stamps (Apr 14 10:00 pm through Apr 15 7:00 pm)
- Y-axis: Session count (scale from 10 to 70)
- Orange data points: Mark specific time intervals on the timeline
- Trend line: Shows session count progression over time with a stable pattern around 60-61 sessions, followed by a dramatic drop to approximately 10 sessions at the end of the period
Data Table
Columns include:
- Date/time: Timestamp with clickable link icon for drill-down
- Count: Session count value (ranging from 4.0 to 61.0)
- Anomaly distance: Numeric value showing deviation from normal (-11.03 to 0.2)
- Anomaly detected: Visual indicator (green checkmark or red dot)
User Interactions
Viewing Session Data
- The chart automatically displays session trends based on active filters
- Hover over data points on the line graph to see detailed values
- Click on timestamps in the table to view session details
- Scroll through the table to review all 24 results
Applying Filters
- Click the FILTER button in the top-right to open the filter panel
- Adjust anomaly detection parameters:
- Toggle "Active" to enable/disable detection
- Modify "Data sample (%)" for analysis depth
- Change "Sensitivity" level (Very high, High, Medium, Low)
- Set time interval preferences (hours, days, weeks, months)
- Select organization and include/exclude sub-organizations
- Choose appropriate timezone for data display
- Use Clear report cache to refresh cached data when needed
- Click Proceed to apply changes
Analyzing Anomalies
- Review rows marked with red dots in the "Anomaly detected" column
- Check "Anomaly distance" values - higher absolute numbers indicate greater deviation
- Orange data points on the chart mark time intervals for analysis
- The chart shows a significant dramatic drop at the end of the monitoring period
Exporting Data
- Click the Export button in the top toolbar
- Choose between:
- Line chart view for visual export
- CSV format for raw data export
- Click Legend to include/exclude legend in exports
Navigation
Accessing This Page
From the left sidebar:
Breadcrumb Navigation
Located at the top: Home > AAA server > Results
Related Sections
- Profiles: User profile management
- Clients: AAA client configuration
- Dictionaries: Attribute definitions
- Logs: Detailed logging information
- Files: File management for configurations
Data Displayed
Session Metrics
- Count: Total number of accounting sessions in each time interval
- Date/time: Precise timestamp for each data point
- Anomaly distance: Statistical measure of deviation from expected values (negative values indicate below-normal activity, positive values indicate above-normal)
Anomaly Indicators
- Green checkmark: Normal session activity within expected parameters
- Red dot: Anomaly detected based on configured sensitivity and window size
- Orange markers: Visual data points on the timeline chart
Current Data Set
The report shows 24 results spanning from 15 Apr 2026 21:00 to 14 Apr 2026 22:00, with:
- Session counts ranging from 4.0 to 61.0
- One major anomaly at 21:00 with -11.03 distance and 4.0 count
- Multiple sessions showing normal activity with 0.0 anomaly distance
- Several additional minor anomalies detected with -0.2 distance values
Actions Available
Primary Actions
- Proceed: Applies current filter configuration and refreshes data
- Análisis AI: Launches AI-powered analysis tools for deeper insights
- Export: Downloads report data in selected format
- Share: Distributes report to team members or stakeholders
- Save: Preserves current view configuration for future use
Data Management
- Refresh: Manually updates the report with latest data
- Toggle Auto-refresh: Enables/disables automatic data updates
- Clear report cache: Refreshes cached report data for updated results
- Clear Filters: Removes active filters by clicking "X" on filter tags
Drill-down Capabilities
- Click on any timestamp link (blue link with arrow icon) to view detailed session information
- Access individual session records for troubleshooting and analysis
Notes/Tips
Best Practices
- Sensitivity Settings: Start with "Very high" sensitivity to catch all potential anomalies, then adjust based on false positive rates
- Data Sampling: 10% sample size is suitable for large datasets; increase for more precise anomaly detection on smaller datasets
- Time Intervals: 24-hour intervals provide good balance between detail and overview for most monitoring scenarios
- Cache Management: Use "Clear report cache" when data appears outdated or after configuration changes
Interpreting Anomalies
- Negative anomaly distance: Indicates unusually low session counts (potential service issues)
- Positive anomaly distance: Indicates unusually high session counts (potential security events or legitimate traffic spikes)
- Zero distance: Sessions within normal expected range
Performance Considerations
- Enable "Sub-organizations" only when cross-organizational analysis is required
- Use appropriate time intervals to balance detail vs. system performance
- Export to CSV for complex analysis in external tools like Excel or data analysis platforms
- Clear report cache periodically for optimal performance
Troubleshooting
- If no anomalies appear but issues are suspected, lower the sensitivity setting
- Verify timezone settings match your operational requirements
- Check that the "Active" checkbox is enabled for anomaly detection to function
- Ensure "Zequenze" organization filter is correctly applied for relevant data
- Use "Clear report cache" if data appears stale or inconsistent
URL Parameters
The page URL contains several parameters that define the current view:
visualization_type=line: Display modeorganization__in=2: Organization ID filtersuborgs=1: Sub-organizations includedinterval=24h: 24-hour time intervalsanomaly=1: Anomaly detection enabledwindow=10: Detection window sizesigma=1: Statistical sensitivity parameter
No comments to display
No comments to display