Elements
Overview
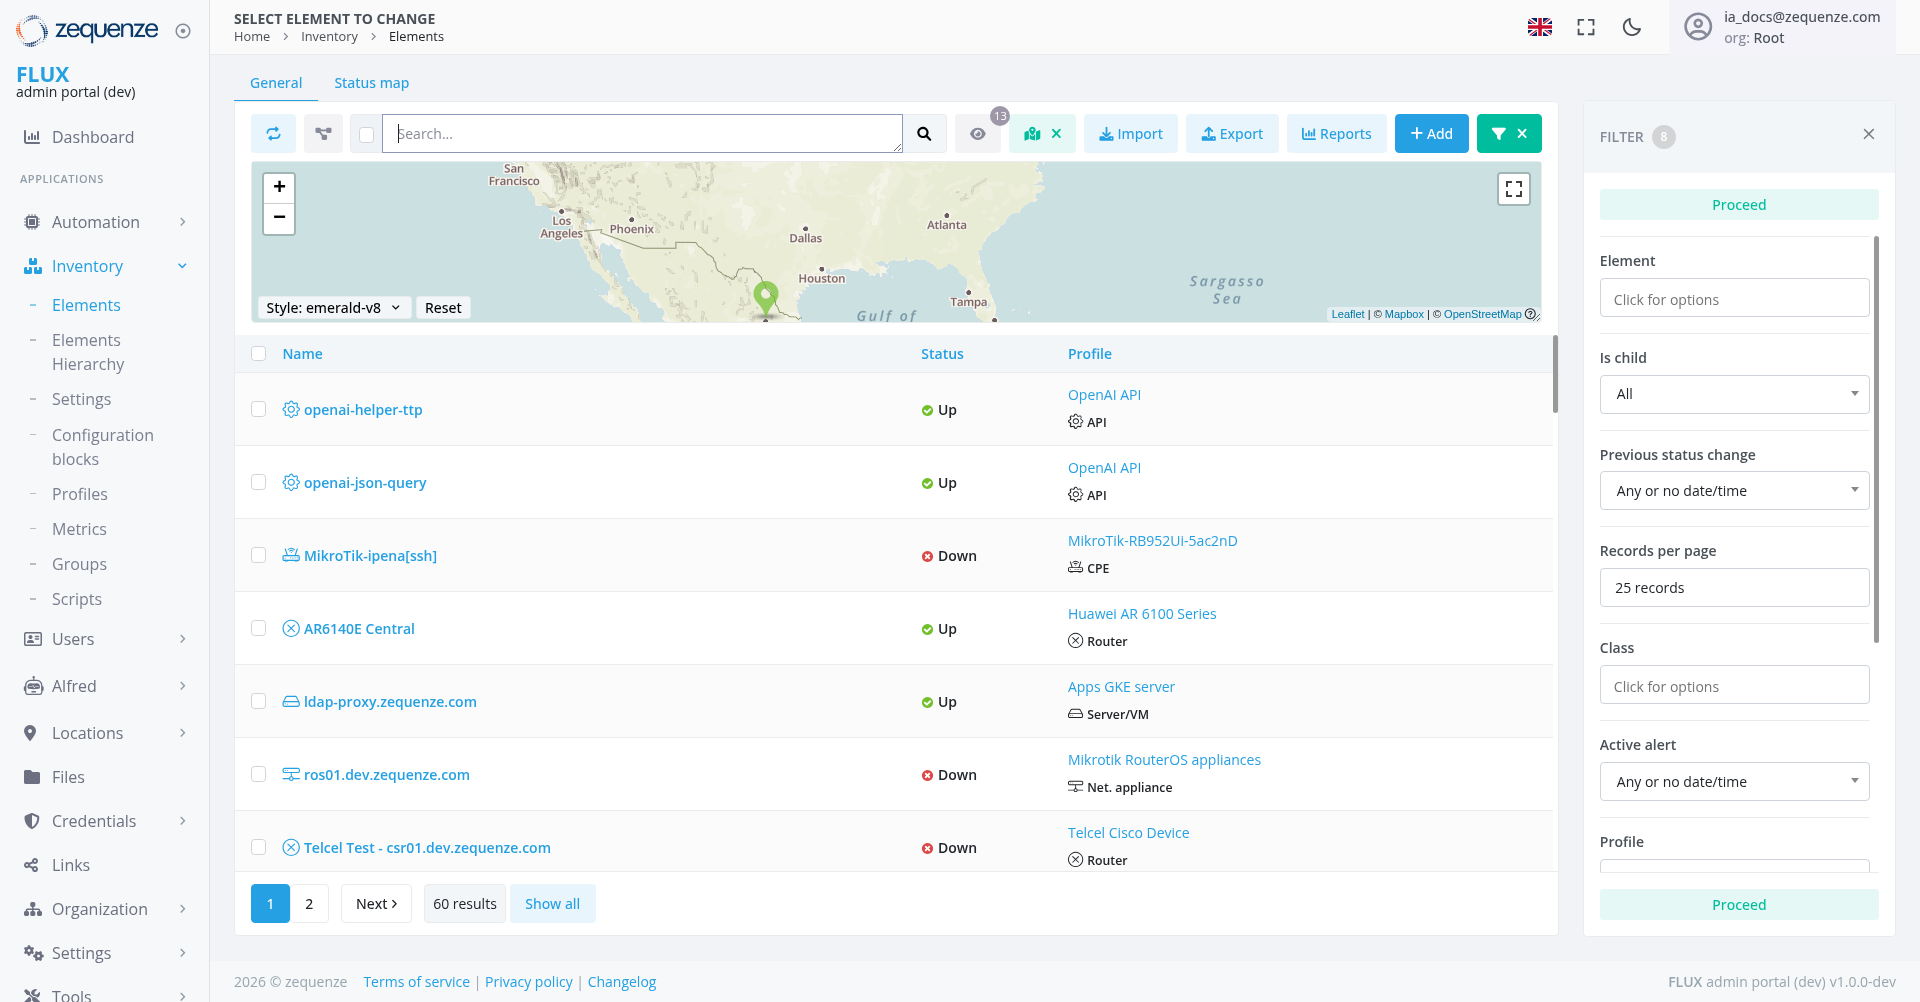
The Inventory Elements page in the Zequenze FLUX Portal provides a comprehensive view of all network elements and devices managed within the system. This centralized dashboard allows administrators to monitor device status, manage configurations, and perform various operations on network infrastructure components.
Key Features
- Real-time Status Monitoring: View current operational status of all network elements
- Advanced Filtering: Multiple filter options to quickly locate specific elements
- Bulk Operations: Import, export, and manage multiple elements simultaneously
- Status Tracking: Monitor changes in device states over time
- Profile Management: View and manage device profiles and configurations
- Interactive Map View: Geographical visualization of network elements with zoom controls
UI Elements
Navigation Bar
- Home → Inventory → Elements breadcrumb navigation
- Language selector (English flag icon)
- User profile indicator showing logged-in user (la_docs@zequenze.com)
- Organization context (org: Root)
Tab Navigation
- General: Current active tab showing element listing
- Status map: Tab for geographical distribution view
Map Controls
- Interactive Map: Geographical display showing element locations across the United States
- Zoom Controls: Plus (+) and minus (-) buttons for map navigation
- Fullscreen Toggle: Expand map to fullscreen view
- Style Selector: "emerald-v8" style dropdown with Reset option
- Map Attribution: Leaflet © Mapbox © OpenStreetMap attribution
Search and Filter Controls
- Search Bar: Text-based search functionality for finding specific elements
- Import Button: Upload element configurations from external files
- Export Button: Download element data and configurations
- Reports Button: Generate reports on element status and performance
- Add Button (+): Create new network elements
- X Button: Clear current filters or selections
- Filter Panel: Advanced filtering options on the right side with "Proceed" button
Data Displayed
The main table shows detailed information about network elements:
Column Structure
- Name: Element identifier with clickable links
- Status: Current operational state (Up/Down with colored indicators)
- Profile: Associated device profile and type information
Element Types and Status
The table displays various network elements including:
- openai-helper-ttp: API helper (Status: Up) using OpenAI API profile
- openai-json-query: JSON query service (Status: Up) using OpenAI API profile
- MikroTik-ipenal[ssh]: Network device (Status: Down) using MikroTik-RB952Ui-5ac2nD CPE profile
- AR6140E Central: Network router (Status: Up) using Huawei AR 6100 Series Router profile
- ldap-proxy.zequenze.com: Server (Status: Up) using Apps GKE server Server/VM profile
- ros01.dev.zequenze.com: Network appliance (Status: Down) using Mikrotik RouterOS appliances Net. appliance profile
- Telcel Test - cpr01.dev.zequenze.com: Test router (Status: Down) using Telcel Cisco Device Router profile
Status Indicators
- 🟢 Green dot: Element is operational (Up)
- 🔴 Red dot: Element is down or experiencing issues
- Profile badges: Show device categories (API, CPE, Router, Server/VM, Net. appliance, etc.)
User Interactions
Map Navigation
- Use zoom controls to navigate the geographical view
- Toggle fullscreen mode for detailed map analysis
- Change map styles using the style selector
- Reset map view to default settings
Search and Discovery
- Use the search bar to find elements by name or identifier
- Apply filters using the right-side filter panel
- Toggle between General and Status map views
- Clear filters using the X button
Element Management
- Click on element names to access detailed configuration
- Use bulk operations for managing multiple elements
- Import/export configurations for backup or migration
Status Monitoring
- Monitor real-time status changes
- View historical status information
- Set up alerts for status changes
Navigation
Access Path
Home → Inventory → Elements
Related Sections
- Settings: Configure element parameters
- Configuration blocks: Manage configuration templates
- Profiles: Define device profiles
- Metrics: View performance data
- Groups: Organize elements into logical groups
- Scripts: Automation and scripting tools
- Locations: Manage device locations
- Credentials: Access and authentication management
- User log: Activity tracking and audit trail
Actions Available
Individual Element Actions
- View Details: Click element name for detailed information
- Edit Configuration: Modify element settings
- Status Management: Monitor and troubleshoot connectivity
Bulk Operations
- Import Elements: Upload multiple element configurations
- Export Data: Download element information and configurations
- Generate Reports: Create status and performance reports
- Add New Elements: Create single or multiple network elements
- Clear Filters: Use X button to reset current filter selections
- Proceed: Execute batch operations on filtered results
Map Operations
- Zoom In/Out: Use + and - controls for map navigation
- Fullscreen View: Expand map for detailed geographical analysis
- Style Changes: Modify map appearance using style selector
- Reset View: Return map to default settings
Filtering Options
- Status Filters: Filter by operational state
- Profile Filters: Filter by device type or profile
- Element Type: Filter by specific element categories
Filter Panel Options
The right-side filter panel provides advanced filtering capabilities:
- FILTER header with close button (X) in the top-right corner
- Proceed Button: Execute filtering operations on selected criteria (highlighted in green, appearing at both the top and bottom)
- Element: Filter by specific elements with "Click for options" dropdown
- Is child: Filter by parent-child relationships with "All" dropdown
- Previous status change: Filter by timing of previous status changes with "Any or no date/time" dropdown
- Records per page: Control number of displayed elements with "25 records" dropdown
- Class: Filter by element class with "Click for options" dropdown
- Active alert: Filter by alert status with "Any or no date/time" dropdown
- Profile: Filter by profile type with "Proceed" button
Notes/Tips
- Performance: The page shows 60 results with pagination controls for optimal viewing
- Real-time Updates: Status indicators provide live monitoring capabilities
- Enhanced Filtering: Multiple time-based filters enable precise element selection based on execution history and status changes
- Visual Feedback: Color-coded status indicators for quick assessment
- Data Export: Use export functionality for reporting and backup purposes
- Interactive Mapping: Geographical visualization helps identify location-based patterns and issues
- Map Customization: Style selector allows adaptation to different viewing preferences
- Quick Reset: Use the X button to quickly clear active filters
- Filter Panel Management: The filter panel can be closed using the X button in the top-right corner to provide more screen space for the main content
- Status Change Tracking: Previous status change filter enables monitoring of device state transitions over time
- Element Relationship Filtering: "Is child" filter enables analysis of hierarchical element structures
- Records Per Page Control: Adjustable page size for optimal viewing and performance
- Class-based Filtering: Element class filter provides categorization options for refined searching
- Alert Management: Active alert filter helps identify elements requiring attention
- Profile-based Organization: Profile filter enables grouping by device or service type
- Flexible Date Filtering: Time-based filters default to "Any or no date/time" for maximum flexibility
- Element Selection: Element filter provides dropdown options for targeting specific devices
No comments to display
No comments to display