Results: Traffic per AP (GBytes)

Overview
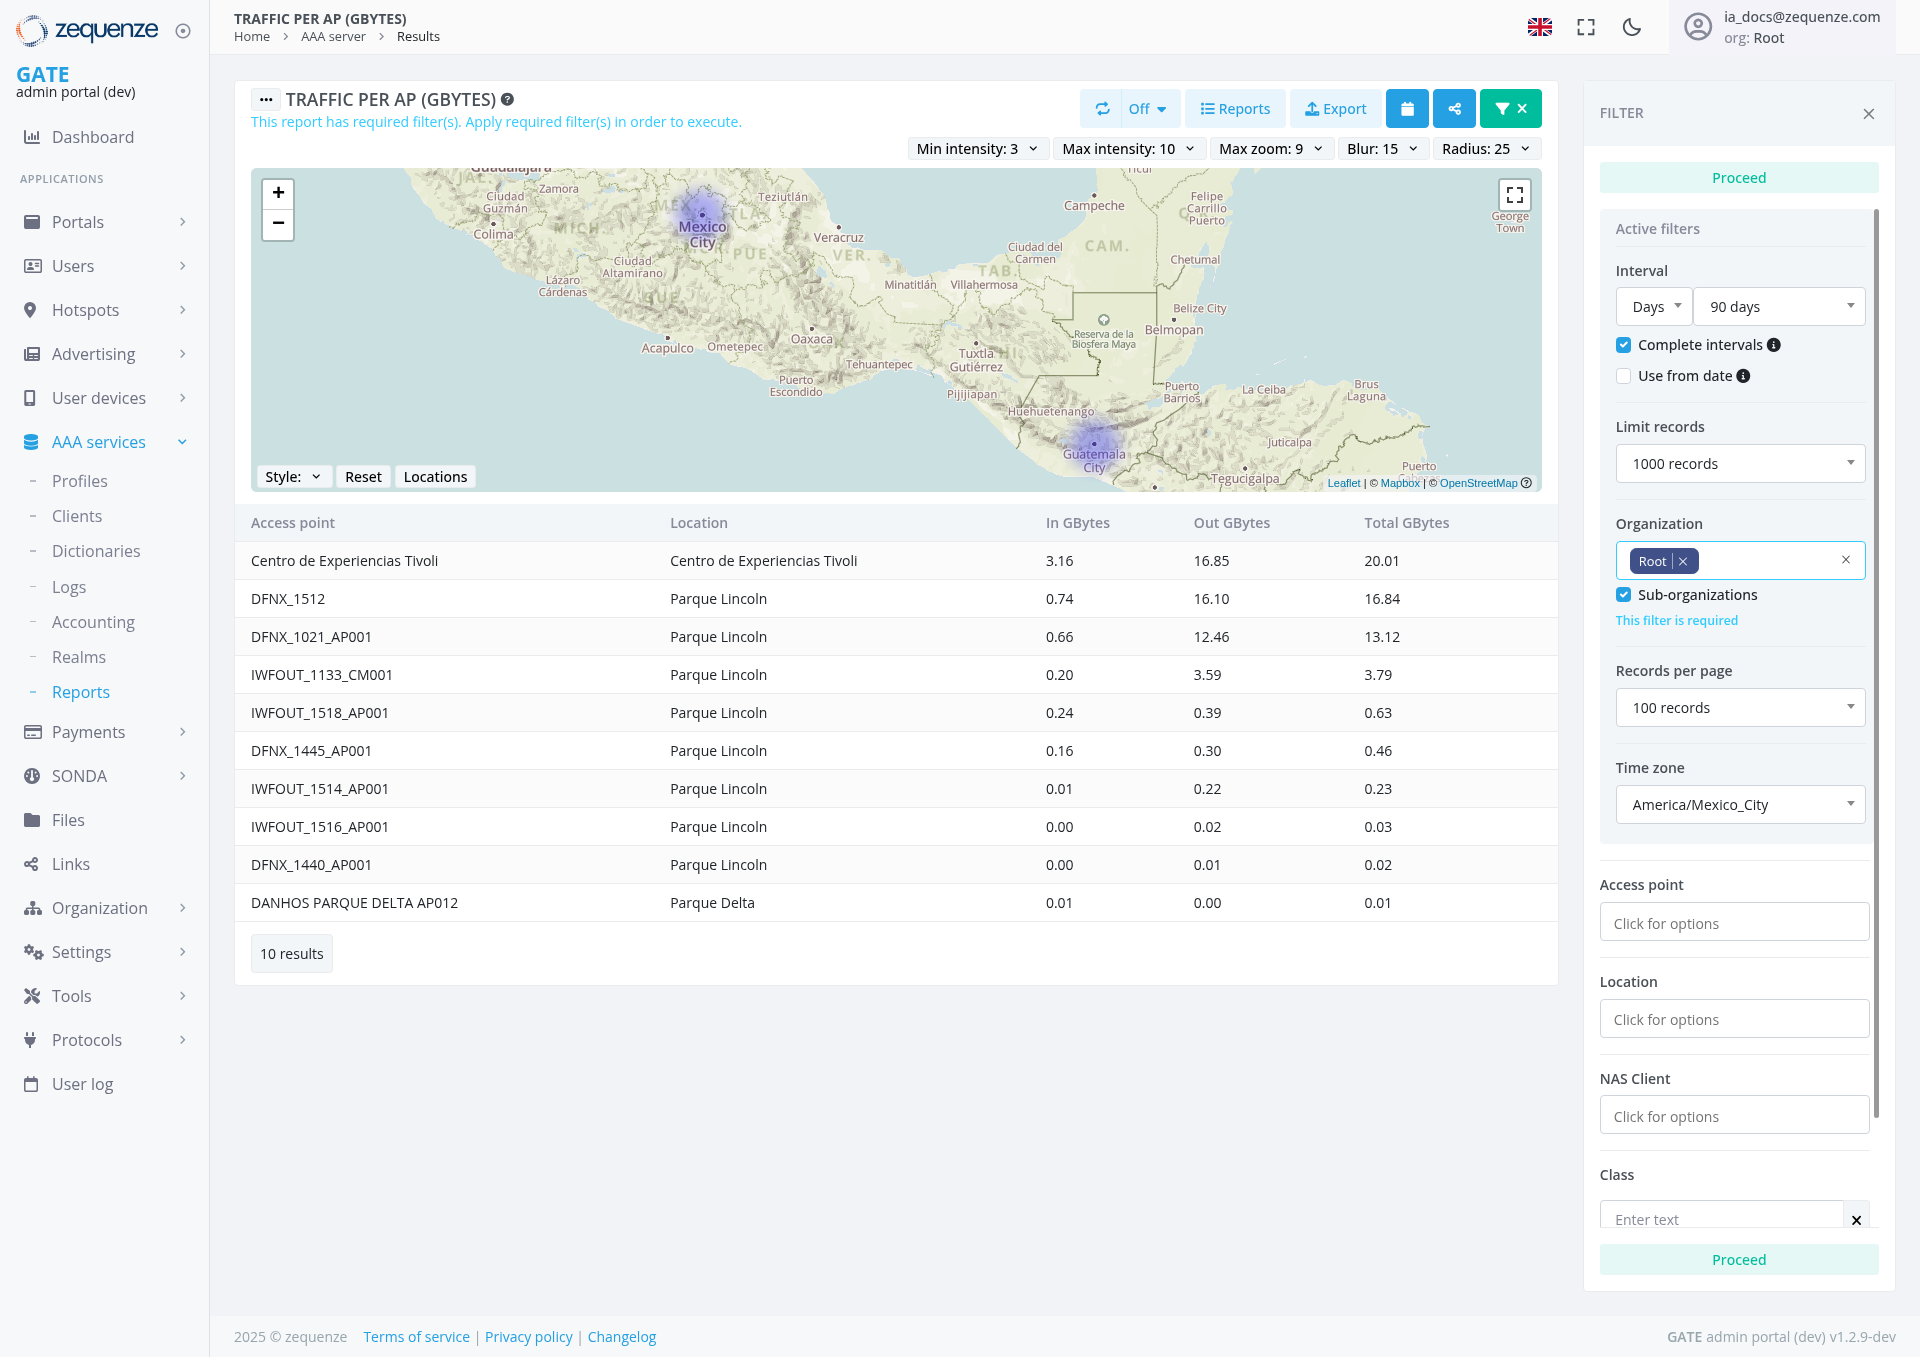
The Traffic per AP (GBytes) report provides a comprehensive view of data traffic usage across Access Points (APs) in your network infrastructure. This report displays both incoming and outgoing traffic data measured in gigabytes, with an interactive map visualization and detailed tabular data for network traffic analysis.
Key Features
- Interactive Map Visualization: Geographic representation of access points with traffic intensity overlays
- Real-time Traffic Monitoring: Displays current traffic data with configurable refresh intervals
- Customizable Time Periods: Filter data by specific date ranges (currently set to 90 days)
- Traffic Analysis: Separate columns for incoming, outgoing, and total traffic measurements
- Export Capabilities: Options to export data and generate reports
- Advanced Filtering: Multiple filter options for detailed data analysis
UI Elements
Map Controls
- Zoom Controls: Plus (+) and minus (-) buttons for map navigation
- Fullscreen Toggle: Expand map to full screen view
- Style Selector: Change map visualization styles
- Reset Button: Return to default map view
- Locations Toggle: Show/hide location markers
Top Control Bar
Filter Panel (Right Side)
Proceed Button: Located at top of filter panel for applying changes Interval Selector: Currently set to "Days" with 90-day period Complete Intervals: Checkbox option for complete data intervals Use from date: Additional date filtering option Limit records: Set to 1000 records maximum Organization Filter: Set to "Root" with sub-organizations enabled Records Per Page: Configurable display limit (100 records shown) Time Zone: Set to America/Mexico_City Access Point Filter: Dropdown for specific AP selection with "Click for options" Location Filter: Geographic location filtering options with "Click for options" NAS Client Filter: Network Access Server client filtering with "Click for options" Class Filter: Text input for classification filtering with Proceed buttonData Table
- Access Point Column: AP names and identifiers
- Location Column: Physical location of each access point
- In GBytes: Incoming traffic data
- Out GBytes: Outgoing traffic data
- Total GBytes: Combined traffic totals
User Interactions
Map Visualization Controls
Filtering Data
Click Proceed button at top of filter panel to apply filter changes Use the Interval dropdown to select time periods (Days, Weeks, Months) Adjust the date range using the period selector (currently 90 days) Toggle Complete intervals checkbox for comprehensive data sets Enable Use from date for specific start date filtering Set Limit records to control maximum data retrieval (1000 records) Select specific organizations or enable sub-organizations Choose records per page limit for table display Use Click for options dropdowns for Access Point, Location, and NAS Client filters Enter text in Class filter and click Proceed to apply classification filteringMap Navigation
- Use zoom controls to focus on specific geographic areas
- Click locations on the map to view detailed AP information
- Toggle between different map styles for better visualization
- Use fullscreen mode for detailed geographic analysis
Data Export
- Click the Export button in the top control bar to download current data set
- Use Reports option to generate formatted reports
- Share functionality available for collaborative analysis
Navigation
Data Displayed
The report shows traffic data for multiple locations:
Primary Locations
- Centro de Experiencias Tívoli: Highest traffic volume (20.01 GB total)
- Parque Lincoln: Multiple access points with varying traffic loads
- Parque Delta: Lower traffic volume access points
Traffic Metrics
- Incoming Traffic: Data received by each access point
- Outgoing Traffic: Data transmitted from each access point
- Total Traffic: Combined incoming and outgoing data
- 10 Results: Currently displaying first 10 access points
Actions Available
Data Management
- Filter Results: Apply various filters to refine data display using the Proceed button
-
Export Data: Download traffic data using the Export button in
varioustopformatscontrol bar -
Generate Reports: Create formatted reports
forusinganalysisthe Reports button - Refresh Data: Update display with latest traffic information
Visualization Options
-
Map Customization: Adjust
intensity,intensityzoom,(3-10),blur,zoom (9), blur (15), and radius (25) settings via top controls - Style Changes: Modify map appearance and data representation
- Time Range Adjustment: Change reporting periods for trend analysis
- Display Controls: Use Off toggle to disable specific visual elements
Notes/Tips
-
Filter
RequirementApplication:TheUsesystemtheindicatesProceed"Thisbutton to apply filterischangesrequired"afterformakingorganizationselections