Results: New accounting sessions
Overview
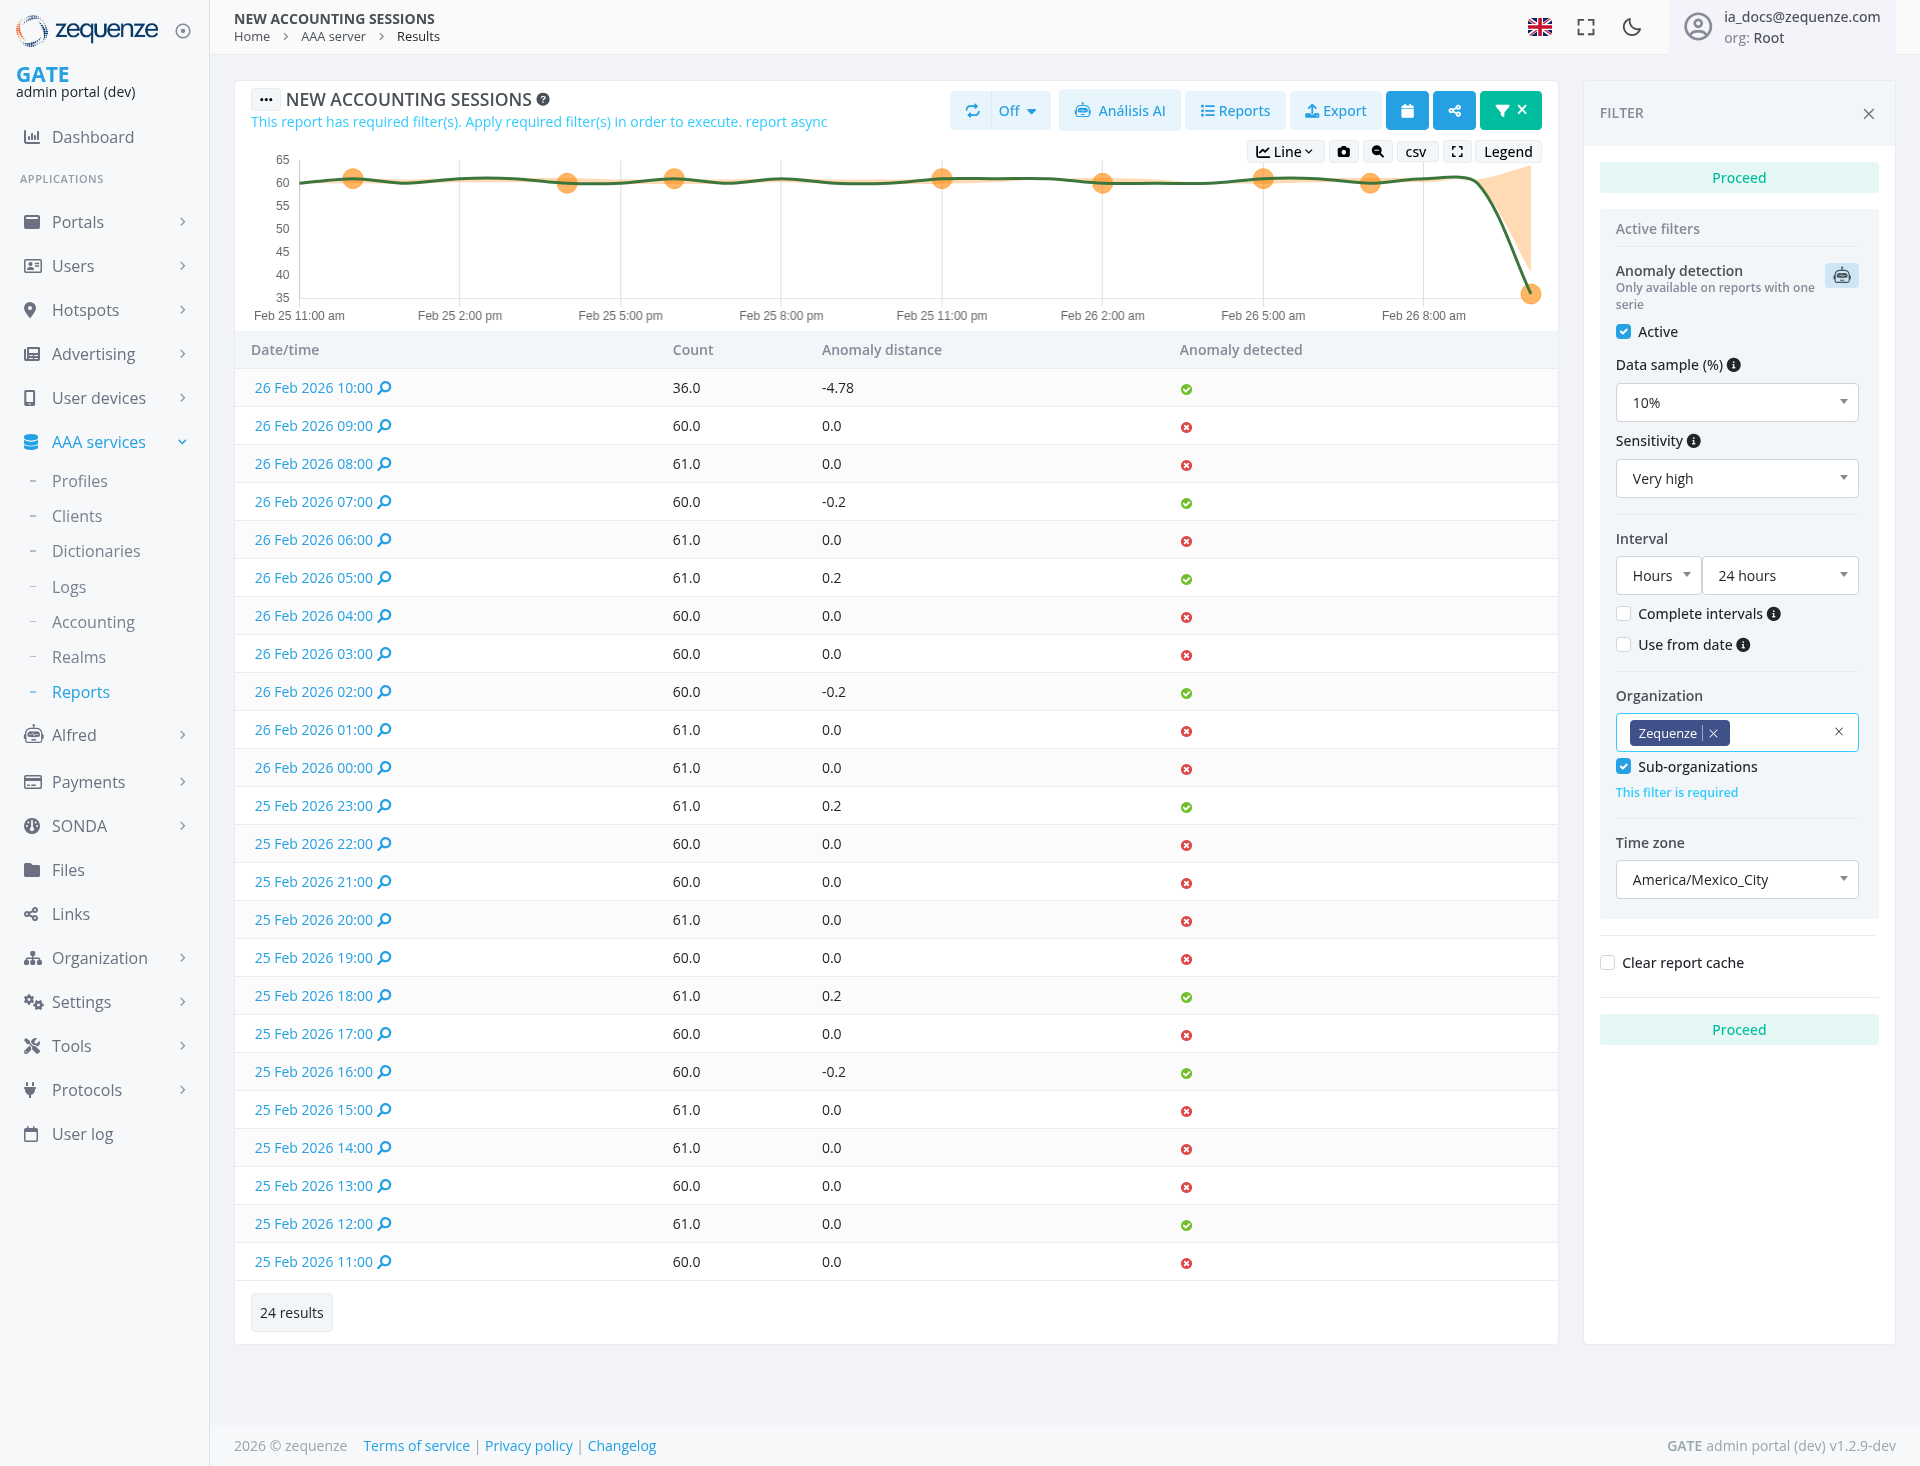
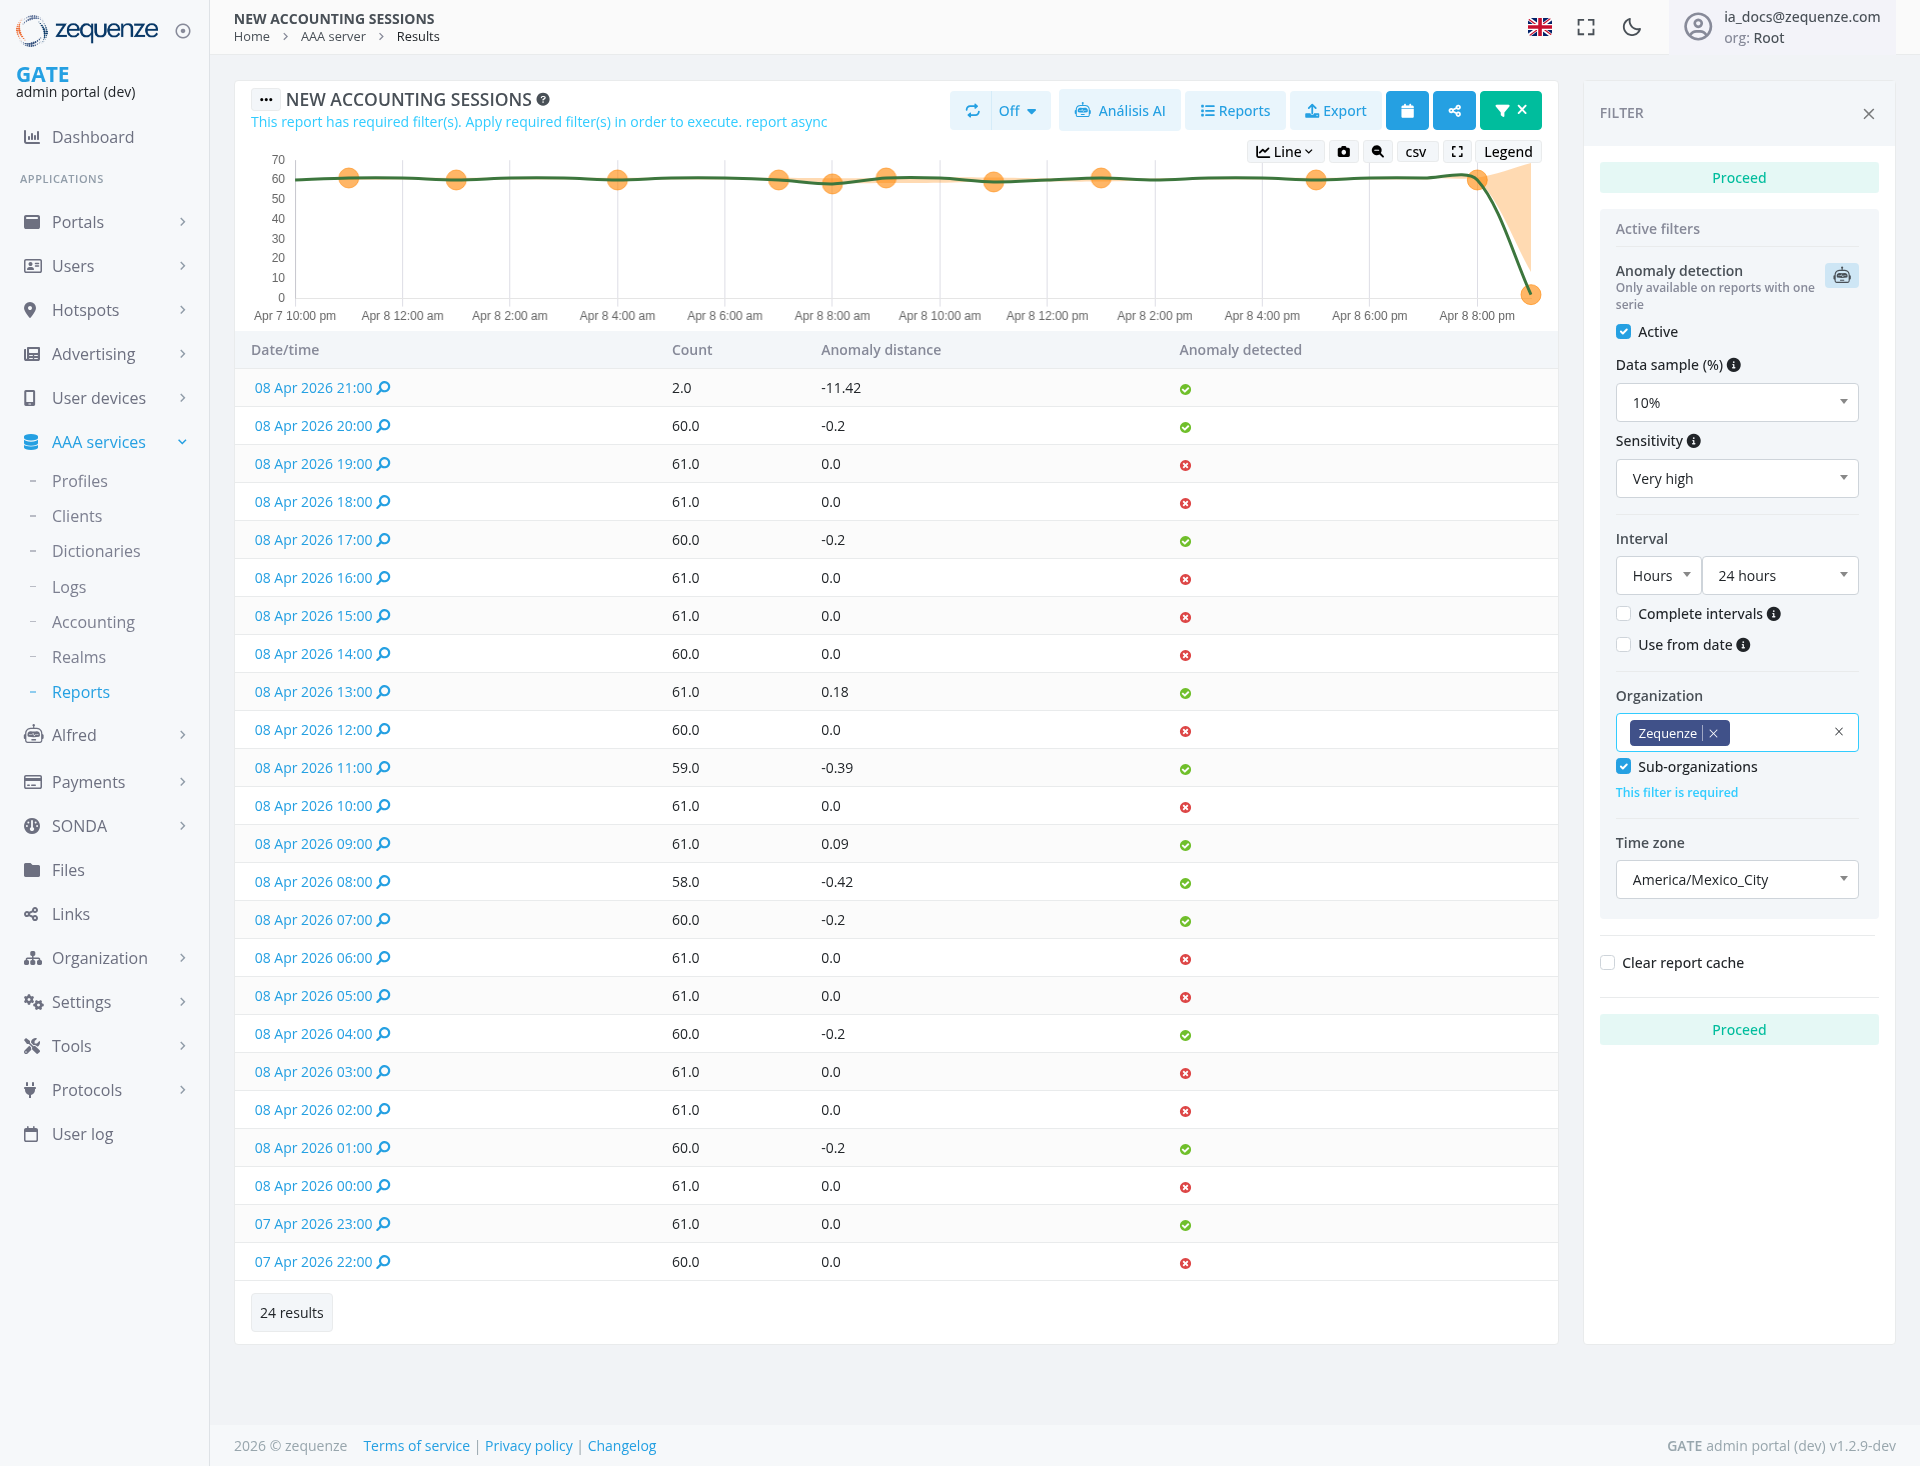
The NEW ACCOUNTING SESSIONS report in the GATE admin portal provides comprehensive monitoring and anomaly detection for AAA (Authentication, Authorization, and Accounting) server sessions. This page displays time-series data with advanced analytics capabilities, allowing administrators to track session counts, identify anomalies, and analyze patterns over time.
Key Features
UI Elements
Top Action Bar
Filter Panel (Right Sidebar)
Anomaly Detection Settings
Time Configuration
Organization Filters
Time Zone
Report Cache Management
Main Chart Area
The line graph displays:
FebApr25711:10:00ampm throughFebApr268 8:00am)pm)65)70)
Data Table
Columns include:
36.2.0 to 61.0)4.7811.42 to 0.2)18)
User Interactions
Viewing Session Data
- The chart automatically displays session trends based on active filters
- Hover over data points on the line graph to see detailed values
- Click on timestamps in the table to view session details
- Scroll through the table to review all 24 results
Applying Filters
- Click the FILTER button in the top-right to open the filter panel
- Adjust anomaly detection parameters:
- Toggle "Active" to enable/disable detection
- Modify "Data sample (%)" for analysis depth
- Change "Sensitivity" level (Very high, High, Medium, Low)
- Set time interval preferences (hours, days, weeks, months)
- Select organization and include/exclude sub-organizations
- Choose appropriate timezone for data display
- Use Clear report cache to refresh cached data when needed
- Click Proceed to apply changes
Analyzing Anomalies
- Review rows marked with red dots in the "Anomaly detected" column
- Check "Anomaly distance" values - higher absolute numbers indicate greater deviation
- Orange data points on the chart mark time intervals for analysis
- The chart shows a significant dramatic drop at the end of the monitoring period
Exporting Data
- Click the Export button in the top toolbar
- Choose between:
- Click Legend to include/exclude legend in exports
Navigation
Accessing This Page
From the left sidebar:
Breadcrumb Navigation
Located at the top: Home > AAA server > Results
Related Sections
Data Displayed
Session Metrics
Anomaly Indicators
Current Data Set
The report shows 24 results spanning from 2608 FebApr 2026 10:21:00 to 2608 FebApr 2026 11:22:00, with:
- Session counts ranging from
36.2.0 to 61.0 - One
significantmajor anomaly at10:21:00 with -4.7811.42 distance and36.2.0 count - Multiple sessions showing normal activity with 0.0 anomaly distance
Actions Available
Primary Actions
Data Management
Drill-down Capabilities
- Click on any timestamp link (blue link with arrow icon) to view detailed session information
- Access individual session records for troubleshooting and analysis
Notes/Tips
Best Practices
Interpreting Anomalies
Performance Considerations
- Enable "Sub-organizations" only when cross-organizational analysis is required
- Use appropriate time intervals to balance detail vs. system performance
- Export to CSV for complex analysis in external tools like Excel or data analysis platforms
- Clear report cache periodically for optimal performance
Troubleshooting
- If no anomalies appear but issues are suspected, lower the sensitivity setting
- Verify timezone settings match your operational requirements
- Check that the "Active" checkbox is enabled for anomaly detection to function
- Ensure "Zequenze" organization filter is correctly applied for relevant data
- Use "Clear report cache" if data appears stale or inconsistent
URL Parameters
The page URL contains several parameters that define the current view:
visualization_type=line: Display modeorganization__in=2: Organization ID filtersuborgs=1: Sub-organizations includedinterval=24h: 24-hour time intervalsanomaly=1: Anomaly detection enabledwindow=10: Detection window sizesigma=1: Statistical sensitivity parameter