Metric logs
Overview
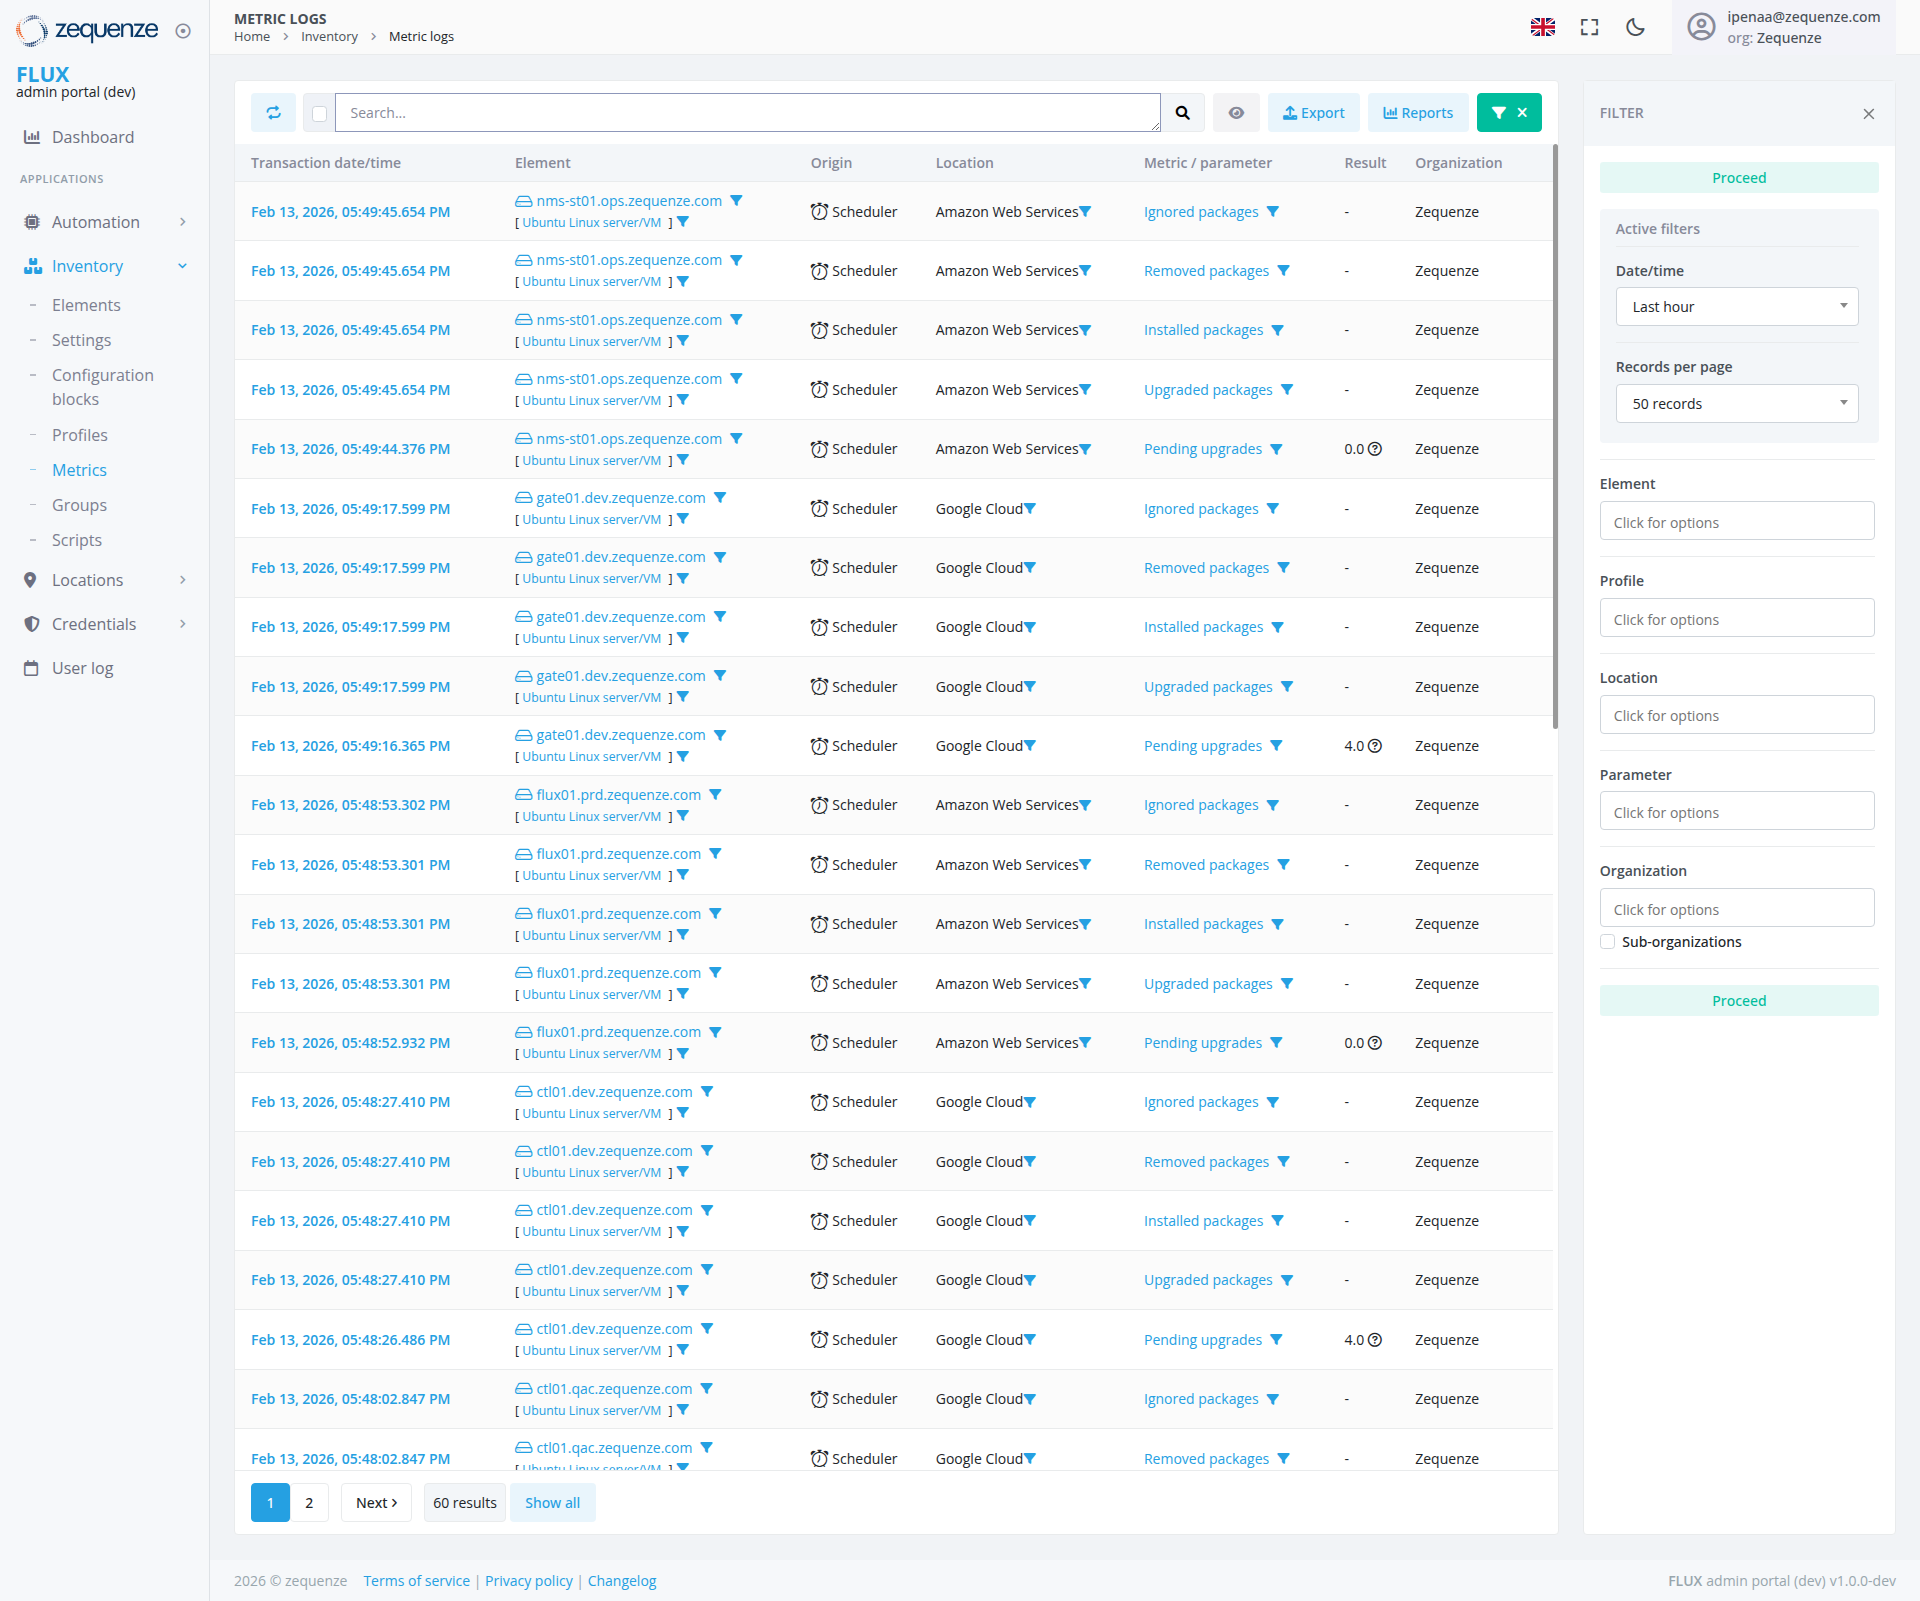
The Metric Logs page in the Zequenze FLUX Admin Portal provides a comprehensive view of all metric data collected from various devices and sensors in your fleet. This centralized logging system displays real-time and historical metric information, allowing administrators to monitor system performance, track data collection activities, and troubleshoot connectivity issues across their IoT infrastructure.
Key Features
packagenetworkmanagementtrafficoperationsmetrics (ignored,Rxremoved,Bytes,installed,Txupgraded,Bytes,pendingRxupgrades)Error Bytes, Tx Error Bytes)
UI Elements
Main Data Table
The central table displays metric logs with the following columns:
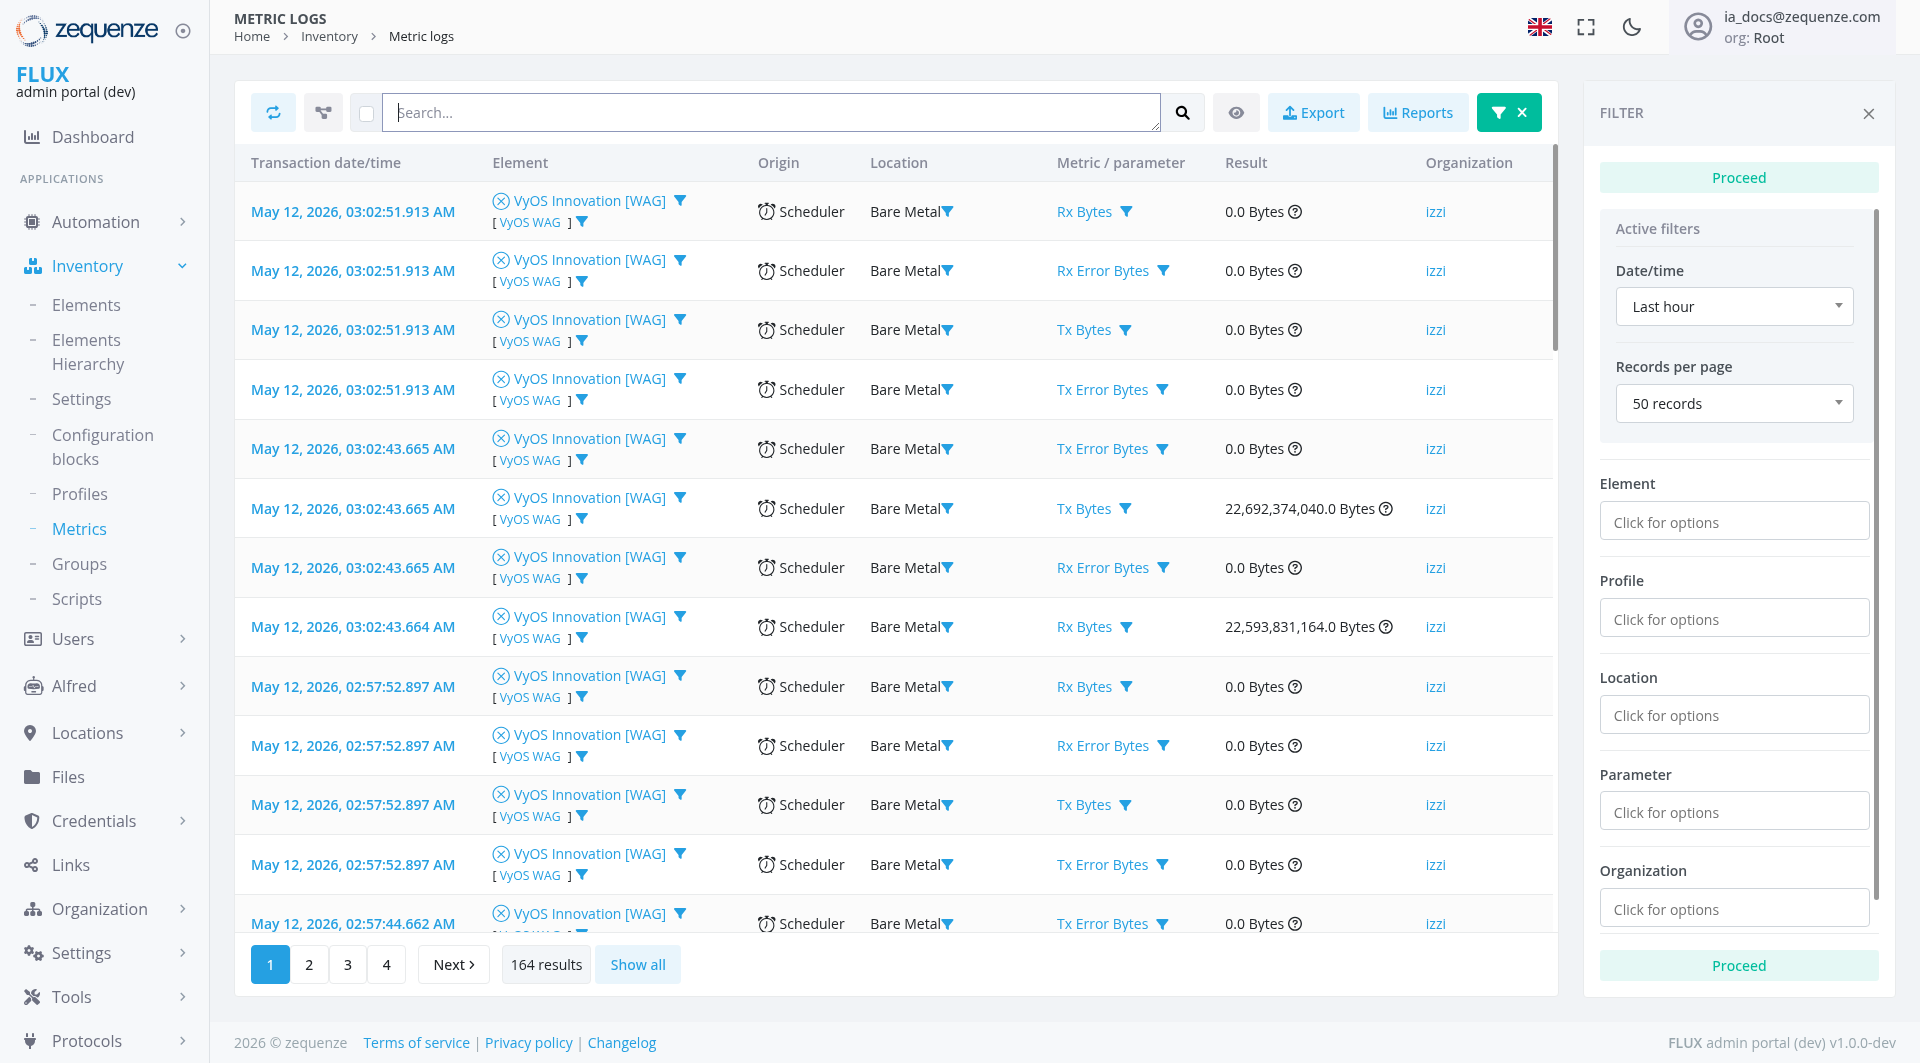
FebMay13,12, 2026 format with precise timestamps)variousVyOSserversInnovationincluding[WAG]nms-st01.ops.zequenze.com, gate01.dev.zequenze.com, flux01.prd.zequenze.com, ctt01.qat.zequenze.com, and ctt01.dev.zequenze.comdevices withUbuntuVyOSLinuxWAGserver/VM configurations)configuration)AmazonBareWeb Services, Google Cloud)Metal)IgnoredRxpackages,Bytes,RemovedTxpackages,Bytes,InstalledRxpackages,ErrorUpgradedBytes,packages,TxPendingErrorupgrades)Bytes)0,04.0)Bytes, 22,692,374,040.0 Bytes, 22,593,831,164.0 Bytes) with informationicons, or dashes for non-numerical resultsiconsZequenze)Izzi)
Filter Panel (Right Sidebar)
The filter panel is positioned on the right side with the following elements:
with "Sub-organizations" checkbox option
Top Navigation Bar
User Interactions
Viewing Metrics
- Users can scroll through the paginated list of metric entries
- Click on column headers to sort data by specific criteria
- Use the pagination controls at the bottom (1, 2, 3, 4, Next, showing "
60164 results" with "Show all" option) to navigate through results - Click the refresh button to reload the latest metric data
Filtering Data
- Access the filter panel by clicking the green filter button on the right side
- Select specific time ranges using the Date/Time dropdown
- Choose specific elements, profiles, locations, or parameters from their respective dropdowns
Data Export
- Click the blue "Export" button to download filtered metric data
- Select from available export formats for external analysis
Navigation
Accessing the Page
Related Pages
Data Displayed
Metric Types
The system tracks packagenetwork managementtraffic operationsmetrics across devices:
- Rx
Ignored packagesBytes:PackagesBytesthatreceivedarebyexcludednetworkfrom management operationsinterfaces - Tx
Removed packagesBytes:PackagesBytesthattransmittedhavebybeennetworkuninstalled from systemsinterfaces - Rx
InstalledErrorpackagesBytes:PackagesErrorthatbyteshaveencounteredbeenduringnewly installedreception - Tx
UpgradedErrorpackagesBytes:PackagesErrorthatbyteshaveencounteredbeenduringupdated to newer versions
Device Integration
The system tracks metrics from various infrastructure elements including:
- VyOS
nms-st01.ops.zequenze.comInnovation [WAG]:UbuntuVyOSLinuxWAGserver/VMnetwork devices deployed onAmazonBareWebMetalServices
Data Values
The system tracks metrics with:
0,04.Bytes, 22,692,374,040.0 Bytes displayed with information icons providing additional context- Network
Non-numericalTrafficResults: Represented by dashes (-) for operations without quantifiable values
Temporal Data
- All entries are timestamped with precise date and time information
- Data spans multiple time periods for historical analysis
- Recent entries from
FebruaryMay13,12, 2026 are displayed with timestamps rangingfromacross05:48differenttotime05:49 PMperiods
Actions Available
Primary Actions
60164 results
Administrative Actions
PackageNetworkOperationsTraffic: Monitorpackagenetworkmanagementtransmission and reception activities across the infrastructureMulti-cloudError Monitoring: Trackoperationsnetworkacross Amazon Web Serviceserrors andGoogletransmissionCloud deploymentsissuesand sub-organizations
Notes/Tips
Performance Optimization
- Use specific filters to reduce large dataset load times
- Consider exporting data for complex analysis rather than processing in-browser
- The default "Last hour" filter helps focus on recent activity
- Use the refresh button to ensure you're viewing the most current data
Data Interpretation
packagesnetworkmatched the operation criteriatraffic during the measurement period or inactive interfaces- Large
DashByte(-) ResultsValues:IndicateHighoperationstransmissionthatvaluesdon't(e.g.,produce22+numericalbillionresultsbytes)butindicateweresignificantsuccessfullynetworkexecutedactivity - Error
Pending UpgradesBytes: Non-zero error values may indicatepackagesnetworkawaitingissuesupdates that may requirerequiring attention
Best Practices
- Regularly monitor
packagenetworkmanagementtraffic metrics to maintain systemsecurityperformance andstabilityidentify bottlenecks - Use the organization filter when managing multi-tenant environments
- Export historical data periodically for long-term trend analysis and
compliancenetworkreportingcapacity planning - Monitor both
installedtransmitted andupgradedreceivedpackagesbytes totrackunderstandsystembidirectionalchangestraffic patterns - Track
pendingerrorupgradesbytes to identify and resolve network issues promptly