Metric logs
Overview
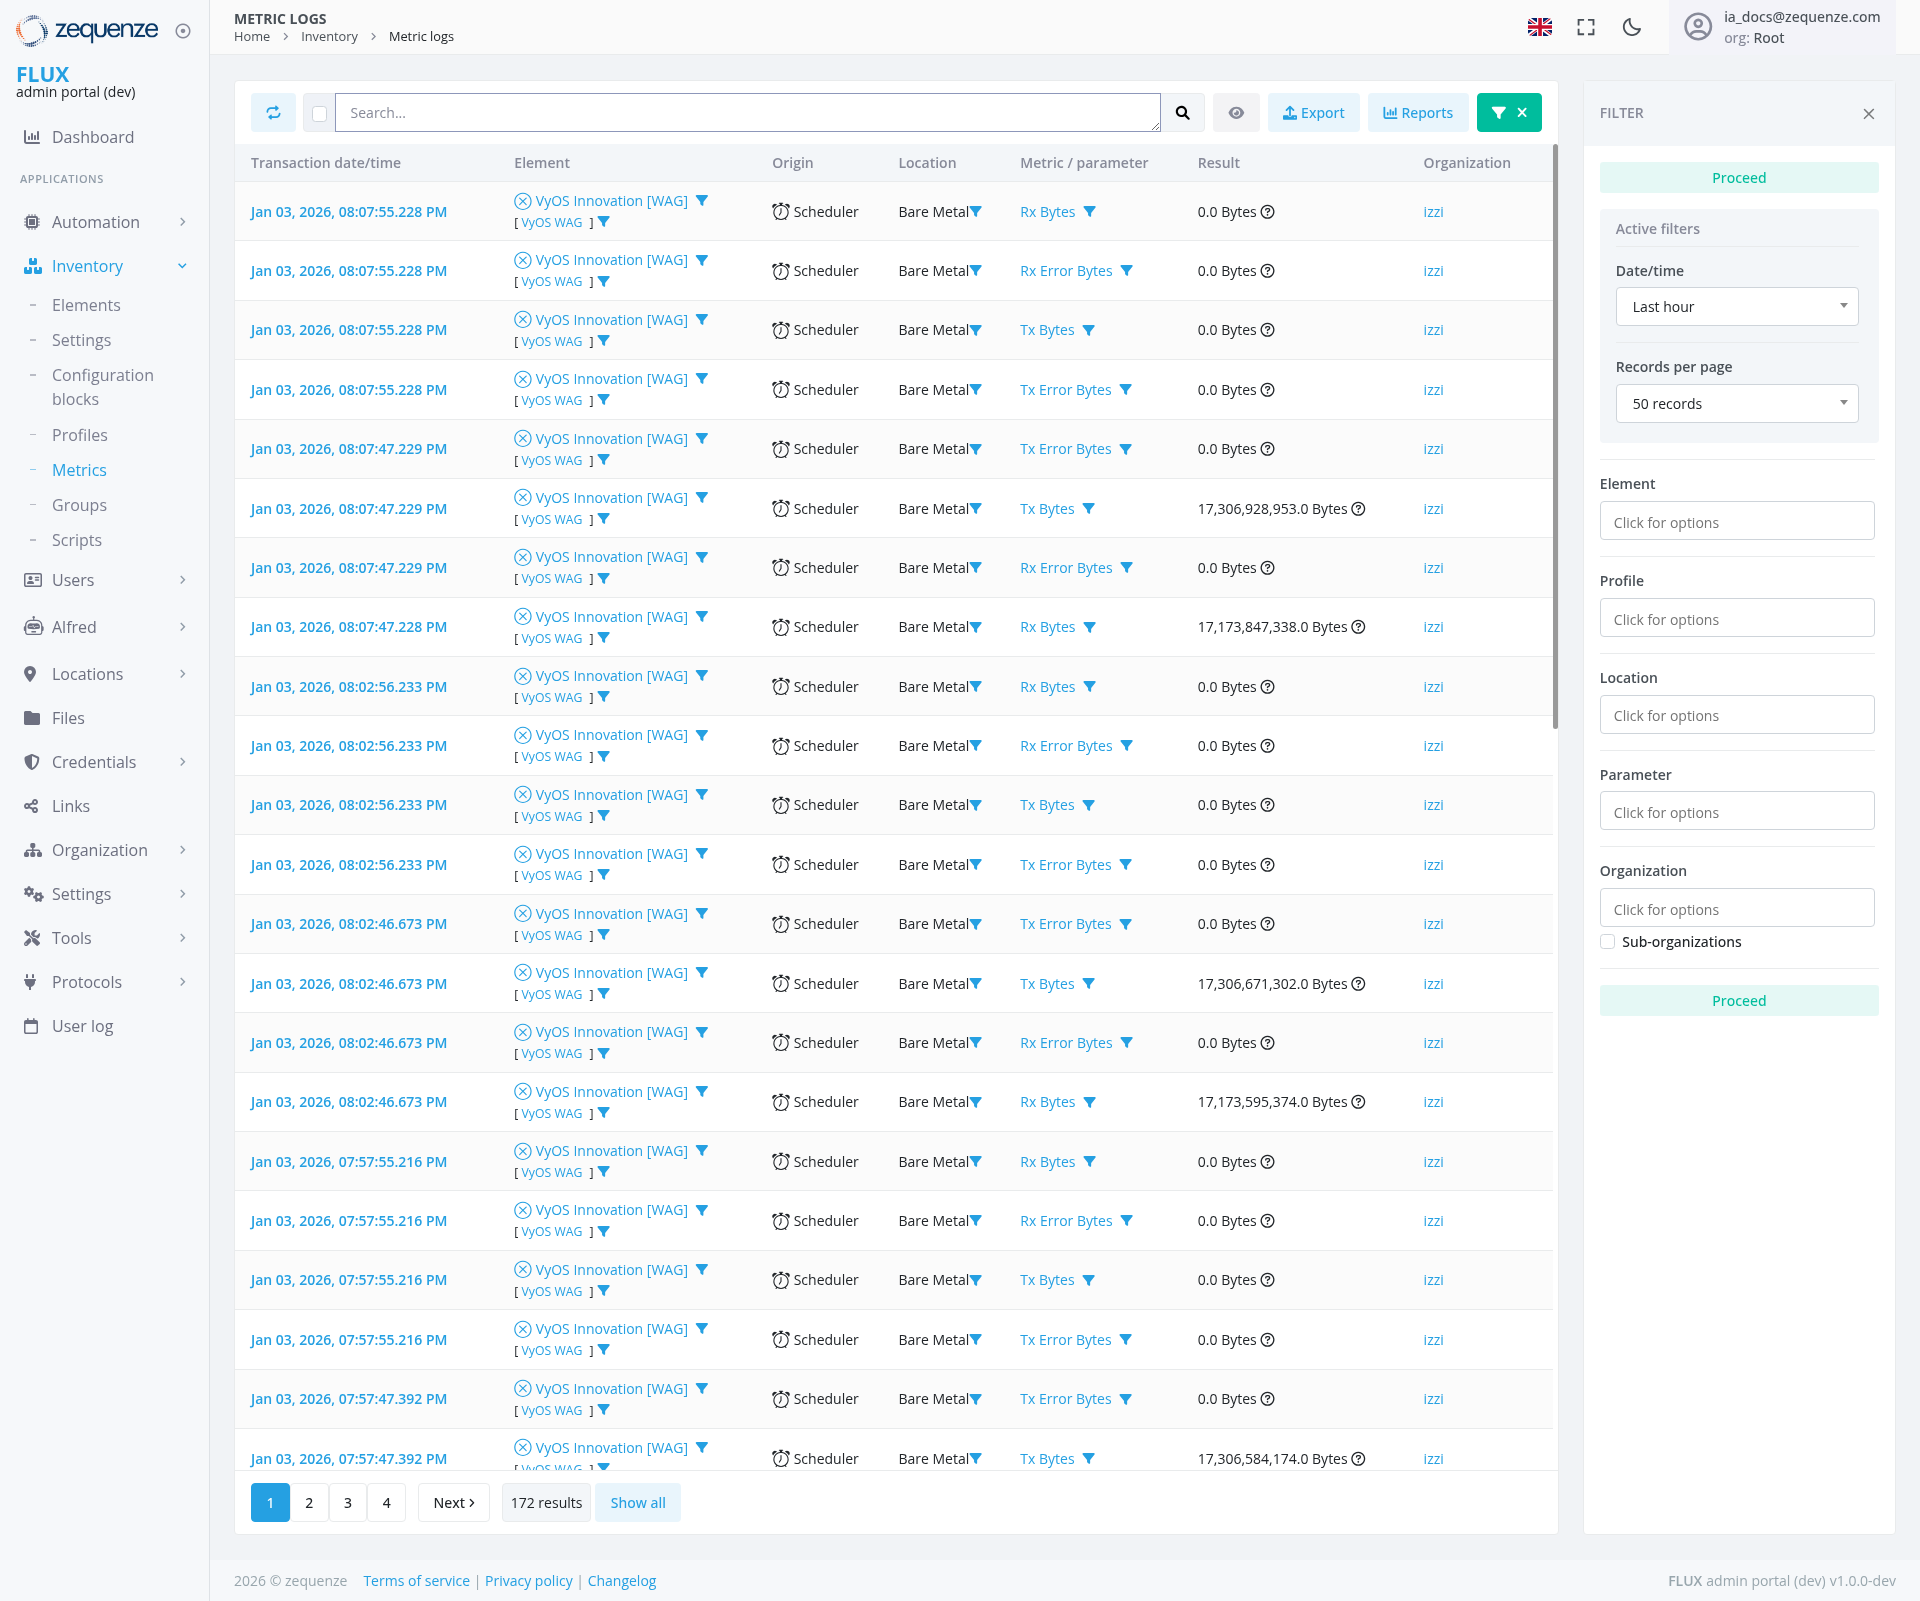
The Metric Logs page in the Zequenze ControlCONTROL Portal provides a comprehensive view of all metric data collected from various devices and sensors in your fleet. This centralized logging system displays real-time and historical metric information, allowing administrators to monitor system performance, track data collection activities, and troubleshoot connectivity issues across their IoT infrastructure.
Key Features
- Real-time Metric Monitoring: View live data streams from connected devices and sensors
- Historical Data Access: Browse through timestamped metric logs with detailed filtering options
-
Multi-parameter Tracking: Monitor various data types including
networkpackagemetrics,managementupgradeoperationsoperations,(ignored,andremoved,datainstalled,transferupgraded,measurementspending upgrades) -
Advanced Filtering: Filter logs by date/time, element, location, profile, parameter, and
other parametersorganization - Data Export Capabilities: Export metric data for external analysis and reporting
- Pagination Support: Navigate through large datasets efficiently with pagination controls
UI Elements
Main Data Table
The central table displays metric logs with the following columns:
-
Transaction date/time: Timestamp of when the metric was recorded (
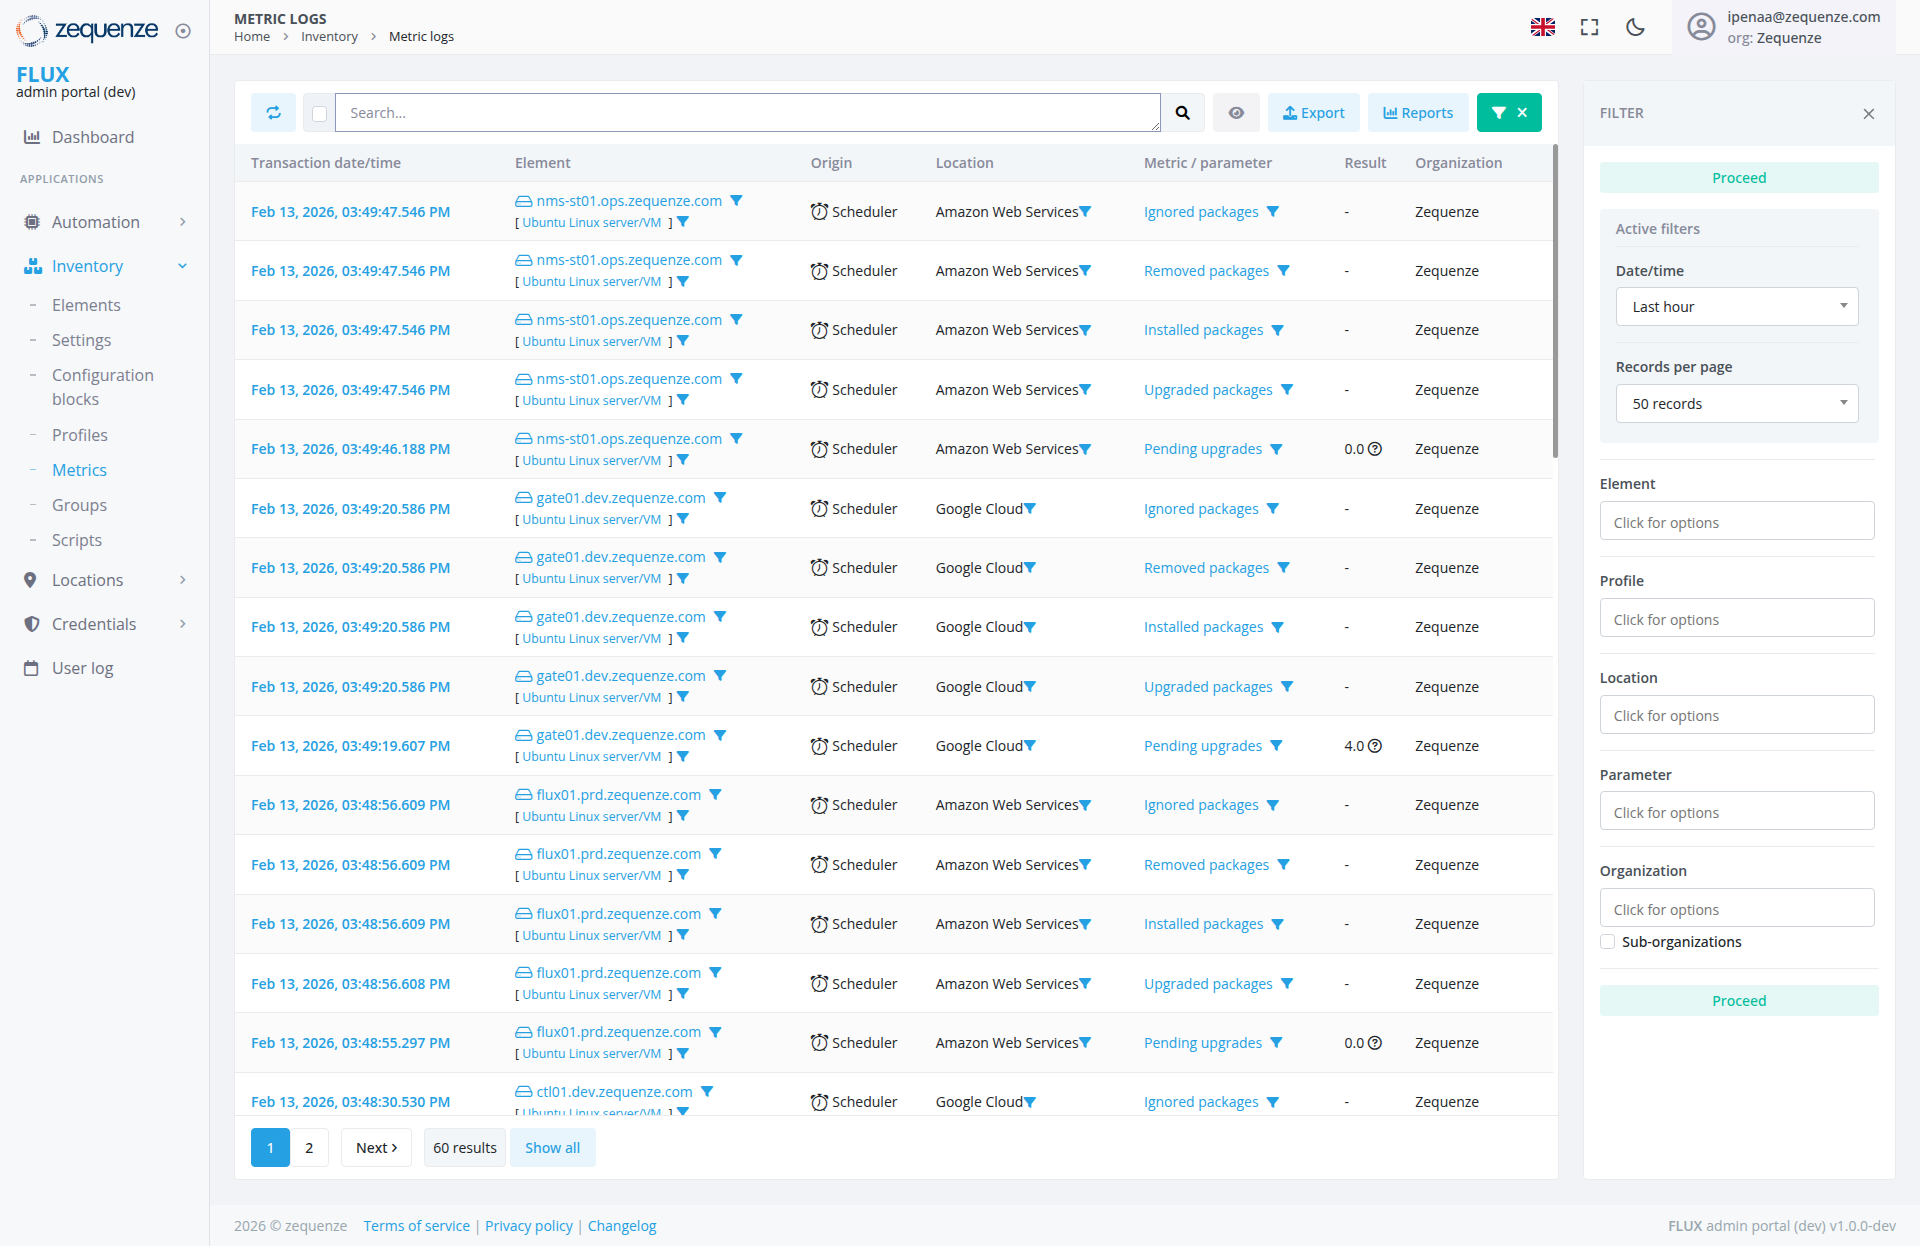
JanFeb03,13, 2026format)format with precise timestamps) -
Element: Device or sensor identifier (shows
VyOSvariousInnovationservers[WAG]includingelementsnms-st01.ops.zequenze.com, gate01.dev.zequenze.com, flux01.prd.zequenze.com, and ctt01.dev.zequenze.com withVyOSUbuntuWAGLinux server/VM configurations) - Origin: Source of the data collection (Scheduler)
-
Location: Physical or logical location of the device (
BareAmazonMetal)Web Services, Google Cloud) -
Metric/Parameter: Type of
dataoperation beingmeasuredtracked (includesIgnoredRxpackages,Bytes,RemovedTxpackages,Bytes,InstalledRxpackages,ErrorUpgradedBytes,packages,andPendingTx Error Bytes)upgrades) -
Result: Actual metric values showing
bytenumericalmeasurementsresultsincluding(0.0,0.04.0)Byteswithandinformationlargericons,valuesorlikedashes17,306,998,953.0forBytesnon-numerical results -
Organization: Associated organization (
zzi)Zequenze)
Filter Panel (Right Sidebar)
The filter panel is positioned on the right side with the following elements:
- Active Filters: Shows currently applied filters with "Proceed" status indicator at the top
- Date/Time Filter: "Last hour" dropdown selection
- Records Per Page: Set to "50 records" with dropdown options
- Element Filter: "Click for options" dropdown
- Profile Filter: "Click for options" dropdown
- Location Filter: "Click for options" dropdown
- Parameter Filter: "Click for options" dropdown
- Organization Filter: "Click for options" dropdown with "Sub-organizations" checkbox option
-
Sub-organizationsProceed Button:Additional organizational filtering withGreen "Proceed"status indicatorbutton at the bottom to apply selected filters
Top Navigation Bar
Refresh Button: Circular refresh icon on the left side to reload metric data Search Field: Global search functionality across metric logs with magnifying glass search icon View Toggle: Eye icon for view options Export Button: Blue export button for downloading filtered data to external formats Reports Button: Blue reports button for generating custom reports from metric data Filter Toggle:User Interactions
Viewing Metrics
- Users can scroll through the paginated list of metric entries
- Click on column headers to sort data by specific criteria
- Use the pagination controls at the bottom (1, 2,
3,Next,4,showing..."60Next)results" with "Show all" option) to navigate through results
Filtering Data
- Access the filter panel by clicking the teal filter button on the right side
of the screen - Select specific time ranges using the Date/Time dropdown
- Choose specific elements, profiles, locations, or parameters from their respective dropdowns
- Toggle "Sub-organizations" checkbox to include or exclude sub-organization data
Data Export
- Click the blue "Export" button to download filtered metric data
- Select from available export formats for external analysis
Navigation
Accessing the Page
Related Pages
- Dashboard: Return to main overview
- Inventory: Access other inventory management features
- Elements: Manage individual device configurations
- Settings: Configure metric collection parameters
- Configuration blocks: Configure metric collection rules
Data Displayed
Metric Types
The system tracks package management operations across devices:
-
RxIgnoredBytespackages:ReceivedPackagesdatathatvolumearemeasurementsexcluded from management operations -
TxRemovedBytespackages:TransmittedPackagesdatathatvolumehavemeasurementsbeen uninstalled from systems -
RxInstalledError Bytespackages:ReceivedPackageserrorthatbyteshavetrackingbeen newly installed -
TxUpgradedError Bytespackages:TransmittedPackageserrorthatbyteshavetrackingbeen updated to newer versions
Device Integration
The system tracks metrics from various infrastructure elements including:
VyOSInnovationnms-st01.ops.zequenze.com:[WAG]UbuntudevicesLinuxwithserver/VMVyOSonWAGAmazonconfigurationsWeb ServicesBareMetalgate01.dev.zequenze.com:infrastructureUbuntudeploymentsLinux server/VM on Google Cloud
Data VolumesValues
The system tracks datametrics ranging from:with:
-
0.0NumericalBytesResults:MinimalValuesorlikeno0.0,data4.0transferdisplayed with information icons providing additional context -
LargeNon-numericalbyte measurementsResults:IncludingRepresentedentriesbylikedashes17,306,998,953.0(-)Bytes,for17,173,847,336.0operationsBytes,without17,306,671,302.0quantifiableBytesvalues -
ErrorPackagetrackingCounts:MonitoringTrackingerrorthebytesnumberacrossoftransmissionpackagestypesaffected by various operations
Temporal Data
- All entries are timestamped with precise date and time information
- Data spans multiple time periods for historical analysis
- Recent entries from
JanuaryFebruary3,13, 2026 are displayed withtimestimestamps ranging from07:5503:48 to08:0703:49 PM
Actions Available
Primary Actions
Administrative Actions
- Monitor Real-time Data: View live metric updates as they occur
- Analyze Trends: Compare historical data across different time periods
-
TroubleshootTrackIssuesPackage Operations:IdentifyMonitoranomaliespackageormanagementerrorsactivitiesinacrossdatathetransmissioninfrastructure -
TrackMulti-cloudNetwork PerformanceMonitoring:MonitorTrackbyteoperationstransferacross Amazon Web Services anderrorGoogleratesCloudacrossdeployments
Notes/Tips
Performance Optimization
- Use specific filters to reduce large dataset load times
- Consider exporting data for complex analysis rather than processing in-browser
- The default "Last hour" filter helps focus on recent activity
- Use the refresh button to ensure you're viewing the most current data
Data Interpretation
-
0.0 Results: May indicate
device connectivity issues, scheduled downtime, ornodatapackagestransfermatchedactivitythe operation criteria during the measurement period -
LargeDashData(-)VolumesResults:HighIndicatebyteoperationscountsthatmaydon'tsuggestproduceheavynumericalusageresultsorbutpotentialweredatasuccessfullyanomaliesexecuted -
ErrorInformationBytesIcons: Hover over or click the information icons next to numerical results for additional context
Best Practices
- Regularly monitor
bytepackagetransfermanagement metrics to maintainoptimalsystemnetworksecurityperformanceand stability - Use the organization filter when managing multi-tenant environments
- Export historical data periodically for long-term trend analysis and compliance reporting
- Monitor both
Rxinstalled andTxupgradedmetricspackages tounderstandtrackbidirectionalsystemdata flowchanges - Track
errorpendingbytesupgrades toidentifyensureandtimelyresolvesecuritynetwork transmission issuesupdates - Monitor
VyOSoperationsInnovationacross[WAG]bothdeviceAmazonperformanceWebforServicesVyOSandWAGGoogleconfigurationsCloud to maintain multi-cloud visibility