Metric logs
Overview
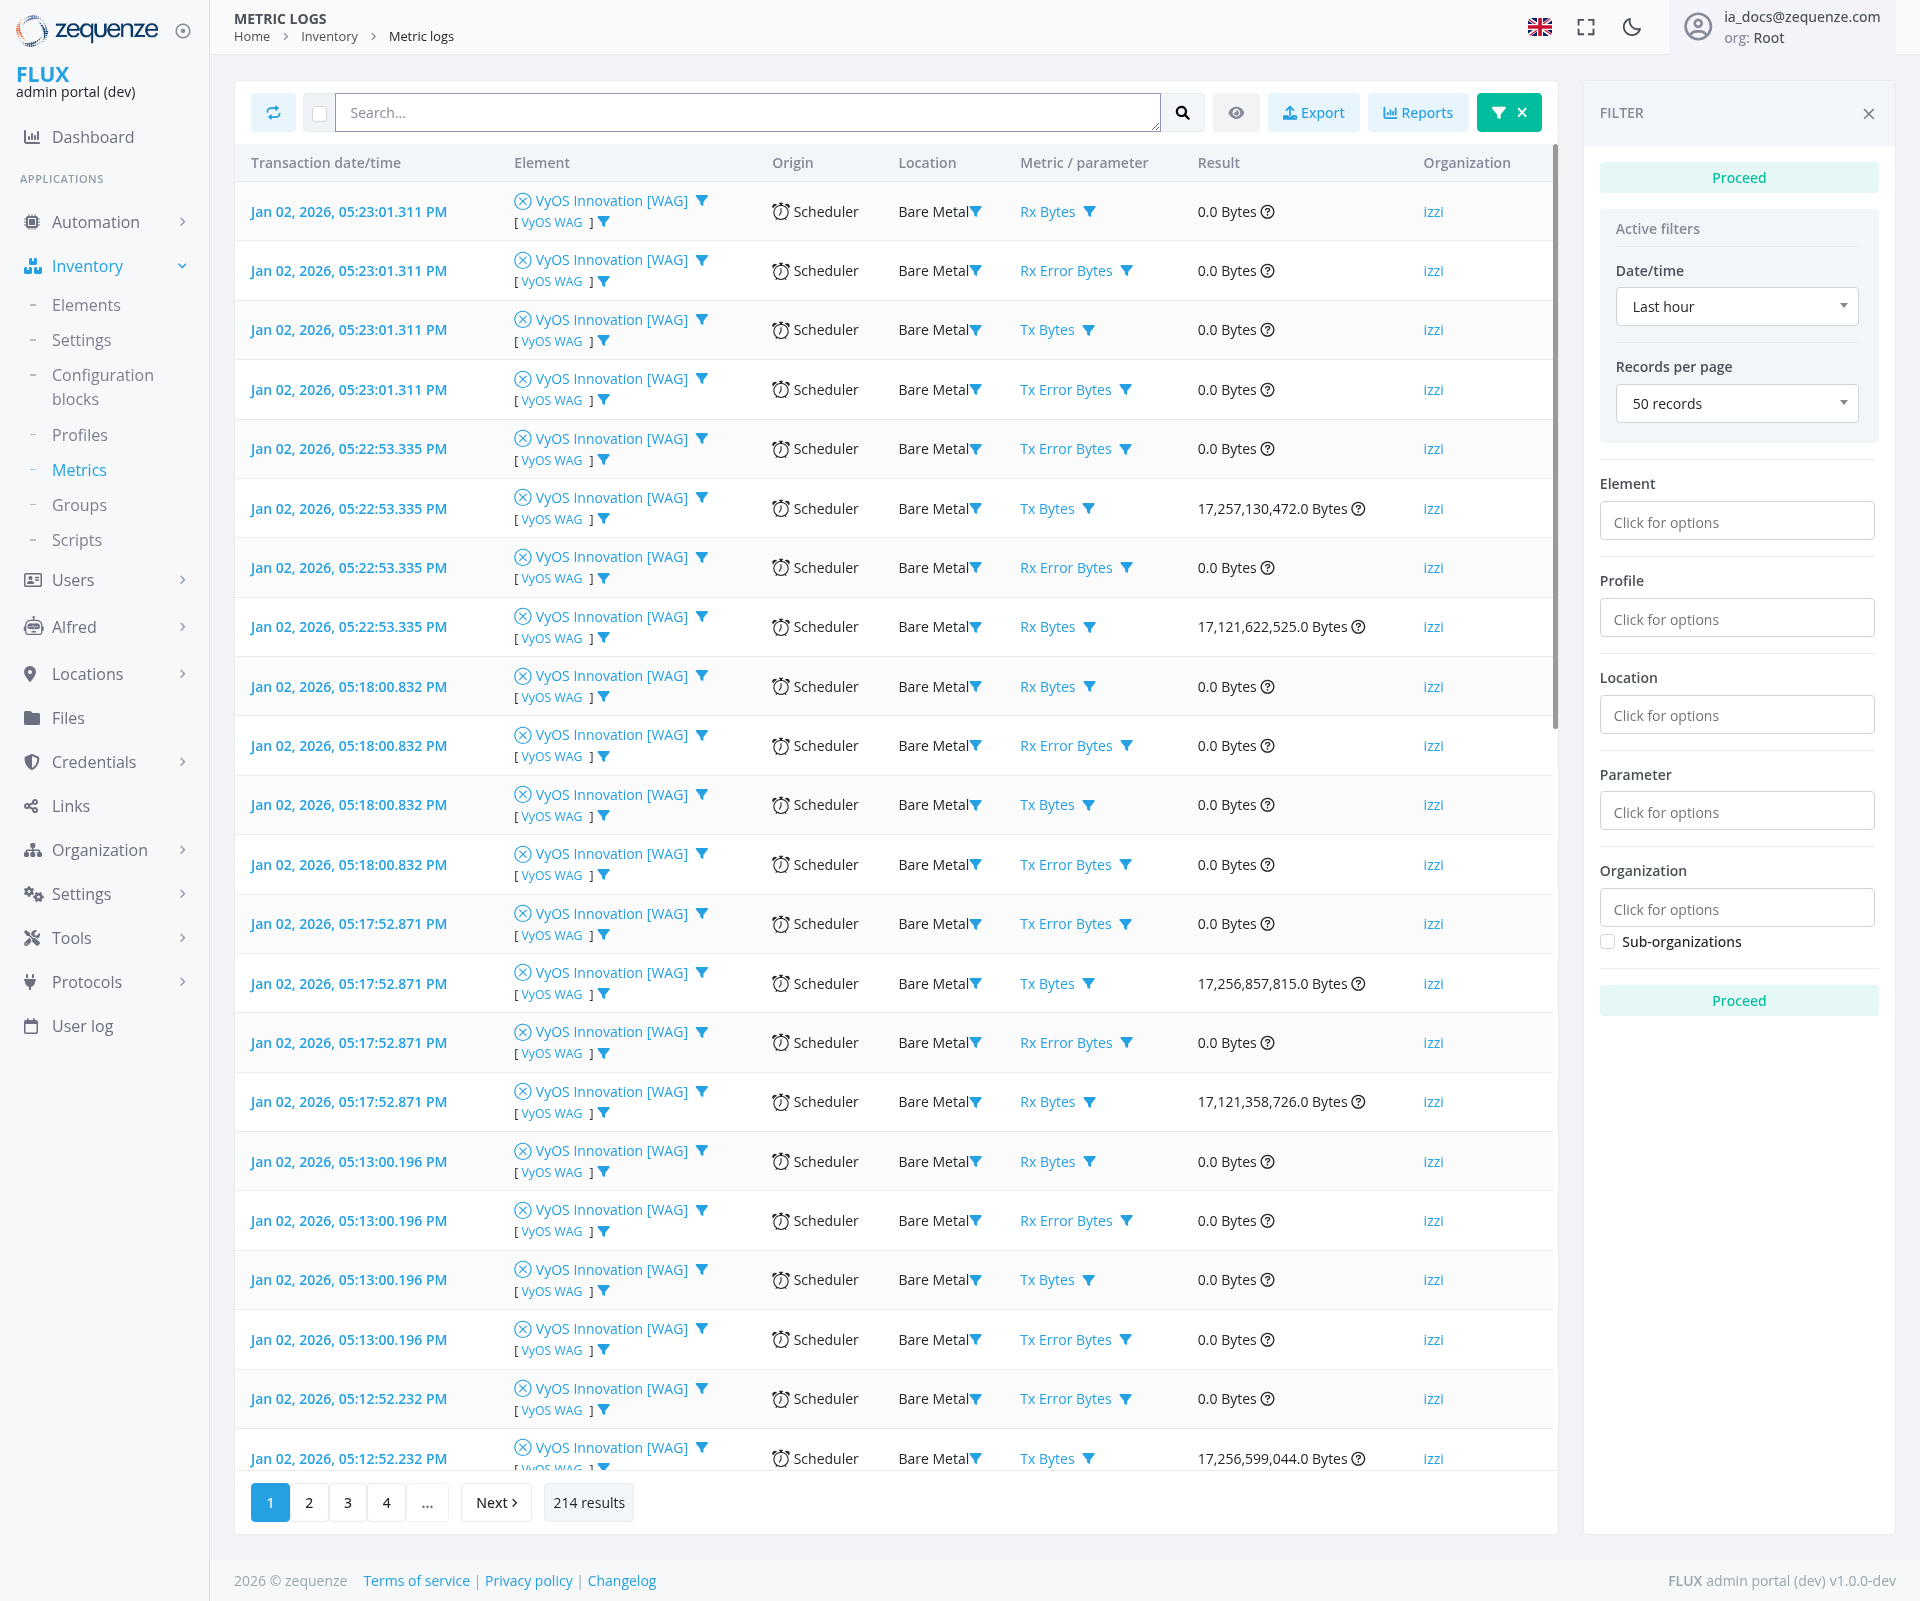
The Metric Logs page in the Zequenze Control Portal provides a comprehensive view of all metric data collected from various devices and sensors in your fleet. This centralized logging system displays real-time and historical metric information, allowing administrators to monitor system performance, track data collection activities, and troubleshoot connectivity issues across their IoT infrastructure.
Key Features
- Real-time Metric Monitoring: View live data streams from connected devices and sensors
- Historical Data Access: Browse through timestamped metric logs with detailed filtering options
-
Multi-parameter Tracking: Monitor various data types including network
routermetrics,packageupgrade operations, and data transfer measurements - Advanced Filtering: Filter logs by date/time, element, location, profile, and other parameters
- Data Export Capabilities: Export metric data for external analysis and reporting
- Pagination Support: Navigate through large datasets efficiently with pagination controls
UI Elements
Main Data Table
The central table displays metric logs with the following columns:
-
Transaction date/time: Timestamp of when the metric was recorded (Jan 02,
20242026 format) -
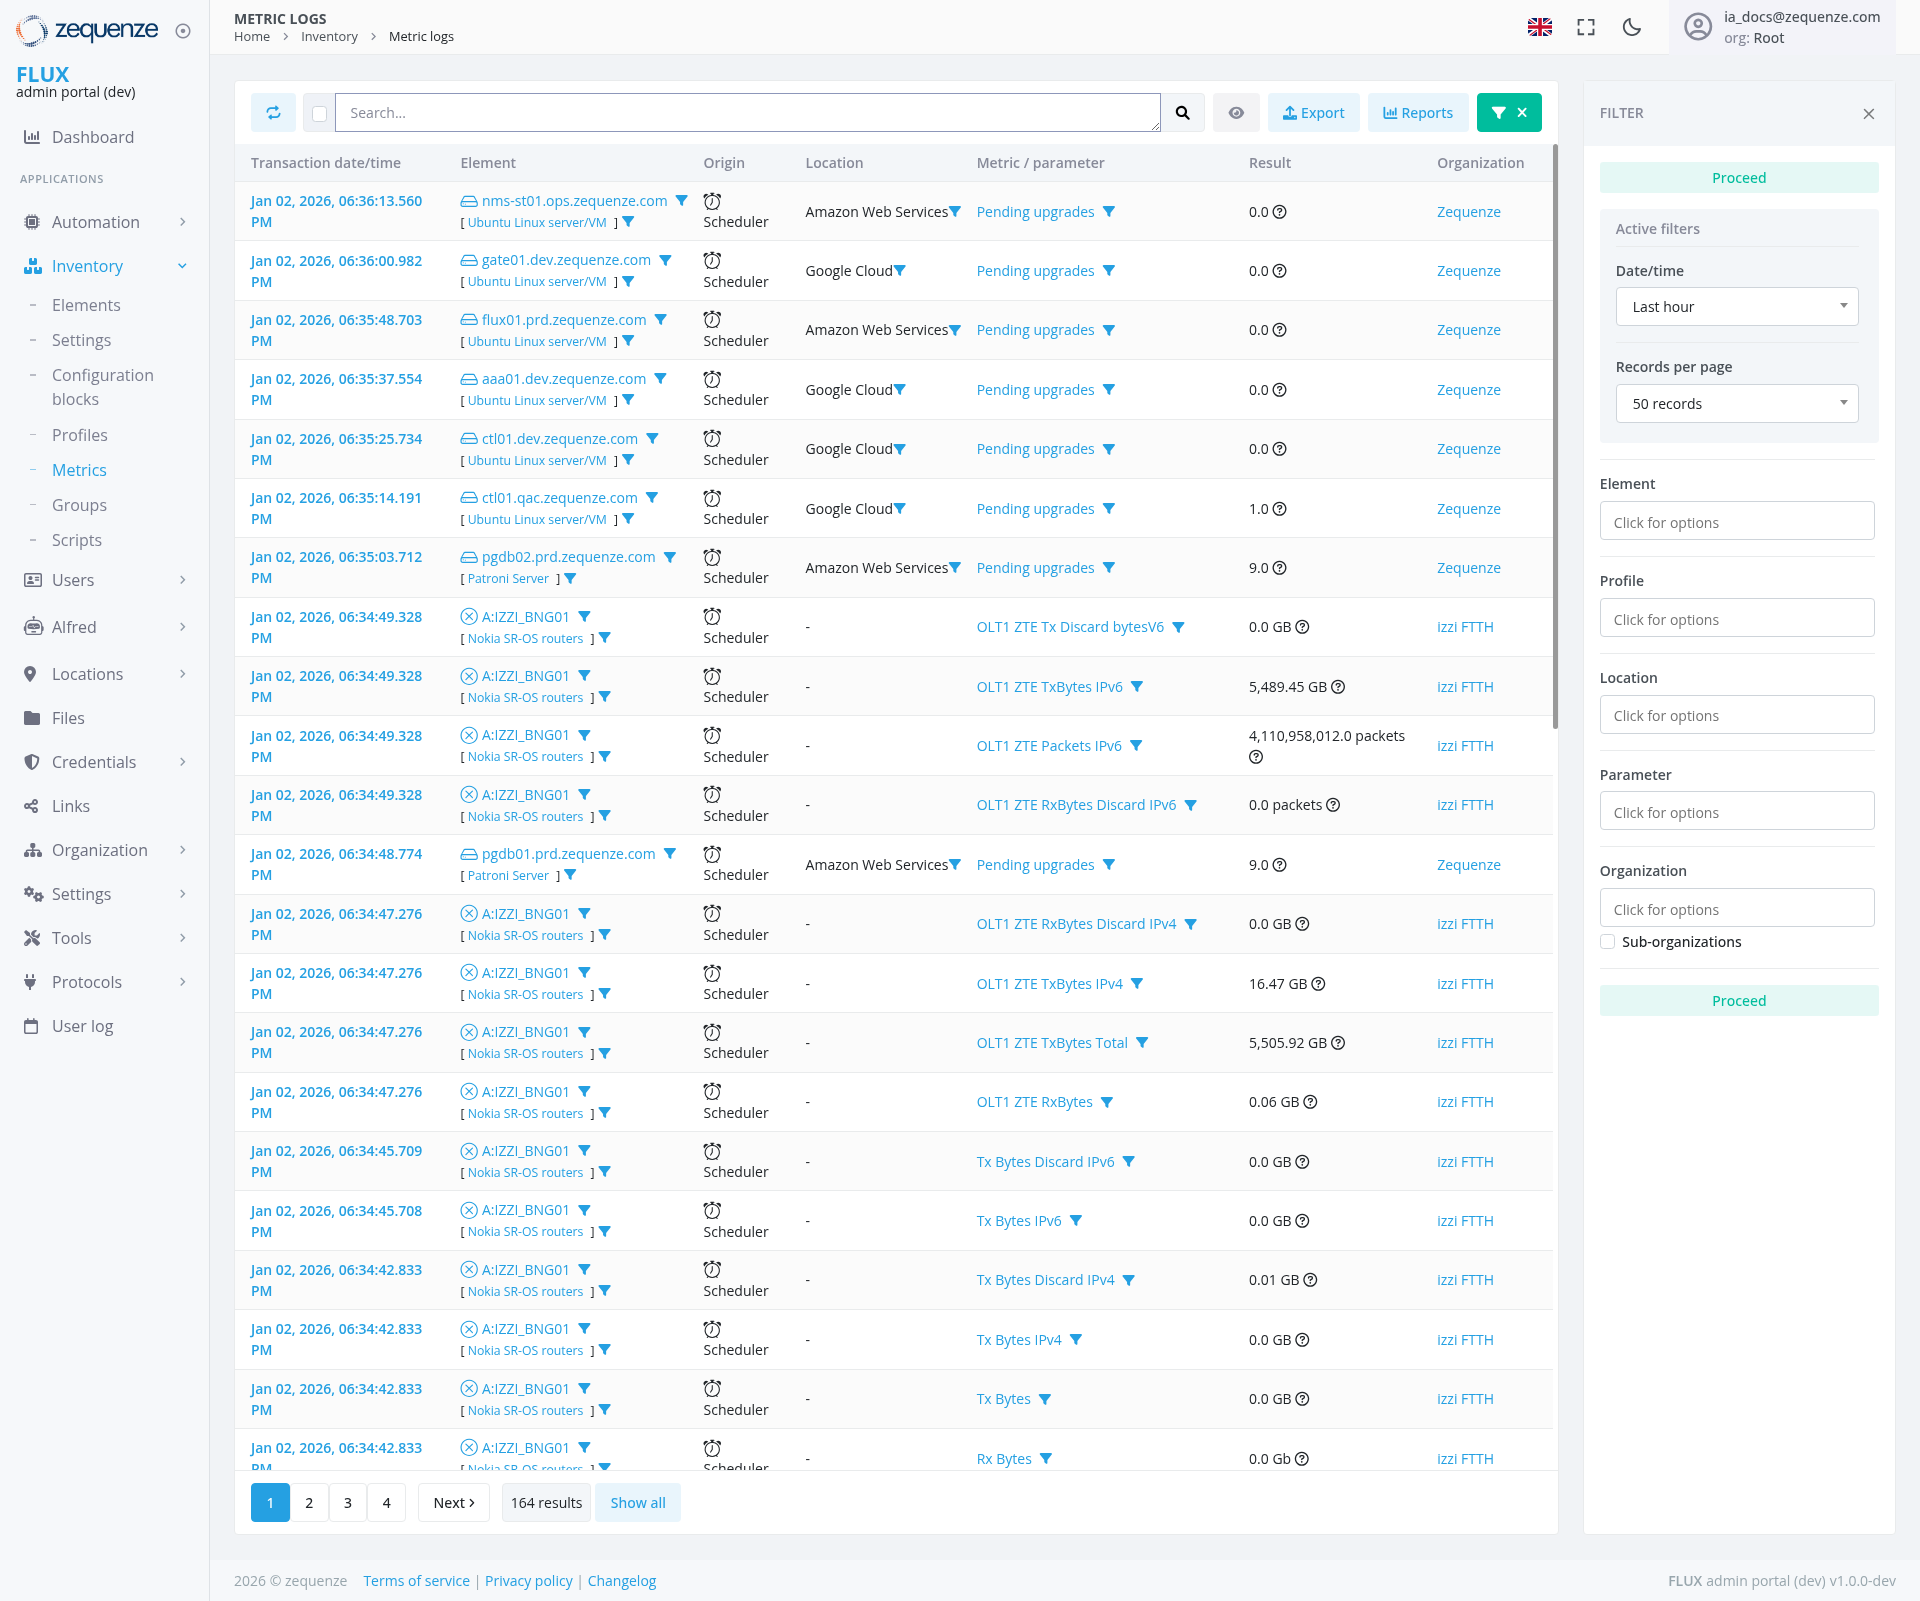
Element: Device or sensor identifier (shows
VyOSvariousInnovationelements[VWAG]includingnetworkrms-n101.ops.zequenze.com,devices)patch1-dev.zequenze.com, and Nokia routers) - Origin: Source of the data collection (Scheduler)
-
Location: Physical or logical location of the device (
BareAmazonMetal)Web Services, Google Cloud) -
Metric/Parameter: Type of data being measured (includes
network"Pendingmetrics like "Rx Bytes"upgrades", "TxQLTTBytes"ZTE TxBytes Total", "RxQLTTErrorZTEBytes"RxBytes","TxnetworkErrortrafficBytes")metrics) -
Result: Actual metric values showing upgrade counts, byte
measurementsmeasurements, and packet statistics -
Organization: Associated organization (
izi)Zequenze, izzi FTTH)
Filter Panel (Right Sidebar)
The filter panel is positioned on the right side with the following elements:
- Active Filters: Shows currently applied filters with "Proceed" status indicator at the top
- Date/Time Filter: "Last hour" dropdown selection
- Records Per Page: Set to "50 records" with dropdown options
- Element Filter: "Click for options" dropdown
- Profile Filter: "Click for options" dropdown
- Location Filter: "Click for options" dropdown
- Parameter Filter: "Click for options" dropdown
- Organization Filter: "Click for options" dropdown
- Sub-organizations: Additional organizational filtering with "Proceed" status indicator at the bottom
Top Navigation Bar
- Search Field: Global search functionality across metric logs with magnifying glass search icon
- Export Button: Blue export button for downloading filtered data to external formats
- Reports Button: Blue reports button for generating custom reports from metric data
- Filter Toggle: Show/hide the filter panel (located in top-right corner with "FILTER" label and close 'X' button)
User Interactions
Viewing Metrics
- Users can scroll through the paginated list of metric entries
- Click on column headers to sort data by specific criteria
- Use the pagination controls at the bottom (1, 2, 3, 4, ... Next) to navigate through results showing
214164 total results
Filtering Data
- Access the filter panel on the right side of the screen
- Select specific time ranges using the Date/Time dropdown
- Choose specific elements, profiles, locations, or parameters from their respective dropdowns
- Apply multiple filters simultaneously for refined results
- Clear filters as needed to expand the data view
- Use the 'X' button in the top-right corner to close the filter panel
Data Export
- Click the blue "Export" button to download filtered metric data
- Select from available export formats for external analysis
Navigation
Accessing the Page
Related Pages
- Dashboard: Return to main overview
- Inventory: Access other inventory management features
- Elements: Manage individual device configurations
- Settings: Configure metric collection parameters
Data Displayed
Metric Types
-
RxPendingBytesupgrades: System upgrade tracking for various devices
Device Integration
The system tracks metrics from VyOSvarious Innovationinfrastructure [VWAG]elements networkincluding:
Data Volumes
The system tracks data ranging from:
-
0.0
Bytesvalues: Minimal or no datatransfertransfer/upgrades -
Large byte measurements: Including entries like
17,257,130,472.5,505.92 GB, 4,110,558,012.0Bytes,packets,17,121,622,525.05,483.45Bytes, 17,256,857,815.0 Bytes, 17,121,358,726.0 Bytes, and 17,256,599,044.0 BytesGB MostentriesUpgradeshowingcounts:eitherNumericalminimalvalues(0.0indicatingBytes)pendingorsystemsubstantial data transfer volumesupgrades
Temporal Data
- All entries are timestamped with precise date and time information
- Data spans multiple time periods for historical analysis
- Recent entries from January 2,
20242026 are displayed with timesranginginfromtheearly06:34-06:36morning hours (05:22 to 05:12 timeframe)timeframe
Actions Available
Primary Actions
- Filter Metrics: Apply various filters to narrow down displayed data
- Export Data: Download metric information for external use using the blue export button
- Generate Reports: Create formatted reports from selected metrics using the blue reports button
- Search Records: Use the search function with magnifying glass icon to find specific entries
- Paginate Results: Navigate through large datasets using page controls
Administrative Actions
- Monitor Real-time Data: View live metric updates as they occur
- Analyze Trends: Compare historical data across different time periods
- Troubleshoot Issues: Identify anomalies or errors in data transmission
- Track System Upgrades: Monitor pending upgrades across infrastructure
Notes/Tips
Performance Optimization
- Use specific filters to reduce large dataset load times
- Consider exporting data for complex analysis rather than processing in-browser
- The default "Last hour" filter helps focus on recent activity
Data Interpretation
-
0.0
BytesResults: May indicate device connectivityissuesissues, scheduled downtime, orschedulednodowntimepending upgrades - Large Data Volumes: High byte counts may suggest heavy usage or potential data anomalies
-
ErrorPendingBytesUpgrades: Non-zeroerrorupgradebytescountswarrantindicateinvestigationsystemsforrequiringnetwork or device issuesattention
Best Practices
- Regularly monitor
errorupgrade metrics to maintain systemhealthcurrency - Use the organization filter when managing multi-tenant environments (Zequenze, izzi FTTH)
- Export historical data periodically for long-term trend analysis and compliance reporting
- Monitor both
transmissionZTE(Tx)device metrics andreceptiongeneral(Rx)networkerror metrics to identify directional communication issuesperformance - Track
VyOScloudnetworkinfrastructuredevicemetrics across Amazon Web Services and Google Cloud platforms