Metric logs
Overview
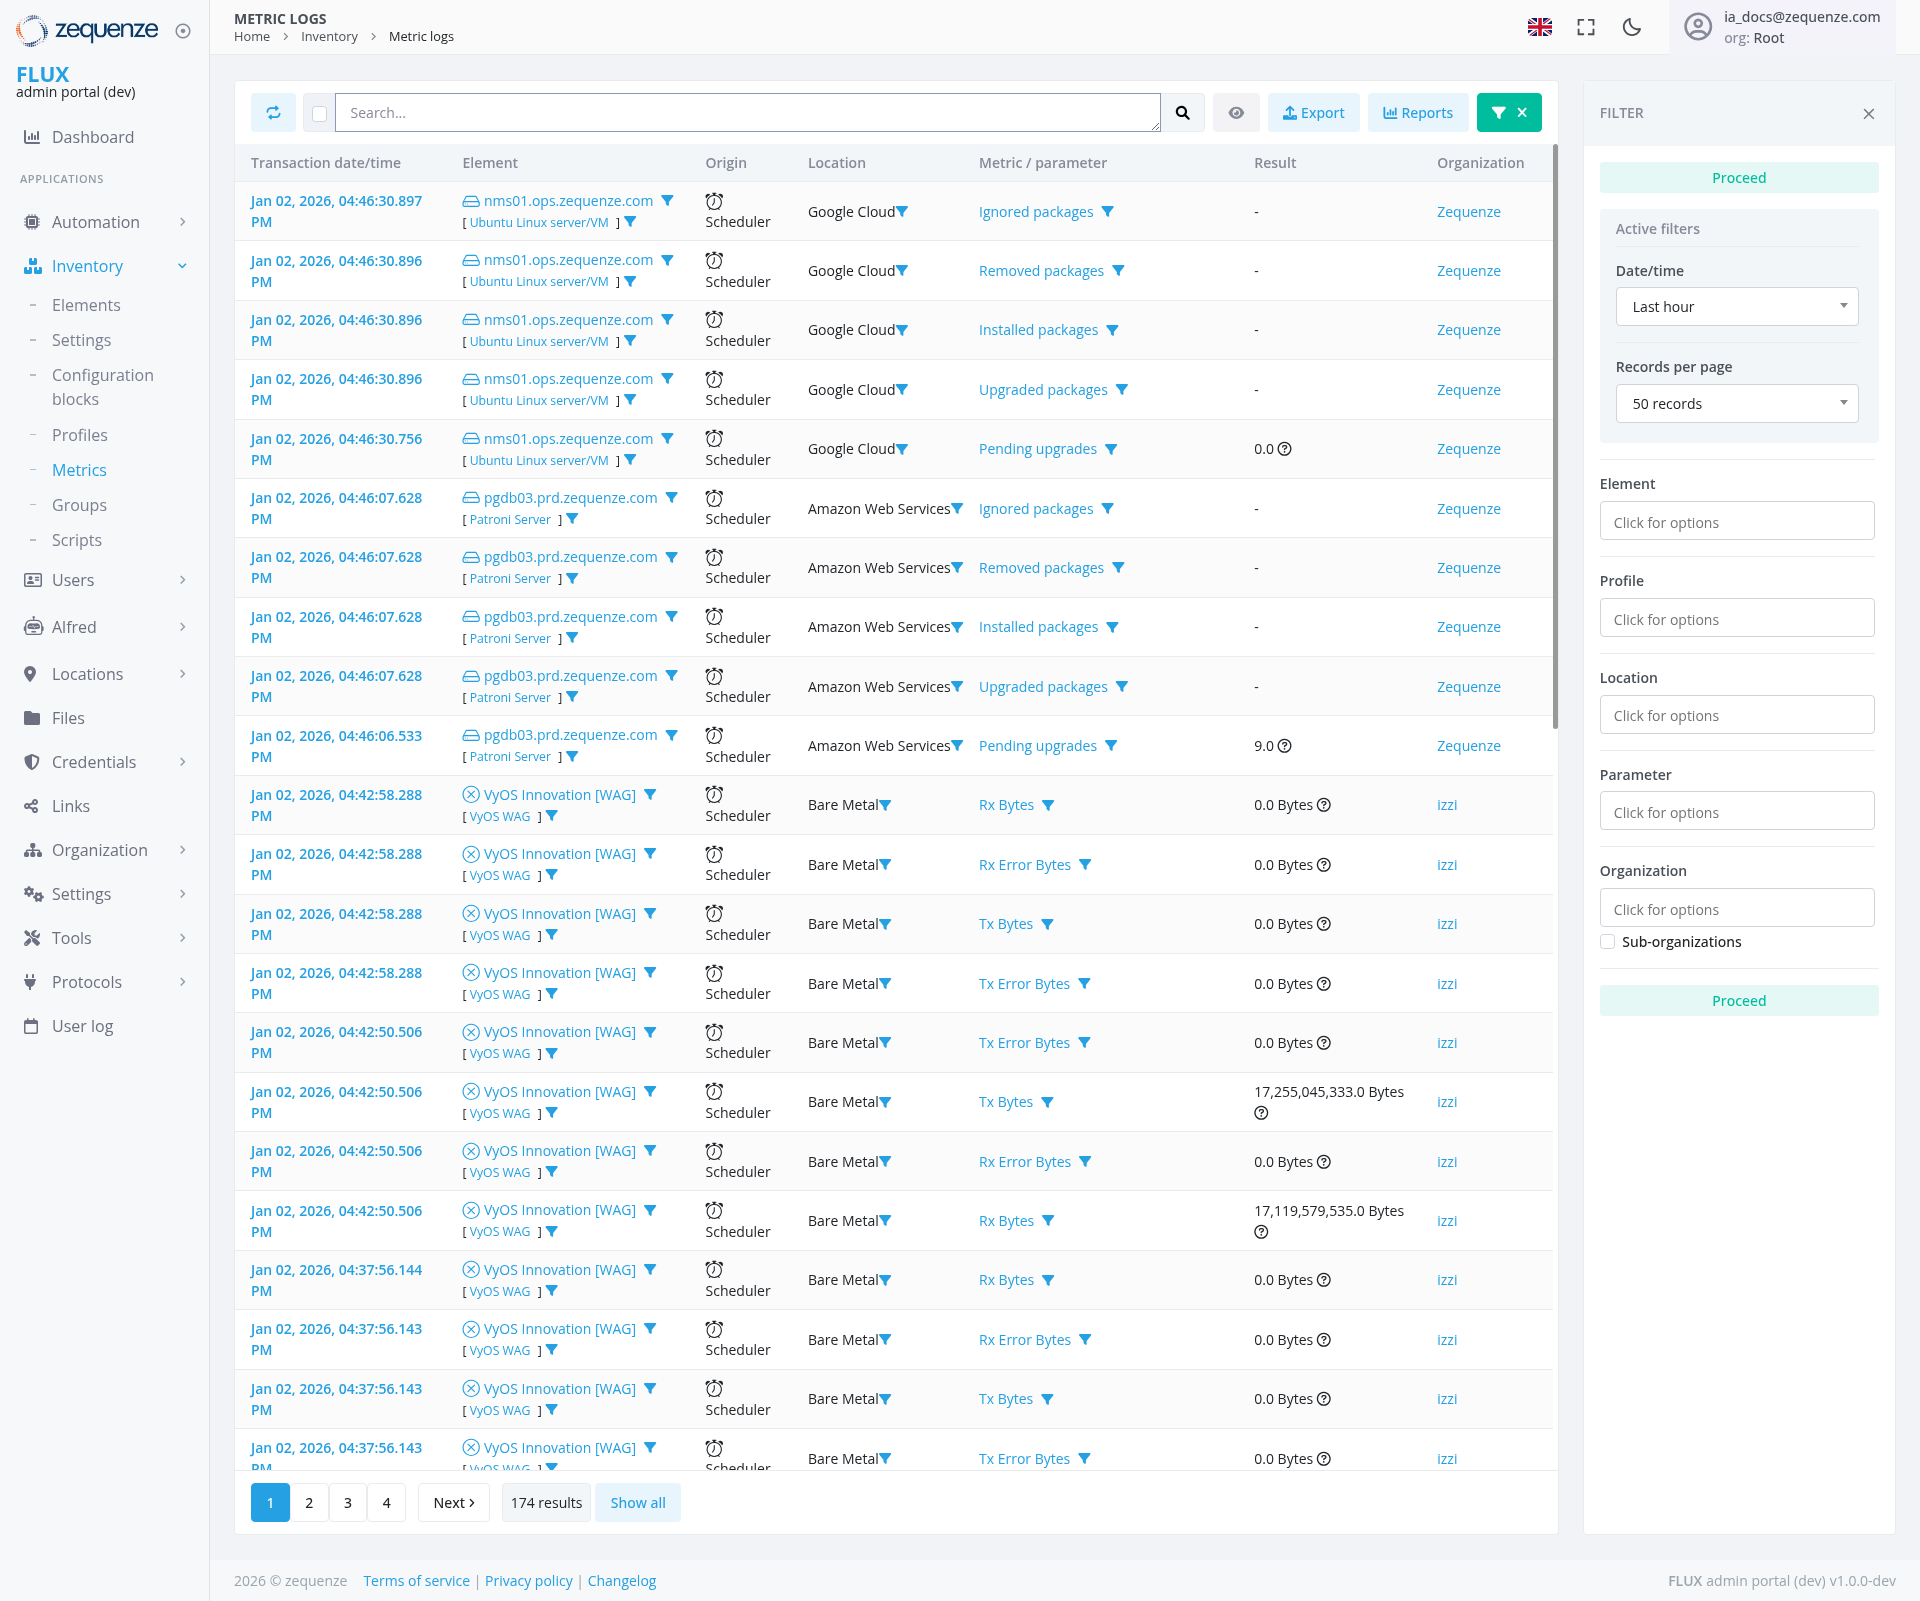
The Metric Logs page in the Zequenze Control Portal provides a comprehensive view of all metric data collected from various devices and sensors in your fleet. This centralized logging system displays real-time and historical metric information, allowing administrators to monitor system performance, track data collection activities, and troubleshoot connectivity issues across their IoT infrastructure.
Key Features
- Real-time Metric Monitoring: View live data streams from connected devices and sensors
- Historical Data Access: Browse through timestamped metric logs with detailed filtering options
- Multi-parameter Tracking: Monitor various data types including network router metrics, package operations, and data transfer measurements
- Advanced Filtering: Filter logs by date/time, element, location, profile, and other parameters
- Data Export Capabilities: Export metric data for external analysis and reporting
- Pagination Support: Navigate through large datasets efficiently with pagination controls
UI Elements
Main Data Table
The central table displays metric logs with the following columns:
- Transaction date/time: Timestamp of when the metric was recorded (Jan 02, 2024 format)
-
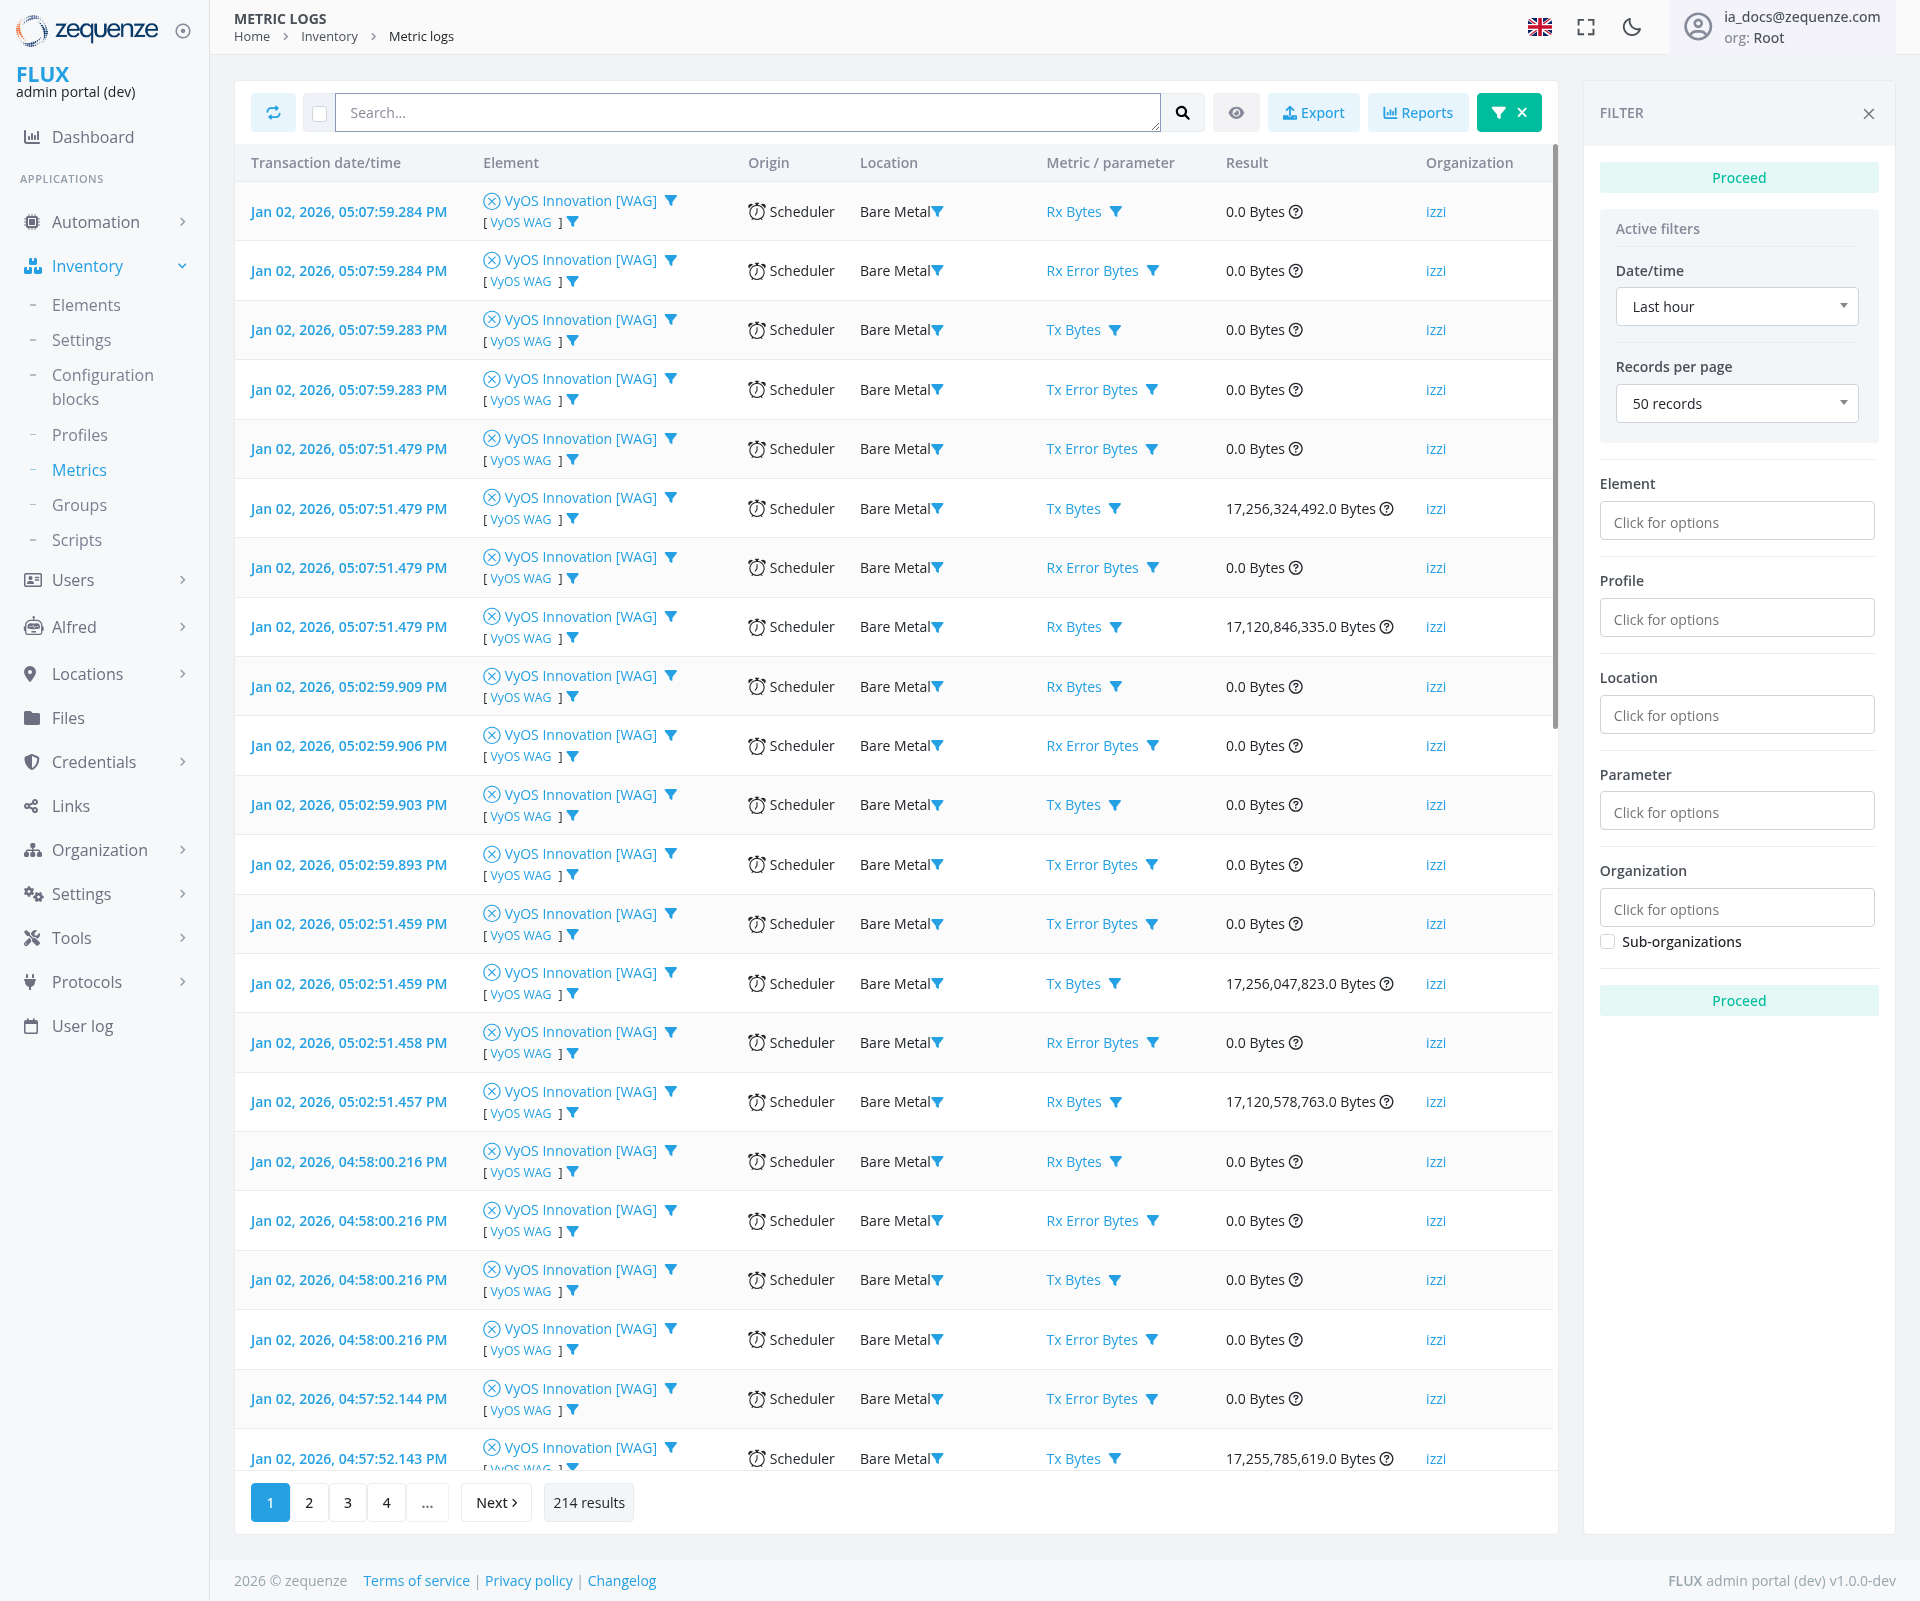
Element: Device or sensor identifier (
displays Ubuntu Linux server, Google Cloud, Amazon Web Services, Bare Metal, andshows VyOS Innovationelements)[VWAG] network devices) - Origin: Source of the data collection (Scheduler)
-
Location: Physical or logical location of the device (
Google Cloud, Amazon Web Services,Bare Metal) -
Metric/Parameter: Type of data being measured (includes
package operations like "ignored packages", "Removed packages", "Installed packages", "Upgraded packages", "Pending upgrades", as well asnetwork metrics like "Rx Bytes", "Tx Bytes", "Rx Error Bytes", "Tx Error Bytes") -
Result: Actual metric values showing byte measurements
or package counts -
Organization: Associated organization (
Zequenze,izi)
Filter Panel (Right Sidebar)
The filter panel has been repositioned and restructured with the following elements:
- Active Filters: Shows currently applied filters with "Proceed" status indicator at the top
- Date/Time Filter: "Last hour" dropdown selection
- Records Per Page: Set to "50 records" with dropdown options
- Element Filter: "Click for options" dropdown
- Profile Filter: "Click for options" dropdown
- Location Filter: "Click for options" dropdown
- Parameter Filter: "Click for options" dropdown
- Organization Filter: "Click for options" dropdown
- Sub-organizations: Additional organizational filtering with "Proceed" status indicator at the bottom
Top Navigation Bar
- Search Field: Global search functionality across metric logs
- Export Button: Export filtered data to external formats
- Reports Button: Generate custom reports from metric data
- Filter Toggle: Show/hide the filter panel (located in top-right corner with "FILTER" label)
User Interactions
Viewing Metrics
- Users can scroll through the paginated list of metric entries
- Click on column headers to sort data by specific criteria
- Use the pagination controls at the bottom (1, 2, 3, 4, ... Next) to navigate through results showing
174214 total results
Filtering Data
- Access the filter panel on the right side of the screen
- Select specific time ranges using the Date/Time dropdown
- Choose specific elements, profiles, locations, or parameters from their respective dropdowns
- Apply multiple filters simultaneously for refined results
- Clear filters as needed to expand the data view
Data Export
- Click the "Export" button to download filtered metric data
- Select from available export formats for external analysis
Navigation
Accessing the Page
Related Pages
- Dashboard: Return to main overview
- Inventory: Access other inventory management features
- Elements: Manage individual device configurations
- Settings: Configure metric collection parameters
Data Displayed
Metric Types
-
Package Management Operations: "ignored packages", "Removed packages", "Installed packages", "Upgraded packages", "Pending upgrades"
Device Integration
The system tracks metrics from multiple infrastructure platforms including:
Data Volumes
The system tracks data ranging from:
- 0.0 Bytes: Minimal or no data transfer
-
Large byte measurements: Including entries like 17,
255,045,333.256,324,492.0BytesBytes, 17,120,846,335.0 Bytes, 17,256,047,823.0 Bytes, 17,120,578,763.0 Bytes, and 17,119,579,535.255,785,619.0 Bytes - Most
Packageentriesoperationshowingcounts:eitherVariousminimalnumerical(0.0resultsBytes)fororsoftwaresubstantialpackagedatamanagementtransferactivitiesvolumes
Temporal Data
- All entries are timestamped with precise date and time information
- Data spans multiple time periods for historical analysis
- Recent entries from January 2, 2024 are displayed with times ranging from early morning hours (
04:2205:07 to 04:4657 timeframe)
Actions Available
Primary Actions
- Filter Metrics: Apply various filters to narrow down displayed data
- Export Data: Download metric information for external use
- Generate Reports: Create formatted reports from selected metrics
- Search Records: Use the search function to find specific entries
- Paginate Results: Navigate through large datasets using page controls
Administrative Actions
- Monitor Real-time Data: View live metric updates as they occur
- Analyze Trends: Compare historical data across different time periods
- Troubleshoot Issues: Identify anomalies or errors in data transmission
Notes/Tips
Performance Optimization
- Use specific filters to reduce large dataset load times
- Consider exporting data for complex analysis rather than processing in-browser
- The default "Last hour" filter helps focus on recent activity
Data Interpretation
- 0.0 Bytes Results: May indicate device connectivity issues or scheduled downtime
- Large Data Volumes: High byte counts may suggest heavy usage or potential data anomalies
- Error Bytes: Non-zero error bytes warrant investigation for network or device issues
Package Operations: Monitor pending upgrades and installation activities across your fleet
Best Practices
- Regularly monitor error metrics to maintain system health
- Use the organization filter when managing multi-tenant environments
- Export historical data periodically for long-term trend analysis and compliance reporting
- Monitor both transmission (Tx) and reception (Rx) error metrics to identify directional communication issues
- Track
packageVyOSmanagementnetworkoperationsdevice performance to ensuresystemsoptimalremainnetworkupdatedinfrastructureand secureoperation