Elements
Overview
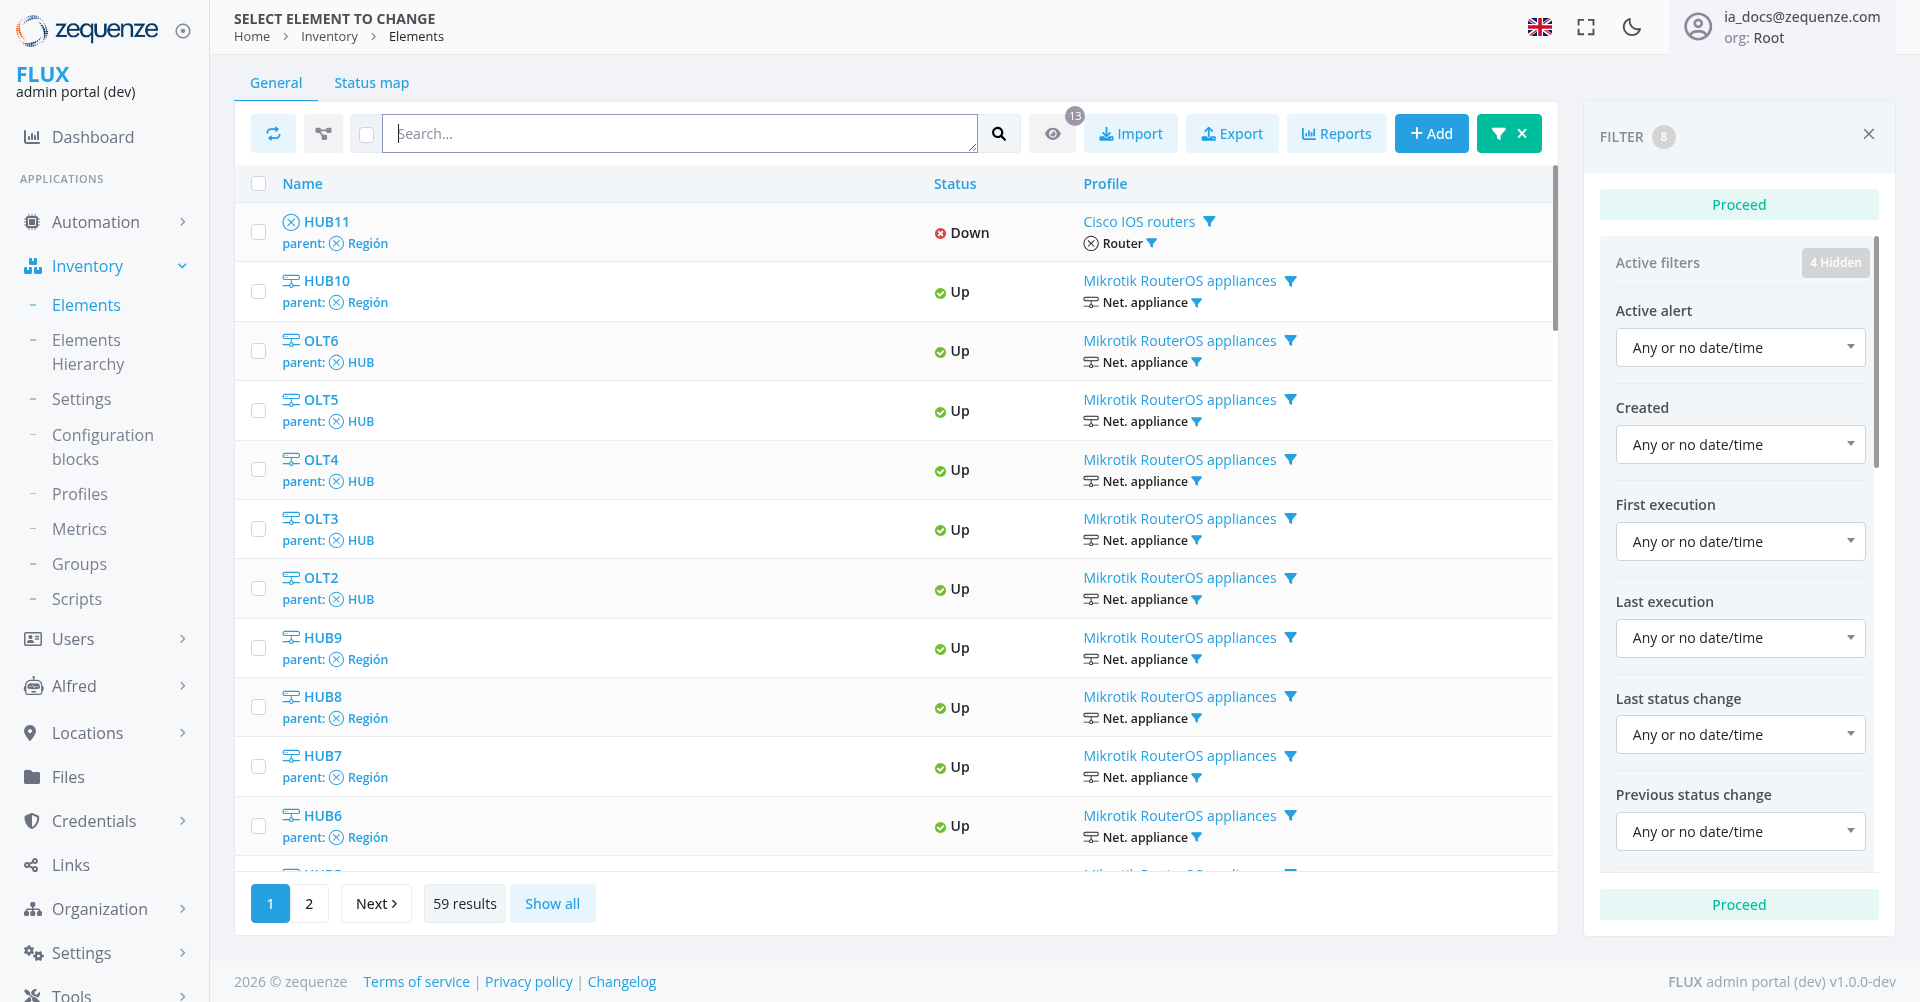
The Inventory Elements page in the Zequenze FLUX Portal provides a comprehensive view of all network elements and devices managed within the system. This centralized dashboard allows administrators to monitor device status, manage configurations, and perform various operations on network infrastructure components.
Key Features
- Real-time Status Monitoring: View current operational status of all network elements
- Advanced Filtering: Multiple filter options to quickly locate specific elements
- Bulk Operations: Import, export, and manage multiple elements simultaneously
- Status Tracking: Monitor changes in device states over time
- Profile Management: View and manage device profiles and configurations
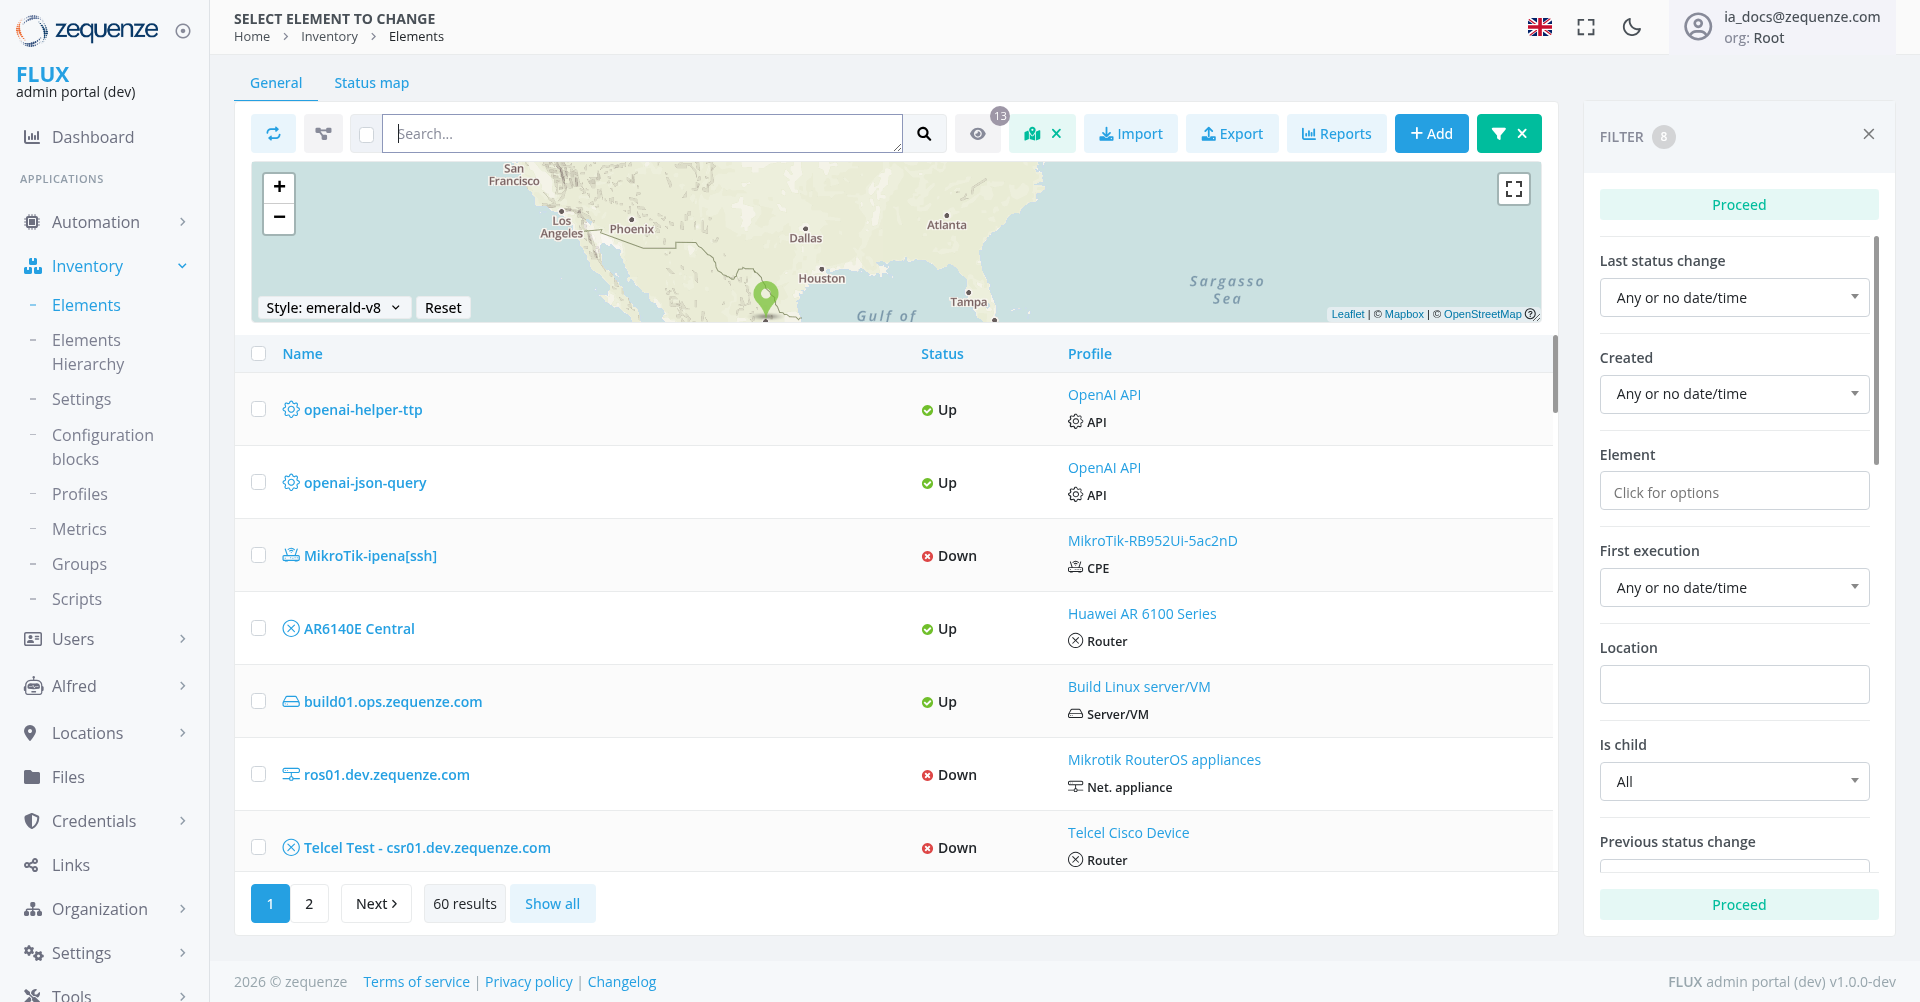
- Interactive Map View: Geographical visualization of network elements with zoom controls
UI Elements
Navigation Bar
- Home → Inventory → Elements breadcrumb navigation
- Language selector (English flag icon)
- User profile indicator showing logged-in user (la_docs@zequenze.com)
- Organization context (org: Root)
Tab Navigation
- General: Current active tab showing element listing
- Status map: Tab for geographical distribution view
Map Controls
Search and Filter Controls
- Search Bar: Text-based search functionality for finding specific elements
- Import Button: Upload element configurations from external files
- Export Button: Download element data and configurations
- Reports Button: Generate reports on element status and performance
- Add Button (+): Create new network elements
- X Button: Clear current filters or selections
- Filter Panel: Advanced filtering options on the right side with "Proceed" button
Data Displayed
The main table shows detailed information about network elements:
Column Structure
- Name: Element identifier with clickable links
and parent information - Status: Current operational state (Up/Down with colored indicators)
- Profile: Associated device profile and type information
with expandable details
Element Types and Status
The table displays various network elements including:
HUB11openai-helper-ttp: API helper (Status: Up) using OpenAI API profile
Parent-Child Relationships
Elements display hierarchical relationships:
Status Indicators
- 🟢 Green dot: Element is operational (Up)
- 🔴 Red dot: Element is down or experiencing issues
- Profile badges: Show device categories
with(API,detailedCPE,profileRouter,information and expandable dropdown arrows (Router,Server/VM, Net. appliance, etc.)
User Interactions
Map Navigation
Search and Discovery
- Use the search bar to find elements by name or identifier
- Apply filters using the right-side filter panel
- Toggle between General and Status map views
- Clear filters using the X button
Navigate parent-child relationships by clicking on parent links
Element Management
- Click on element names to access detailed configuration
- Use bulk operations for managing multiple elements
- Import/export configurations for backup or migration
Status Monitoring
- Monitor real-time status changes
- View historical status information
- Set up alerts for status changes
Navigation
Access Path
Home → Inventory → Elements
Related Sections
- Settings: Configure element parameters
- Configuration blocks: Manage configuration templates
- Profiles: Define device profiles
- Metrics: View performance data
- Groups: Organize elements into logical groups
- Scripts: Automation and scripting tools
- Locations: Manage device locations
- Credentials: Access and authentication management
- User log: Activity tracking and audit trail
Actions Available
Individual Element Actions
- View Details: Click element name for detailed information
- Edit Configuration: Modify element settings
- Status Management: Monitor and troubleshoot connectivity
Expand Profile Details: Use dropdown arrows to view complete profile specifications
Bulk Operations
- Import Elements: Upload multiple element configurations
- Export Data: Download element information and configurations
- Generate Reports: Create status and performance reports
- Add New Elements: Create single or multiple network elements
- Clear Filters: Use X button to reset current filter selections
- Proceed: Execute batch operations on filtered results
Map Operations
Filtering Options
Filter Panel Options
The right-side filter panel provides advanced filtering capabilities:
- FILTER header with close button (X) in the top-right corner
- Proceed Button: Execute filtering operations on selected criteria (highlighted in green, appearing at the
top and bottom of the panel)top) ActiveLastfilters:statusShows "All hidden" with expandable management options
Notes/Tips
- Performance: The page shows
5960 results with pagination controls for optimal viewing - Real-time Updates: Status indicators provide live monitoring capabilities
- Enhanced Filtering: Multiple time-based filters enable precise element selection based on execution history and status changes
- Visual Feedback: Color-coded status indicators for quick assessment
- Data Export: Use export functionality for reporting and backup purposes
AdvancedInteractiveFilteringMapping:ProceedGeographicalbuttonvisualizationenableshelpsbatchidentifyoperationslocation-basedon filtered resultspatterns andisissues