Elements
Overview
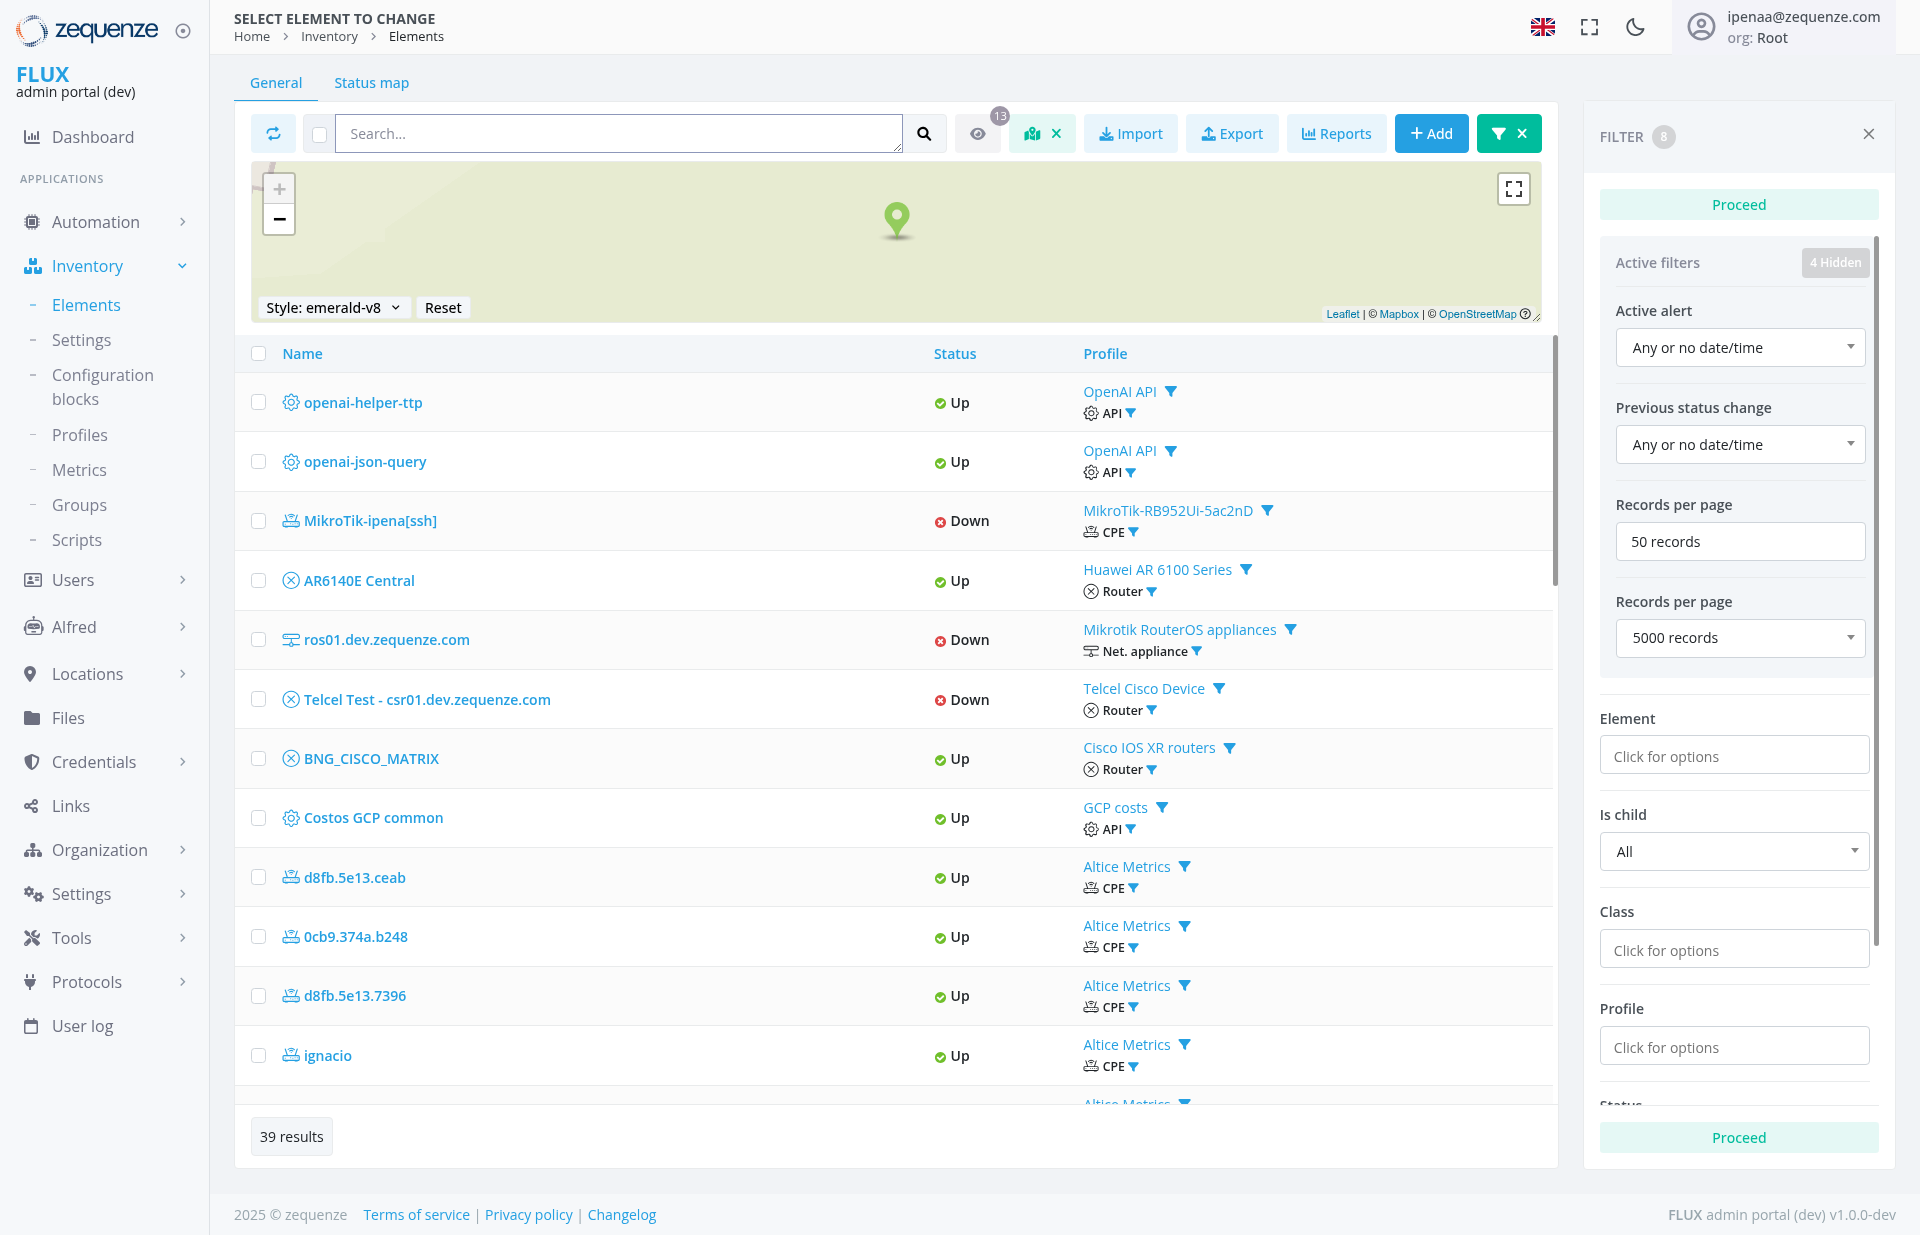
The Inventory Elements page in the Zequenze Control Portal provides a comprehensive view of all network elements and devices managed within the system. This centralized dashboard allows administrators to monitor device status, manage configurations, and perform various operations on network infrastructure components.
Key Features
- Real-time Status Monitoring: View current operational status of all network elements
- Interactive Map View: Visual representation of device locations with status indicators
- Advanced Filtering: Multiple filter options to quickly locate specific elements
- Bulk Operations: Import, export, and manage multiple elements simultaneously
- Status Tracking: Monitor changes in device states over time
- Profile Management: View and manage device profiles and configurations
UI Elements
Navigation Bar
- Home → Inventory → Elements breadcrumb navigation
- Language selector (English flag icon)
- User profile indicator showing logged-in user (
ipenaa@zequenze.ia_docs@zequenze.com) - Organization context (org: Root)
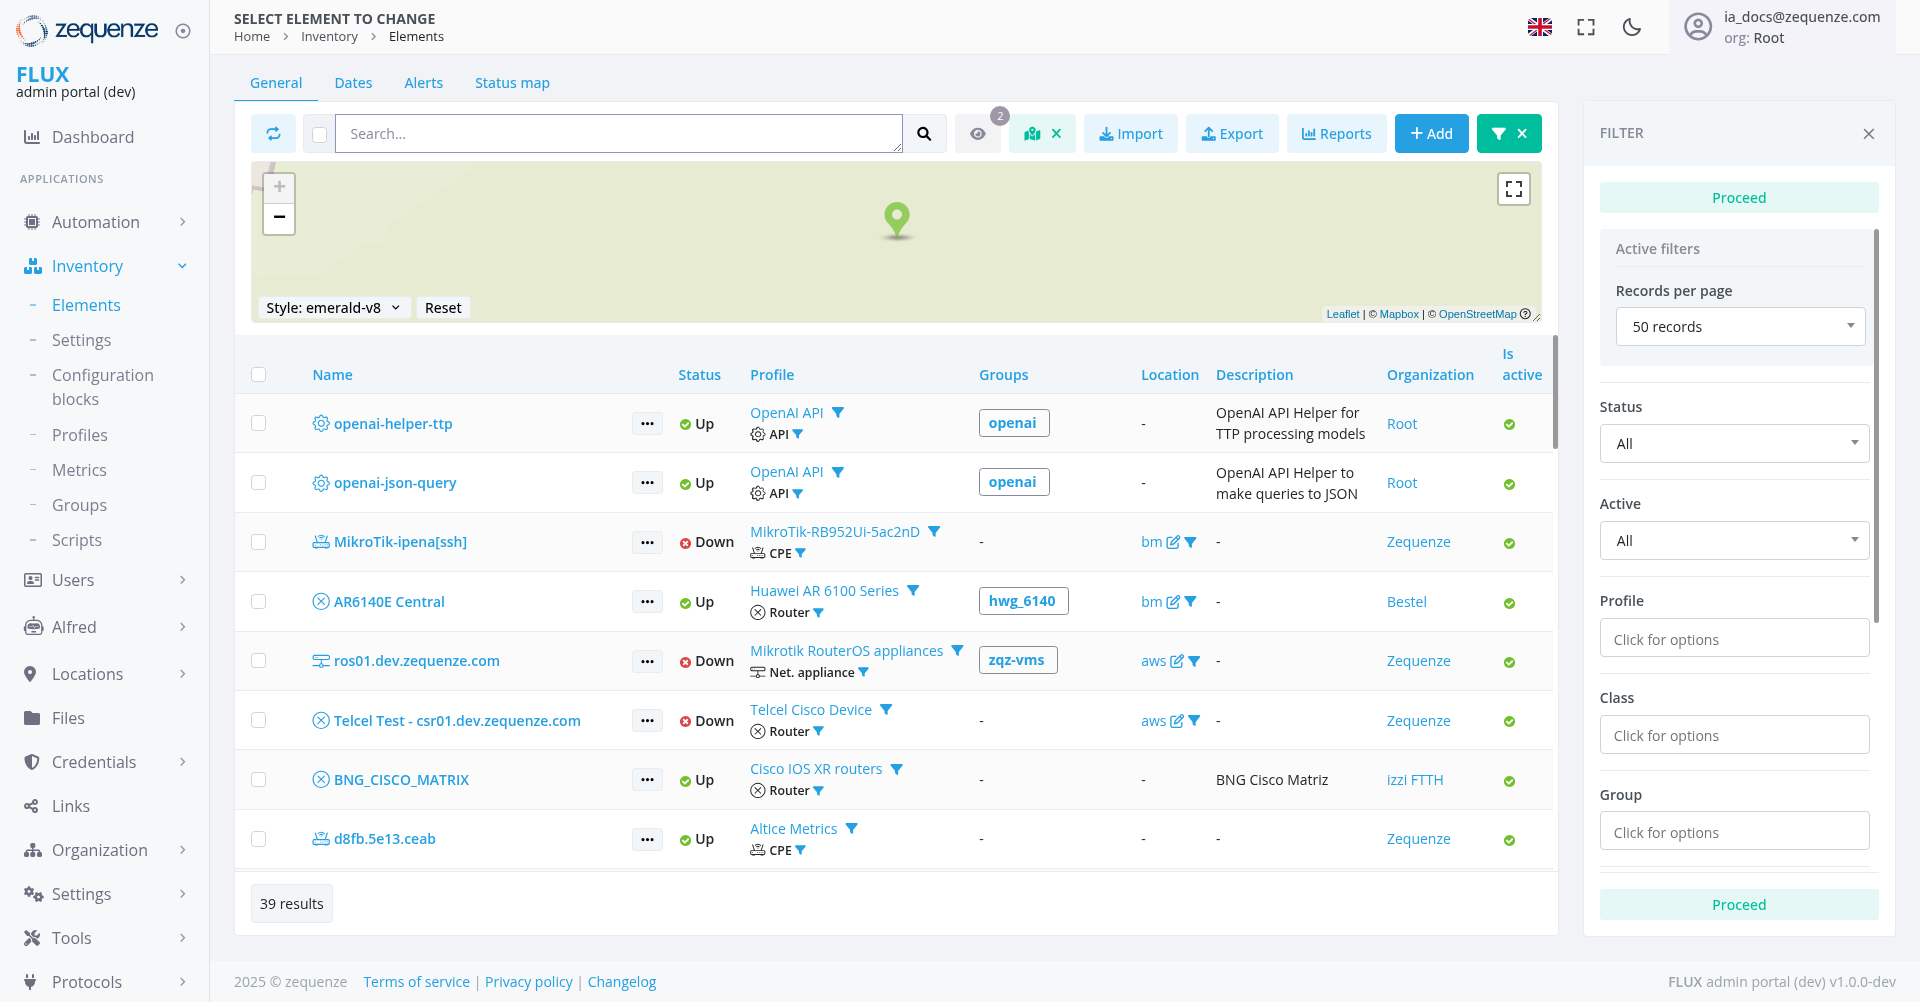
Tab Navigation
- General: Current active tab showing element listing
Search and Filter Controls
- Search Bar: Text-based search functionality for finding specific elements
- Import Button: Upload element configurations from external files
- Export Button: Download element data and configurations
- Reports Button: Generate reports on element status and performance
- Add Button: Create new network elements
- Filter Panel: Advanced filtering options on the right side with "Proceed" button
Map View
- Interactive map with green location markers
- Style selector (currently set to "emerald-v8")
- Zoom controls (+ and - buttons)
- Fullscreen toggle option
Data Displayed
The main table shows detailed information about network elements:
Column Structure
- Name: Element identifier with clickable links
- Status: Current operational state (Up/Down with colored indicators)
- Profile: Associated device profile and type information
- Groups: Group assignments for elements
Element Types and Status
The table displays various network elements including:
- API Elements: OpenAI API helper and JSON query components (Status: Up)
-
Network Hardware: MikroTik
devices,devicesrouters,includingswitchesMikroTik-ipenalsshj (MixedStatus:status)Down) -
Cisco Devices:
VariousAR6140ECiscoCentralnetworkingandequipmentBNG_CISCO_MATRIX (Status: Up) -
GCPRouterOSResourcesDevices:GoogleMikrotikCloudRouterOSPlatformappliancescomponents(Status: Down) -
TelecelTelcel Equipment:Carrier-gradeCisconetworkingdevicedevicesconfigurations (Status: Down)
Status Indicators
- 🟢 Green dot: Element is operational (Up)
- 🔴 Red dot: Element is down or experiencing issues
- Profile badges: Show device categories (API, CPE, Router, Net. appliance, etc.)
User Interactions
Search and Discovery
- Use the search bar to find elements by name or identifier
- Apply filters using the right-side filter panel
- Toggle between
GeneralGeneral, Dates, Alerts, and Status map views
Element Management
- Click on element names to access detailed configuration
- Use bulk operations for managing multiple elements
- Import/export configurations for backup or migration
Status Monitoring
- Monitor real-time status changes
- View historical status information
- Set up alerts for status changes
Navigation
Access Path
Home → Inventory → Elements
Related Sections
- Settings: Configure element parameters
- Configuration blocks: Manage configuration templates
- Profiles: Define device profiles
- Metrics: View performance data
- Groups: Organize elements into logical groups
Actions Available
Individual Element Actions
- View Details: Click element name for detailed information
- Edit Configuration: Modify element settings
- Status Management: Monitor and troubleshoot connectivity
Bulk Operations
- Import Elements: Upload multiple element configurations
- Export Data: Download element information and configurations
- Generate Reports: Create status and performance reports
- Add New Elements: Create single or multiple network elements
- Proceed: Execute batch operations on filtered results
Filtering Options
-
Active Filters:
CurrentlyFilteringshowingcapabilities4withhiddenproceeditemsfunctionality -
Records per page: Adjustable display (50 records
default, up to 5000)default) - Status Filters: Filter by operational state (All options available)
- Profile Filters: Filter by device type or profile
- Element Type: Filter by specific element categories
Filter Panel Options
The right-side filter panel provides advanced filtering capabilities:
Notes/Tips
- Performance: The page shows 39 total results, indicating efficient data loading
- Real-time Updates: Status indicators provide live monitoring capabilities
-
ScalabilityEnhanced Navigation:SupportsAdditionaluptabsto(Dates,5000Alerts)recordsprovidepercomprehensivepageelementfor large deploymentsmanagement - Visual Feedback: Color-coded status indicators for quick assessment
- Responsive Design: Map view can be expanded to fullscreen for better visibility
- Data Export: Use export functionality for reporting and backup purposes
-
QuickAdvancedActionsFiltering: Proceed buttonavailable forenables batch operations on filtered results - Comprehensive Views: Multiple columns provide detailed element information including groups, locations, and organizational context