Automation flows
Overview
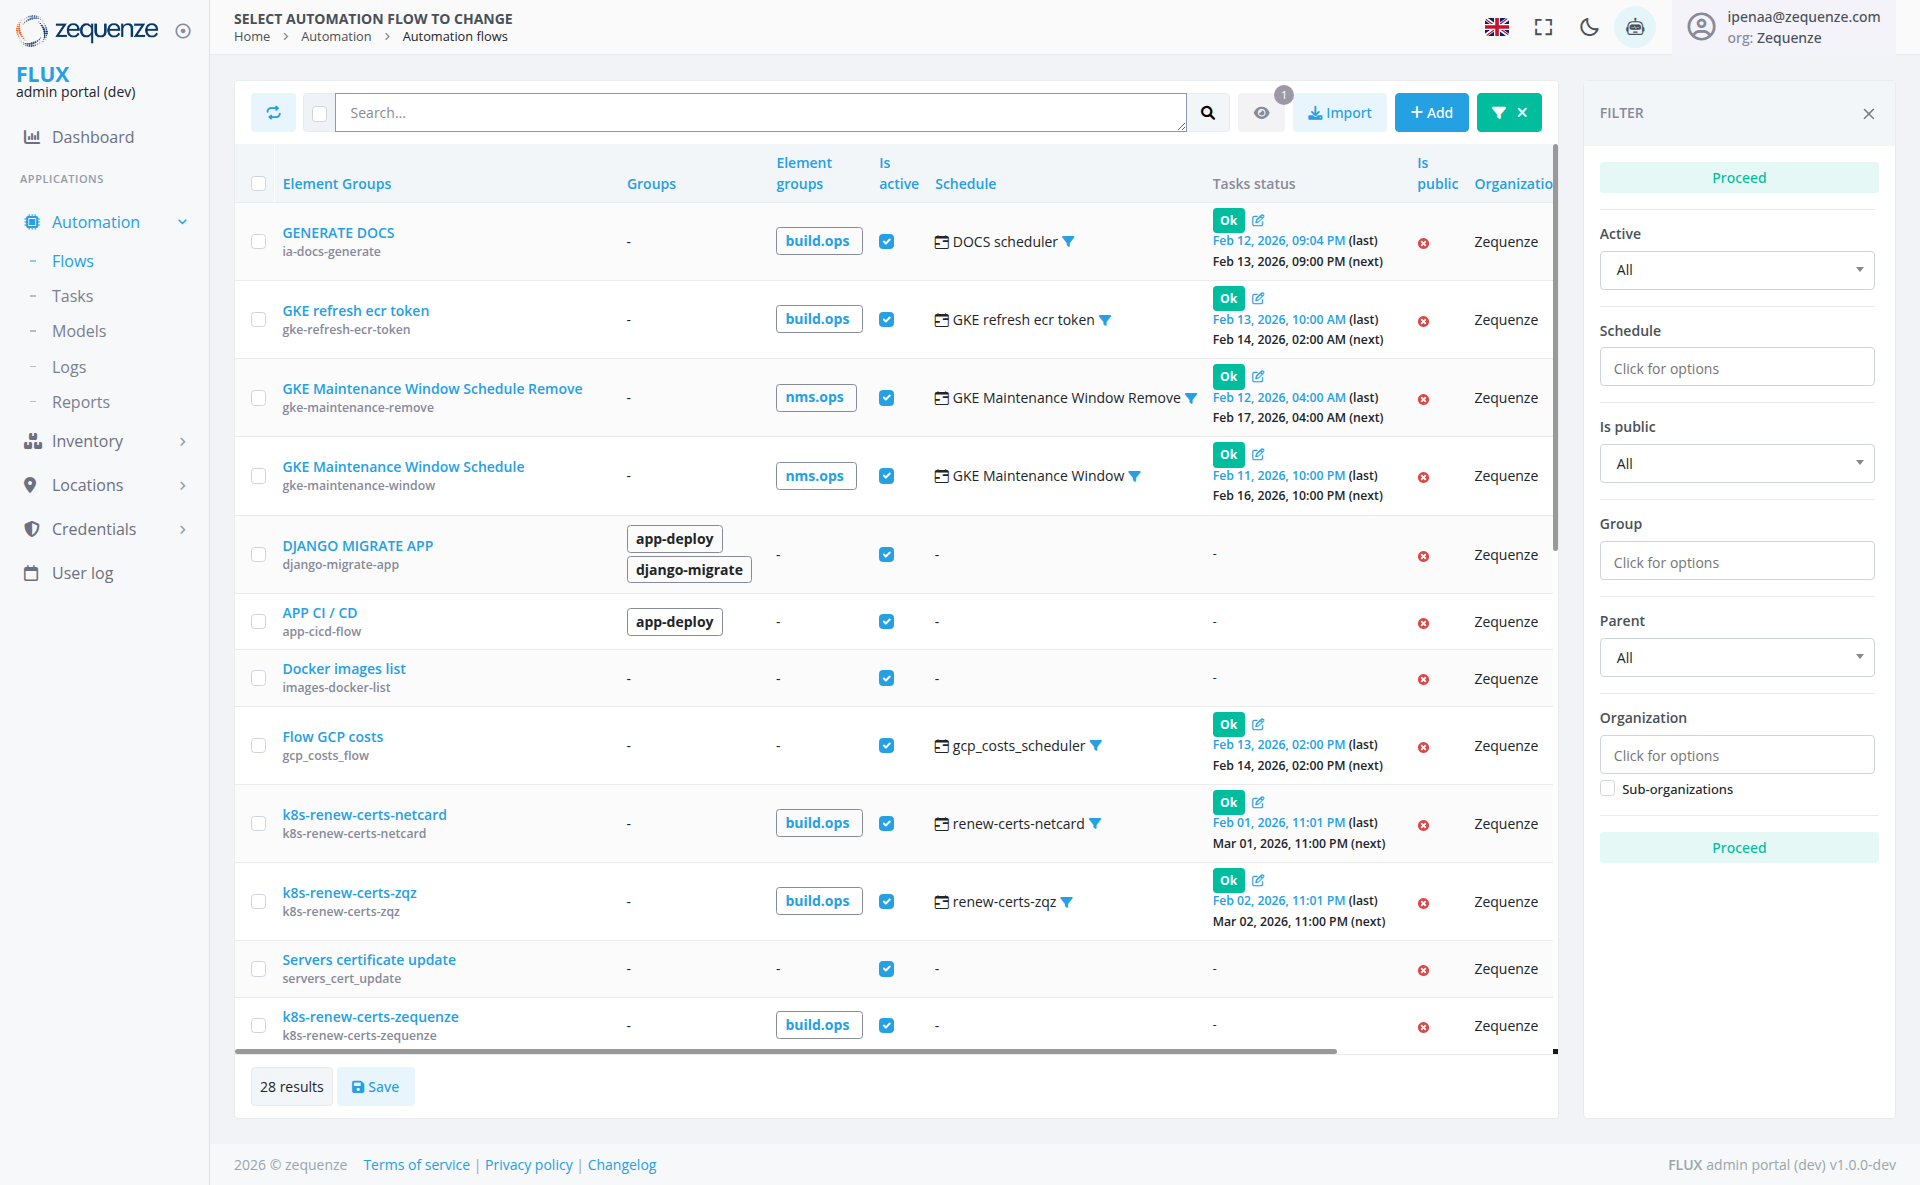
The Automation Flows page in the Zequenze CONTROLFLUX Portaladmin portal provides a comprehensive management interface for viewing, monitoring, and controlling automated workflows. This page displays all automation flows configured in the system with their current status, scheduling information, and execution details.
Key Features
-
Flow Management Dashboard: Centralized view of all automation flows with real-time status monitoring
-
Advanced Filtering: Multiple filter options including status, schedule, visibility, group, parent, and organization
-
Bulk Operations: Import and add multiple flows with dedicated action buttons
-
Status Tracking: Real-time status indicators (OK, Active, Failed) with timestamp information
-
Scheduling Overview: Visual representation of flow schedules and execution times
-
Group Organization: Flows organized by element groups and operational groups
UI Elements
-
Breadcrumb Navigation: Home > Automation > Automation flows
-
Page Title: "SELECT AUTOMATION FLOW TO CHANGE"
-
User Account: Displays logged-in user (ipenaa@zequenze.com) with org: Zequenze access
-
Top-right Toolbar: Language selector (flag icon), expand/fullscreen toggle, dark mode toggle, print icon, and user profile menu
Action Bar
Refresh Button: Circular arrow icon for refreshing the flow list
Select All Checkbox: Checkbox for bulk selection of flows
Search Field: Global search functionality for filtering flows
Search Button: Magnifying glass icon to execute search
View Toggle: Eye icon with notification badge (1) for view options
Import Button: Blue button for importing automation flows
Add Button: Green button with plus icon for creating new automation flows
RemoveFilter FilterToggle Button: Green
button with funnel icon and "X"
button for
clearingmanaging appliedthe filtersfilter panel
Filter Panel Toggle: "FILTER" button with collapse arrow
(×) to open/close the filter panel on the right side
Filter Panel
The right-side filter panel displays the following filter options:
-
Proceed: Top section with green "Proceed" button for
proceeding withapplying filtered results
-
Active: Dropdown filter with "All" selected for active/inactive flows
-
Schedule: "Click for options" section for scheduling configuration
-
Is public: Dropdown filter with "All" selected for visibility settings
-
Group: "Click for options" section for operational groups
-
Parent: Dropdown filter with "All" selected for parent-child relationships
-
Organization: "Click for options" section with Sub-organizations checkbox option
-
Proceed: Bottom section with green "Proceed" button for additional
proceedresult optionsprocessing
Main Data Table
The table displays the following columns:
Checkbox: Row selection checkboxes for bulk operations
Element Groups: Shows the automation flow names and descriptions
Groups: Associated group tags (app-deploy, django-migrate, nms.ops, build.ops,
reboot.prd, etc.)
Element groups: Related element groupings
Is active: Checkbox indicators for active/inactive status
Schedule: Time-based scheduling information with duration indicators and scheduler tags
Tasks status: Current execution status with OK/Failed indicators and timestamps showing both last and next execution times
Is public: Visibility settings
Organization: Organizational assignment (all showing "Zequenze")
Proceed: Action column for individual flow operations
User Interactions
Navigation
- Access via main navigation: Automation > Flows
- Use breadcrumb navigation to return to higher-level pages
- Navigate using the left sidebar menu under "APPLICATIONS"
Search and Filter
-
Refresh Data: Click the circular arrow icon to refresh the flow list
Bulk Selection: Use the "Select All" checkbox to select/deselect all flows
Global Search: Use the search bar to find specific flows by name or
descriptiondescription, then click the search button (magnifying glass icon)
View Options: Click the eye icon with notification badge to access view configuration options
Filter Panel: Click the "FILTER"
button or the green filter toggle button to open/close the filter panel on the right side
Clear Filters: Use the green
"X"filter toggle button
nextwith to the Add button"X" to remove all applied filters
Proceed SectionActions:
AccessClick filteringthe optionsgreen in"Proceed" bothbuttons at the top
andor bottom
Proceedof sectionsthe filter panel to apply selected filters
Active Filter: Use the dropdown filter (currently set to "All") to filter by Active/Inactive status
Schedule Filter: Click "Click for options" to access scheduling filters
Is public Filter: Use the dropdown (currently set to "All") to filter by visibility settings
Group Filter: Click "Click for options" to filter by operational groups
Parent Filter: Use the dropdown (currently set to "All") to filter by parent-child relationships
Organization Filter: Click "Click for options" to access organizational filtering with sub-organization checkbox options
Flow Management Actions
-
Select Flows: Use individual row checkboxes to select specific flows for bulk operations
View Details: Click on any flow name to view detailed configuration
Status Monitoring: Monitor real-time status indicators and timestamps
Import Flows: Use the Import button to bulk import automation configurations
Add New Flow: Use the Add button to create new automation workflows
Filter Management: Use the filter panel to apply multiple filter criteria simultaneously
Individual Actions: Use the action icons in the rightmost column for flow-specific operations
Data Displayed
-
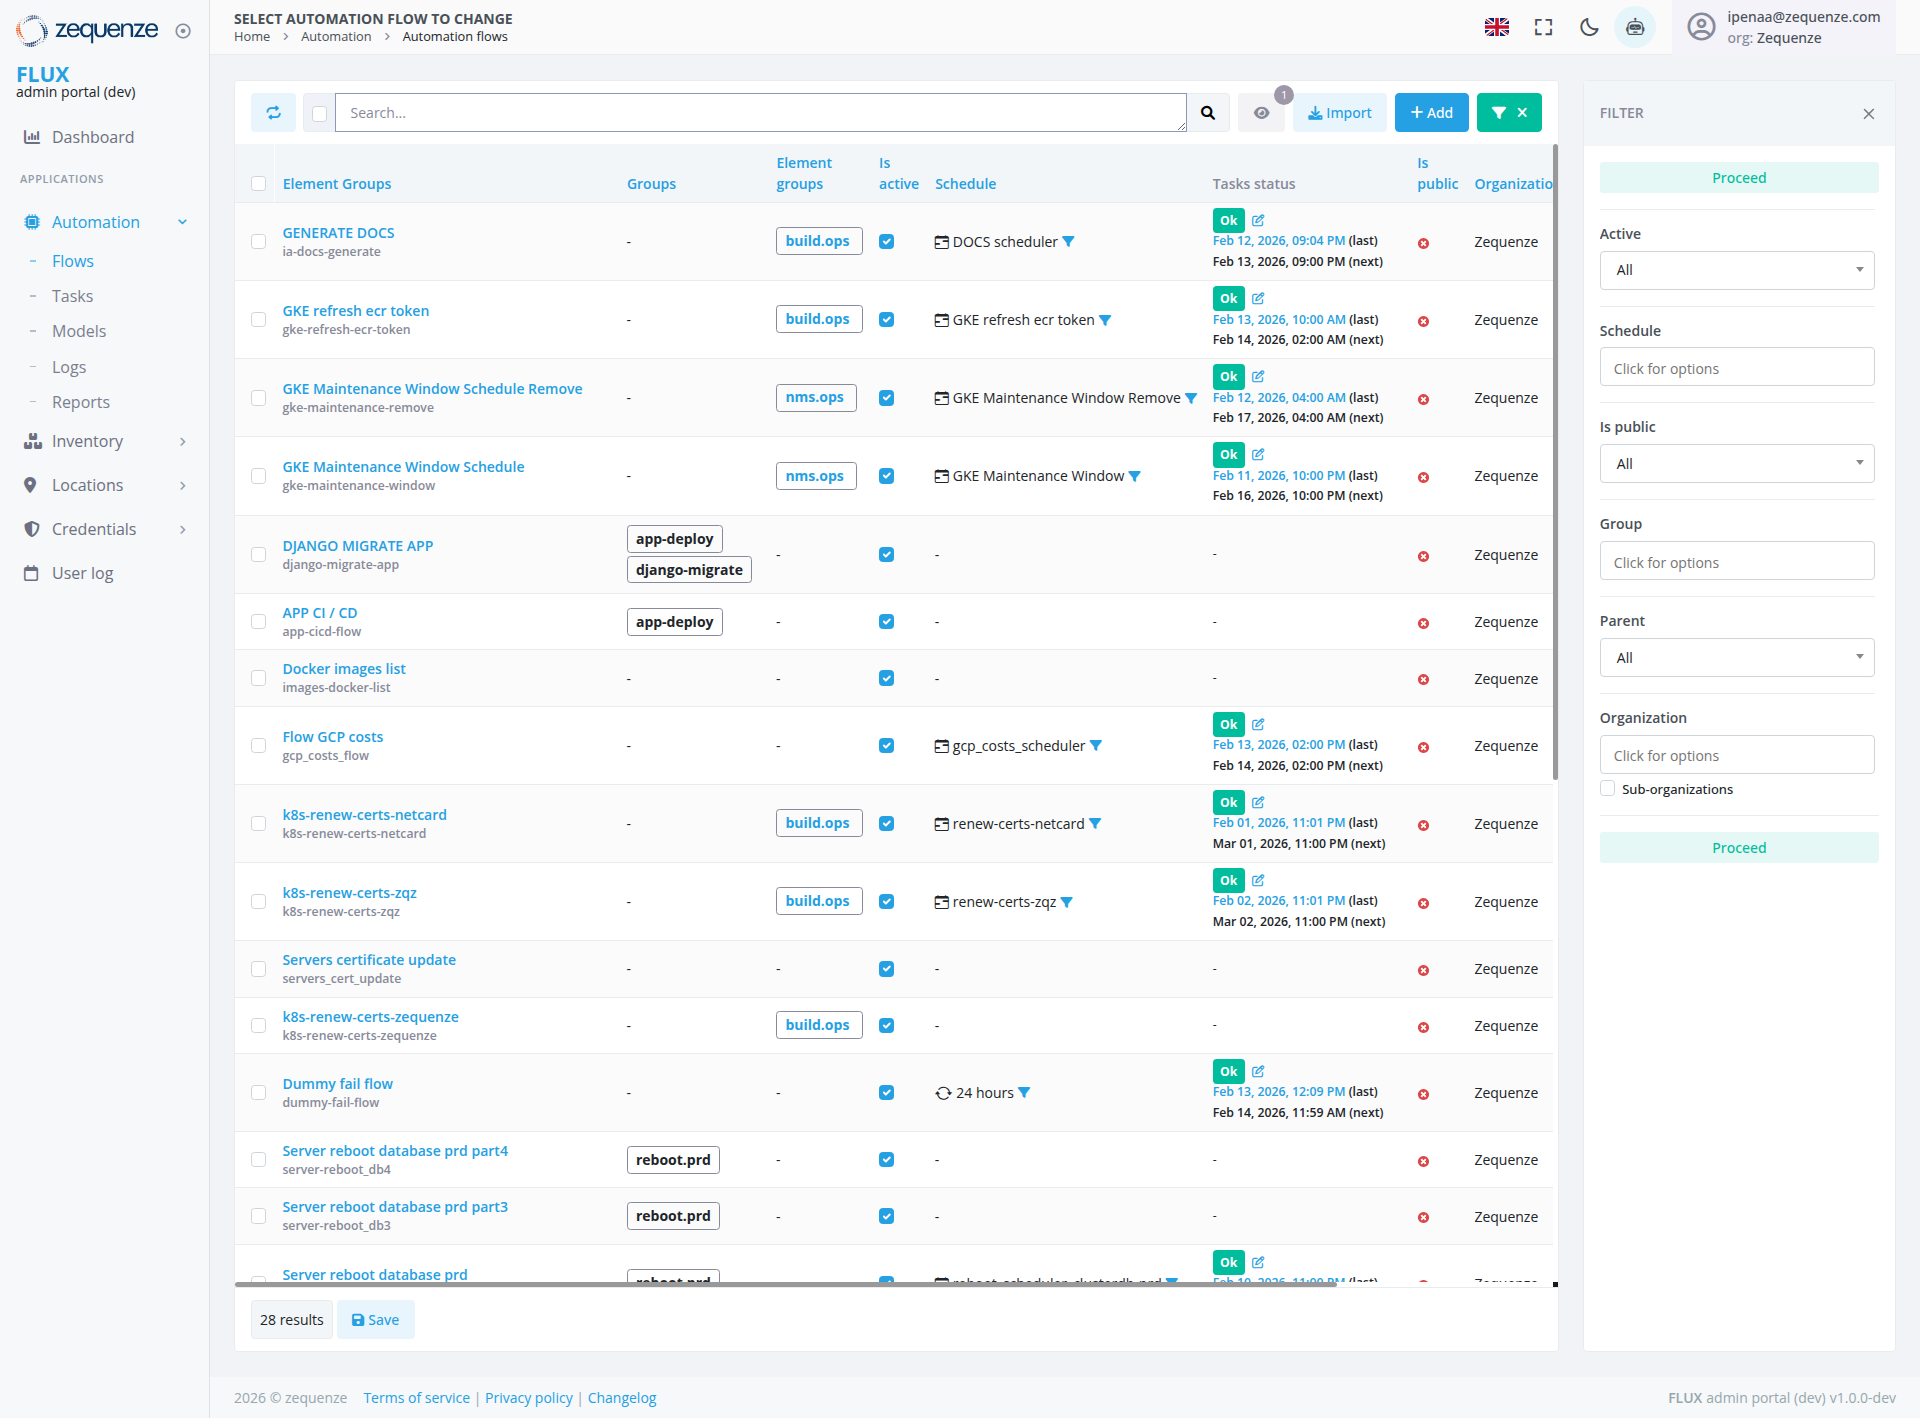
Flow Names: Descriptive names like "GENERATE DOCS", "GKE refresh ecr token", "GKE Maintenance Window Schedule Remove", "GKE Maintenance Window Schedule", "DJANGO MIGRATE APP", "APP CI / CD", "Docker images list", "Flow GCP costs", "k8s-renew-certs-netcard", "k8s-renew-certs-zqz", "Servers certificate update", "k8s-renew-certs-zequenze", "Dummy fail flow", "Server reboot database prd part4", "Server reboot database prd part3", "Server reboot database prd"
-
Descriptions: Technical identifiers (ia-docs-generate, gke-refresh-ecr-token, gke-maintenance-remove, gke-maintenance-window, django-migrate-app, app-cicd-flow, images-docker-list, gcp_costs_flow, k8s-renew-certs-netcard, k8s-renew-certs-zqz, servers_cert_update, k8s-renew-certs-
zequenze)zequenze, dummy-fail-flow, server-reboot_db4, server-reboot_db3)
-
Group Associations: Tags showing deployment groups, build operations, maintenance windows, NMS operations, and
NMSreboot operations
Status Indicators
-
Green "OK" with Edit Icon: Successful execution with timestamps showing both last and next scheduled runs (Feb-Mar 2026)
-
Red
IndicatorsCircle Icons: Failed or error states in the rightmost column
-
Blue Checkmarks: Active status indicators
-
Scheduler Tags: Blue tags with dropdown indicators showing scheduler associations (DOCS scheduler, GKE refresh ecr token, GKE Maintenance Window Remove, GKE Maintenance Window, gcp_costs_scheduler, renew-certs-netcard, renew-certs-
zqz)zqz, 24 hours, rebootschedulerdatabasepostgrescluster)
Execution Details
-
Last Execution: Recent timestamps from February-March 2026 showing "(last)" designation
-
Next Execution: Scheduled next run times showing "(next)" designation
-
Duration: Expected or actual execution durations displayed in the schedule column (e.g., "24 hours")
Actions Available
Primary Actions
Refresh: Update the flow list with latest information using the circular arrow icon
Select All: Bulk select flows using the checkbox in the table header
Search: Find specific flows using the search field and search button
View Options: Access view configuration via the eye icon (shows notification badge with 1 item)
Import: Bulk import automation flows from external sources
Add: Create new automation flows with the flow builder
ClearFilter FiltersToggle:
RemoveOpen/close allthe appliedfilter filterspanel using the green filter button with funnel icon and "X"
Proceed: Apply filtered results using the green "
X"Proceed" buttonbuttons in the filter panel
Edit: Modify existing flow configurations via edit icons in the status column
FilterIndividual Actions:
UseAccess flow-specific operations via red circle icons in the
filterrightmost panel on the right side to access all filtering optionscolumn
Secondary Actions
-
Save: Save current filter configurations (28 results Save
button)button at bottom)
-
RefreshBulk Operations: UpdatePerform theactions displayon withmultiple latestselected flow status informationflows
-
Filter Panel Management: Toggle the filter panel open/closed using the FILTER button with collapse arrow (×)
-
Export: Export flow configurations (implied functionality)
Filter Panel Options
Status Filters
-
Proceed: Top section with green "Proceed" button for
proceeding withapplying filtered results
-
Active: Dropdown filter currently set to "All" for active/inactive flows
-
Schedule: "Click for options" section for scheduling configuration
-
Is public: Dropdown filter currently set to "All" for visibility settings
Organizational Filters
-
Group: "Click for options" section for operational groups
-
Parent: Dropdown filter currently set to "All" for parent-child relationships
-
Organization: "Click for options" section with Sub-organizations checkbox option
-
Sub-organizations: Checkbox option to include or exclude sub-organizational flows
Additional Filtering
-
Proceed Section: Additional
filteringgreen options"Proceed" availablebutton in bothat the top and bottom sections of the filter panel for processing filtered results
Notes/Tips
Portal Context: This interface is part of the FLUX admin portal (dev environment) as shown in the left sidebar branding
Status Monitoring: Green "OK" indicators with edit icons show successful recent executions with February-March 2026 timestamps, while red
circle indicators
in the rightmost column require attention
Scheduling: Scheduler tags with dropdown indicators show automated scheduling with specific scheduler
assignmentsassignments, including duration-based schedules (e.g., "24 hours")
Group Tags: Colored tags help quickly identify flow purposes (app-deploy, build.ops, nms.
ops)ops, reboot.prd)
Real-time Updates: The page shows live status updates with precise timestamps for monitoring active operations, displaying both last execution and next scheduled execution times
Filter Management: Use the green
"X"filter toggle button to quickly
clearmanage all applied filters and
return to the full view
Filter Panel Management: Use the FILTER button to toggle the filter panel
open/closedvisibility
for
easierBulk accessOperations: Select multiple flows using checkboxes to
filteringperform batch operations efficiently
View Customization: The eye icon with notification badge indicates available view configuration options
Organization Scope: Flows are scoped to your organizational access level (currently showing Zequenze organization)
Advanced Filtering: Use the "Click for options" sections in the filter panel to access detailed filtering criteria
Dual Proceed SectionsButtons: The filter panel includes
Proceedgreen sections"Proceed" buttons at both the top and bottom for convenient access to result processing options
Scheduler Integration: Blue scheduler tags with dropdown indicators indicate integration with various automated scheduling systems for different operational
taskstasks, including time-based schedules
Individual Row Management: Each flow can be managed individually through its row interface, including edit icons in the status
column and action icons in the rightmost column
Execution Timeline: The Tasks status column clearly distinguishes between last execution time and next scheduled execution time with "(last)" and "(next)" labels
Multiple Server Operations: The interface displays multiple related flows (e.g., server reboot database operations split into parts) for managing complex multi-step processes