Automation flows
Overview
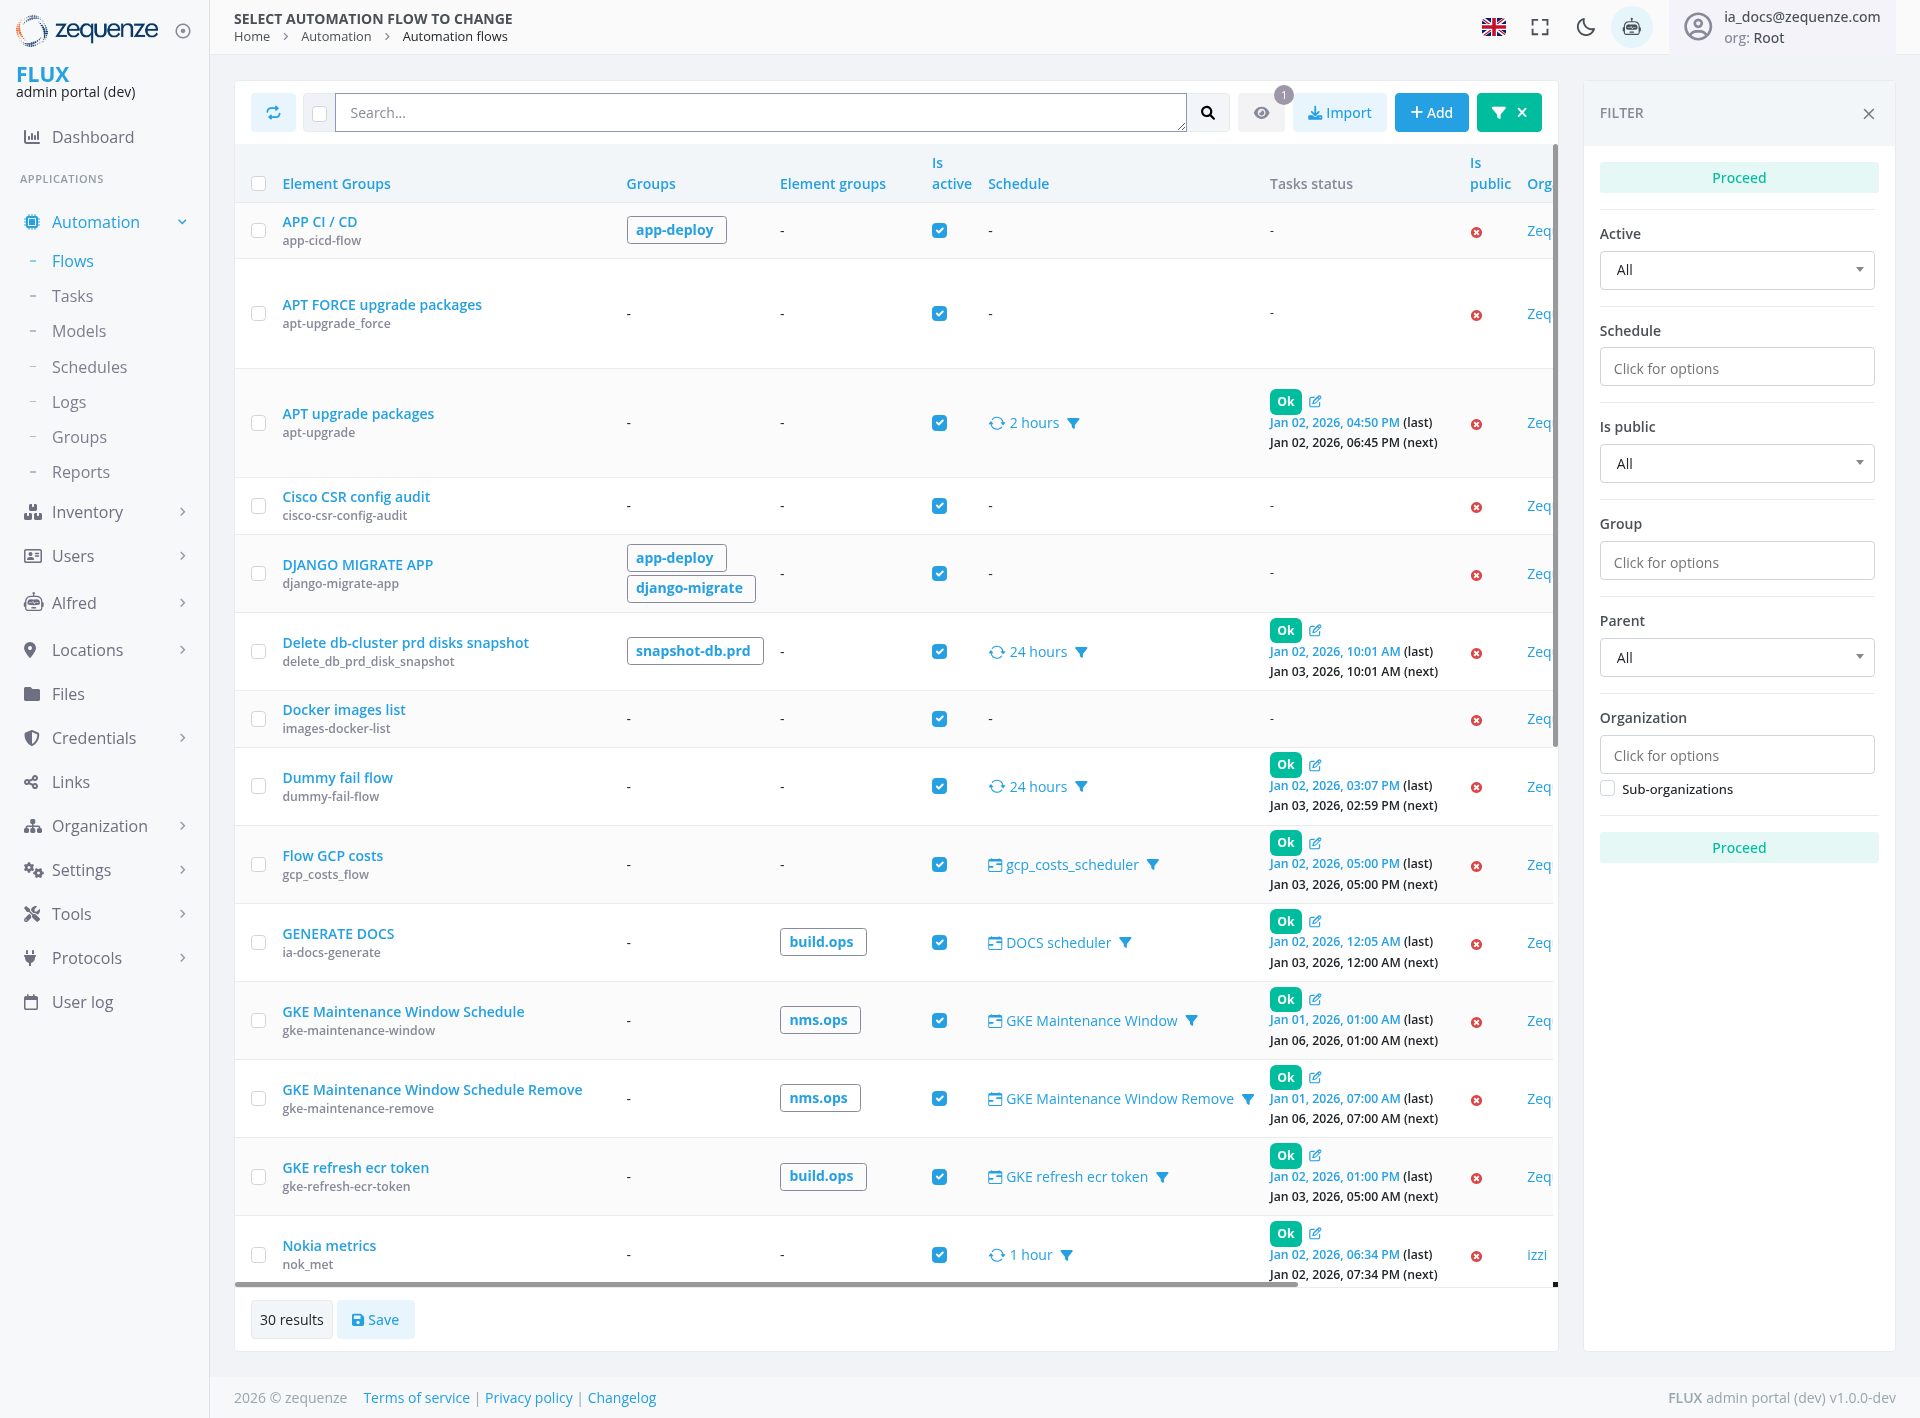
The Automation Flows page in the Zequenze Control Portal provides a comprehensive management interface for viewing, monitoring, and controlling automated workflows. This page displays all automation flows configured in the system with their current status, scheduling information, and execution details.
Key Features
- Flow Management Dashboard: Centralized view of all automation flows with real-time status monitoring
- Advanced Filtering: Multiple filter options including status, schedule, visibility, group, parent, and organization
- Bulk Operations: Import and add multiple flows with dedicated action buttons
- Status Tracking: Real-time status indicators (OK, Active, Failed) with timestamp information
- Scheduling Overview: Visual representation of flow schedules and execution times
- Group Organization: Flows organized by element groups and operational groups
UI Elements
Header Section
Action Bar
- Search Field: Global search functionality for filtering flows
- Import Button: Blue button for importing automation flows
- Add Button: Green button with plus icon for creating new automation flows
- Filter Panel Toggle: "FILTER" button to open/close the filter panel on the right side
Filter Panel
The right-side filter panel displays the following filter options:
- Proceed: Top section for proceeding with filtered results
- Active: Dropdown filter with "All" selected for active/inactive flows
- Schedule: "Click for options" section for scheduling configuration
- Is public: Dropdown filter with "All" selected for visibility settings
- Group: "Click for options" section for operational groups
- Parent: Dropdown filter with "All" selected for parent-child relationships
- Organization: "Click for options" section with Sub-organizations option
- Proceed: Bottom section for additional proceed options
Main Data Table
The table displays the following columns:
- Element Groups: Shows the automation flow names and descriptions
- Groups: Associated group tags (app-deploy, django-migrate, snapshot-db-prd, nms.ops, build.ops, etc.)
- Element groups: Related element groupings
- Is active: Checkbox indicators for active/inactive status
- Schedule: Time-based scheduling information with duration indicators and scheduler tags
- Tasks status: Current execution status with OK/Failed indicators and timestamps
- Is public: Visibility settings
- Organization: Organizational assignment (Zero references throughout)
User Interactions
Navigation
Search and Filter
- Global Search: Use the search bar to find specific flows by name or description
- Filter Panel: Click the "FILTER" button to open/close the filter panel on the right side
- Proceed Section: Access filtering options in both the top and bottom Proceed sections
- Active Filter: Use the dropdown filter (currently set to "All") to filter by Active/Inactive status
- Schedule Filter: Click "Click for options" to access scheduling filters
- Is public Filter: Use the dropdown (currently set to "All") to filter by visibility settings
- Group Filter: Click "Click for options" to filter by operational groups
- Parent Filter: Use the dropdown (currently set to "All") to filter by parent-child relationships
- Organization Filter: Click "Click for options" to access organizational filtering with sub-organization options
Flow Management Actions
- View Details: Click on any flow name to view detailed configuration
- Status Monitoring: Monitor real-time status indicators and timestamps
- Import Flows: Use the Import button to bulk import automation configurations
- Add New Flow: Use the Add button to create new automation workflows
- Filter Management: Use the filter panel to apply multiple filter criteria simultaneously
Data Displayed
Flow Information
- Flow Names: Descriptive names like "APP CI / CD", "APT FORCE upgrade packages", "DJANGO MIGRATE APP", "Delete db-cluster prd disks snapshot", "GENERATE DOCS", "GKE Maintenance Window Schedule"
- Descriptions: Technical identifiers (app-cicd-flow, apt-upgrade-force, django-migrate-app, cisco-csr-config-audit, ia-docs-generate, etc.)
- Group Associations: Tags showing deployment groups, build operations, maintenance windows, snapshot operations, and NMS operations
Status Indicators
- Green "OK": Successful execution with timestamps showing recent runs (Jan 01-06, 2026)
- Red Indicators: Failed or error states
- Blue Checkmarks: Active status indicators
- Scheduler Tags: Blue tags indicating scheduler associations (gcp_costs_scheduler, DOCS scheduler, GKE Maintenance Window, GKE refresh ecr token)
Execution Details
- Last Execution: Recent timestamps from January 2026 showing active system usage
- Next Execution: Scheduled next run times
- Duration: Expected or actual execution durations (1 hour, 2 hours, 24 hours)
Actions Available
Primary Actions
- Import: Bulk import automation flows from external sources
- Add: Create new automation flows with the flow builder
- Edit: Modify existing flow configurations (via flow name links)
- Filter: Use the filter panel on the right side to access all filtering options
Secondary Actions
- Save: Save current filter configurations (30 results Save button)
- Refresh: Update the display with latest flow status information
- Filter Panel Management: Toggle the filter panel open/closed using the FILTER button
- Export: Export flow configurations (implied functionality)
Filter Panel Options
Status Filters
- Proceed: Top section for proceeding with filtered results
- Active: Dropdown filter currently set to "All" for active/inactive flows
- Schedule: "Click for options" section for scheduling configuration
- Is public: Dropdown filter currently set to "All" for visibility settings
Organizational Filters
- Group: "Click for options" section for operational groups
- Parent: Dropdown filter currently set to "All" for parent-child relationships
- Organization: "Click for options" section with Sub-organizations option
- Sub-organizations: Option to include or exclude sub-organizational flows
Additional Filtering
- Proceed Section: Additional filtering options available in both the top and bottom sections of the filter panel
Notes/Tips
- Status Monitoring: Green "OK" indicators show successful recent executions with January 2026 timestamps, while red indicators require attention
- Scheduling: Clock icons and scheduler tags indicate automated scheduling with specific scheduler assignments
- Group Tags: Colored tags help quickly identify flow purposes (app-deploy, snapshot-db-prd, build.ops, nms.ops)
- Real-time Updates: The page shows live status updates with precise timestamps for monitoring active operations
- Filter Panel Management: Use the FILTER button to toggle the filter panel open/closed for easier access to filtering options
- Organization Scope: Flows are scoped to your organizational access level (currently showing Root access)
- Advanced Filtering: Use the "Click for options" sections in the filter panel to access detailed filtering criteria
- Dual Proceed Sections: The filter panel includes Proceed sections at both the top and bottom for convenient access to result processing options
- Scheduler Integration: Blue scheduler tags indicate integration with various automated scheduling systems for different operational tasks
- Individual Row Management: Each flow can be managed individually through its row interface without bulk operations