Automation flows
Generating documentation...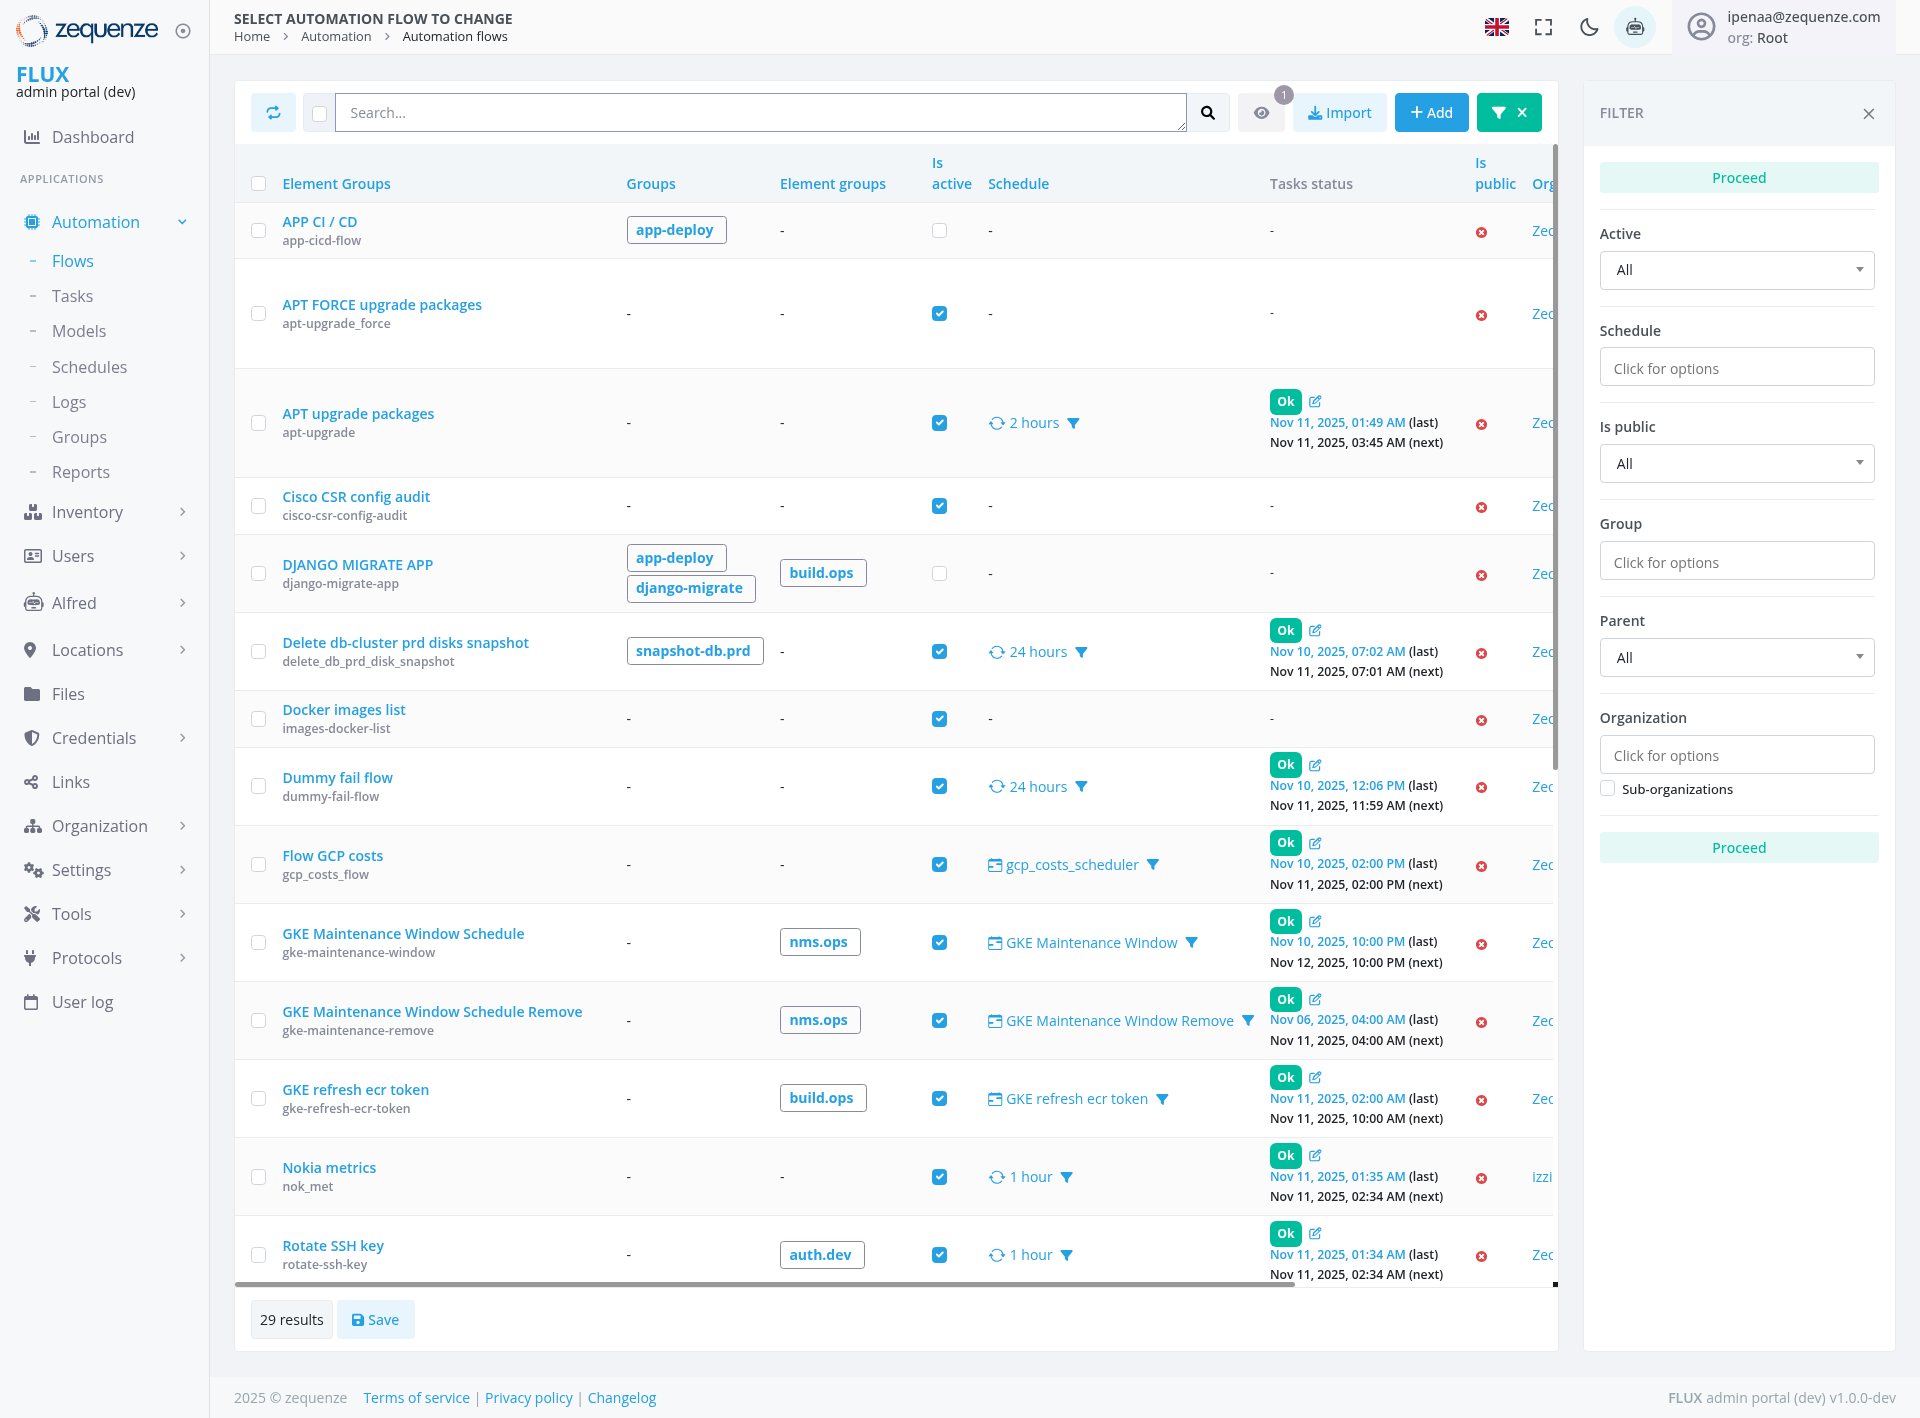
Overview
The Automation Flows page in the Zequenze Control Portal provides a comprehensive management interface for viewing, monitoring, and controlling automated workflows. This page displays all automation flows configured in the system with their current status, scheduling information, and execution details.
Key Features
Flow Management Dashboard: Centralized view of all automation flows with real-time status monitoring
Advanced Filtering: Multiple filter options including status, schedule, visibility, group, parent, and organization
Bulk Operations: Import and add multiple flows with dedicated action buttons
Status Tracking: Real-time status indicators (OK, Active, Failed) with timestamp information
Scheduling Overview: Visual representation of flow schedules and execution times
Group Organization: Flows organized by element groups and operational groups
UI Elements
Breadcrumb Navigation: Home > Automation > Automation flows
Page Title: "SELECT AUTOMATION FLOW TO CHANGE"
User Account: Displays logged-in user (jpenas@zequenze.com) with Root organization access
Action Bar
Search Field: Global search functionality for filtering flows
Import Button: Blue button for importing automation flows
Add Button: Green button for creating new automation flows
Filter Panel: Expandable right-side panel with multiple filter options
Main Data Table
The table displays the following columns:
Element Groups: Shows the automation flow names and descriptions
Groups: Associated group tags (app-deploy, django-migrate, etc.)
Element groups: Related element groupings
Is active: Checkbox indicators for active/inactive status
Schedule: Time-based scheduling information with duration indicators
Tasks status: Current execution status with OK/Failed indicators and timestamps
Is public: Visibility settings
Organization: Organizational assignment (Zec, tzzj, etc.)
User Interactions
Navigation
Access via main navigation: Automation > Flows
Use breadcrumb navigation to return to higher-level pages
Navigate using the left sidebar menu under "APPLICATIONS"
Search and Filter
Global Search: Use the search bar to find specific flows by name or description
Status Filter: Filter by Active/Inactive status
Schedule Filter: View flows by their scheduling configuration
Organization Filter: Filter flows by organizational assignment
Group Filter: Filter by associated groups or parent relationships
Flow Management Actions
View Details: Click on any flow name to view detailed configuration
Status Monitoring: Monitor real-time status indicators and timestamps
Import Flows: Use the Import button to bulk import automation configurations
Add New Flow: Use the Add button to create new automation workflows
Data Displayed
Flow Names: Descriptive names like "APT FORCE upgrade packages", "DJANGO MIGRATE APP"
Descriptions: Technical identifiers (app-cicd-flow, apt-upgrade-force, etc.)
Group Associations: Tags showing deployment groups, build operations, maintenance windows
Status Indicators
Green "OK": Successful execution with timestamps
Red Indicators: Failed or error states
Blue Checkmarks: Active status indicators
Clock Icons: Scheduled execution times (1 hour, 2 hours, 24 hours)
Execution Details
Last Execution: Timestamps showing when flows last ran
Next Execution: Scheduled next run times
Duration: Expected or actual execution durations
Actions Available
Primary Actions
Import: Bulk import automation flows from external sources
Add: Create new automation flows with the flow builder
Edit: Modify existing flow configurations (via flow name links)
Filter: Apply multiple filter criteria to narrow down the view
Secondary Actions
Save: Save current filter configurations (29 results Save button)
Refresh: Update the display with latest flow status information
Export: Export flow configurations (implied functionality)
Filter Panel Options
Status Filters
Active: Filter by active/inactive flows
Schedule: Filter by scheduling configuration
Is public: Filter by visibility settings
Organizational Filters
Group: Filter by operational groups
Parent: Filter by parent-child relationships
Organization: Filter by organizational boundaries
Sub-organizations: Include or exclude sub-organizational flows
Notes/Tips
Status Monitoring: Green "OK" indicators show successful recent executions, while red indicators require attention
Scheduling: Clock icons indicate automated scheduling - hover for detailed timing information
Group Tags: Colored tags help quickly identify flow purposes (deployment, migration, maintenance)
Real-time Updates: The page shows live status updates with precise timestamps for monitoring active operations
Bulk Management: Use filters to select multiple flows for bulk operations
Organization Scope: Flows are scoped to your organizational access level (currently showing Root access)