Knowledge Basic
Logging into the Platform
The first step to access CONTROL is to receive an invitation email. This email contains a link that allows you to set your password for future access to the platform.
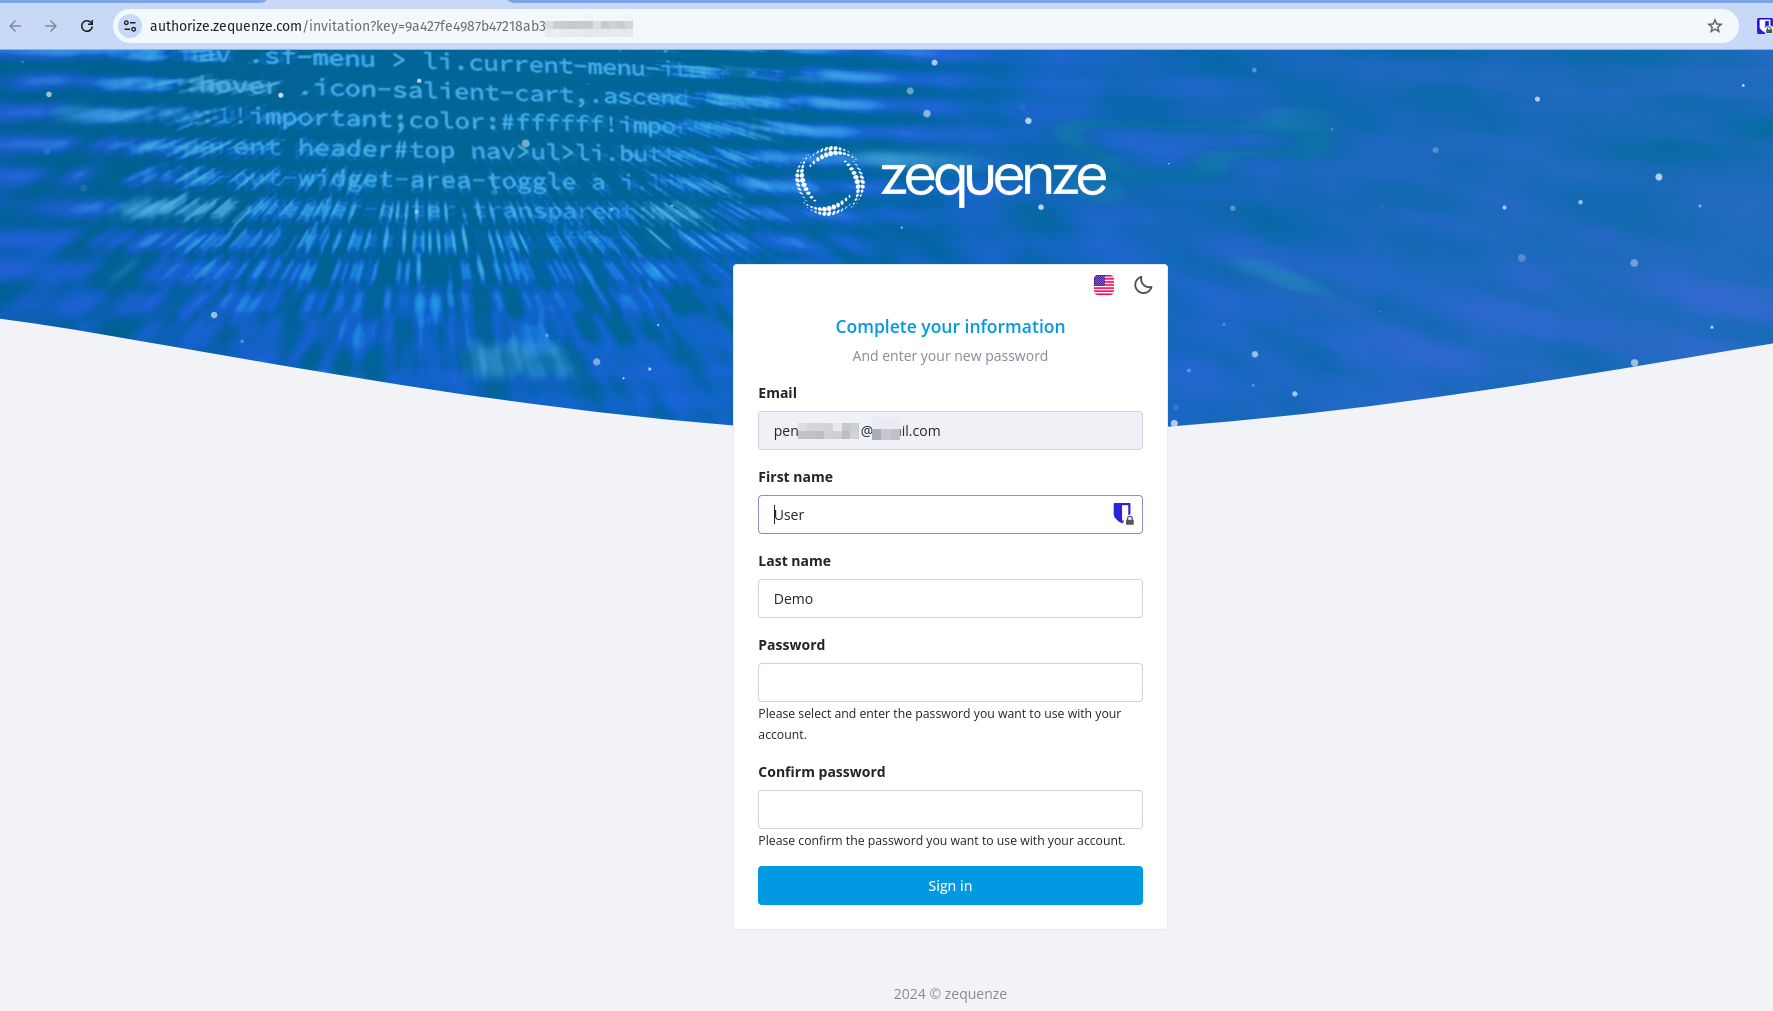
After receiving the invitation, click the link to set up your password. You will see a page similar to this example:
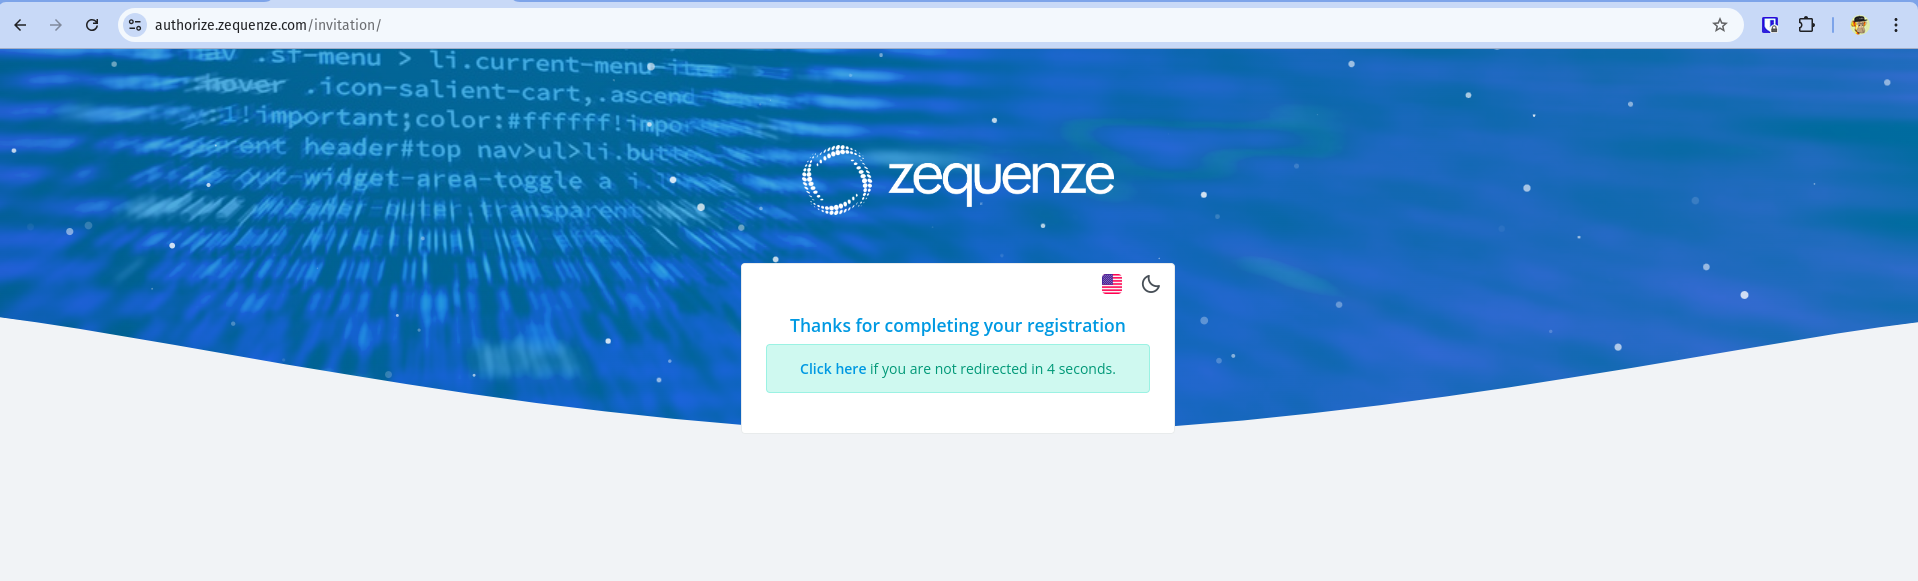
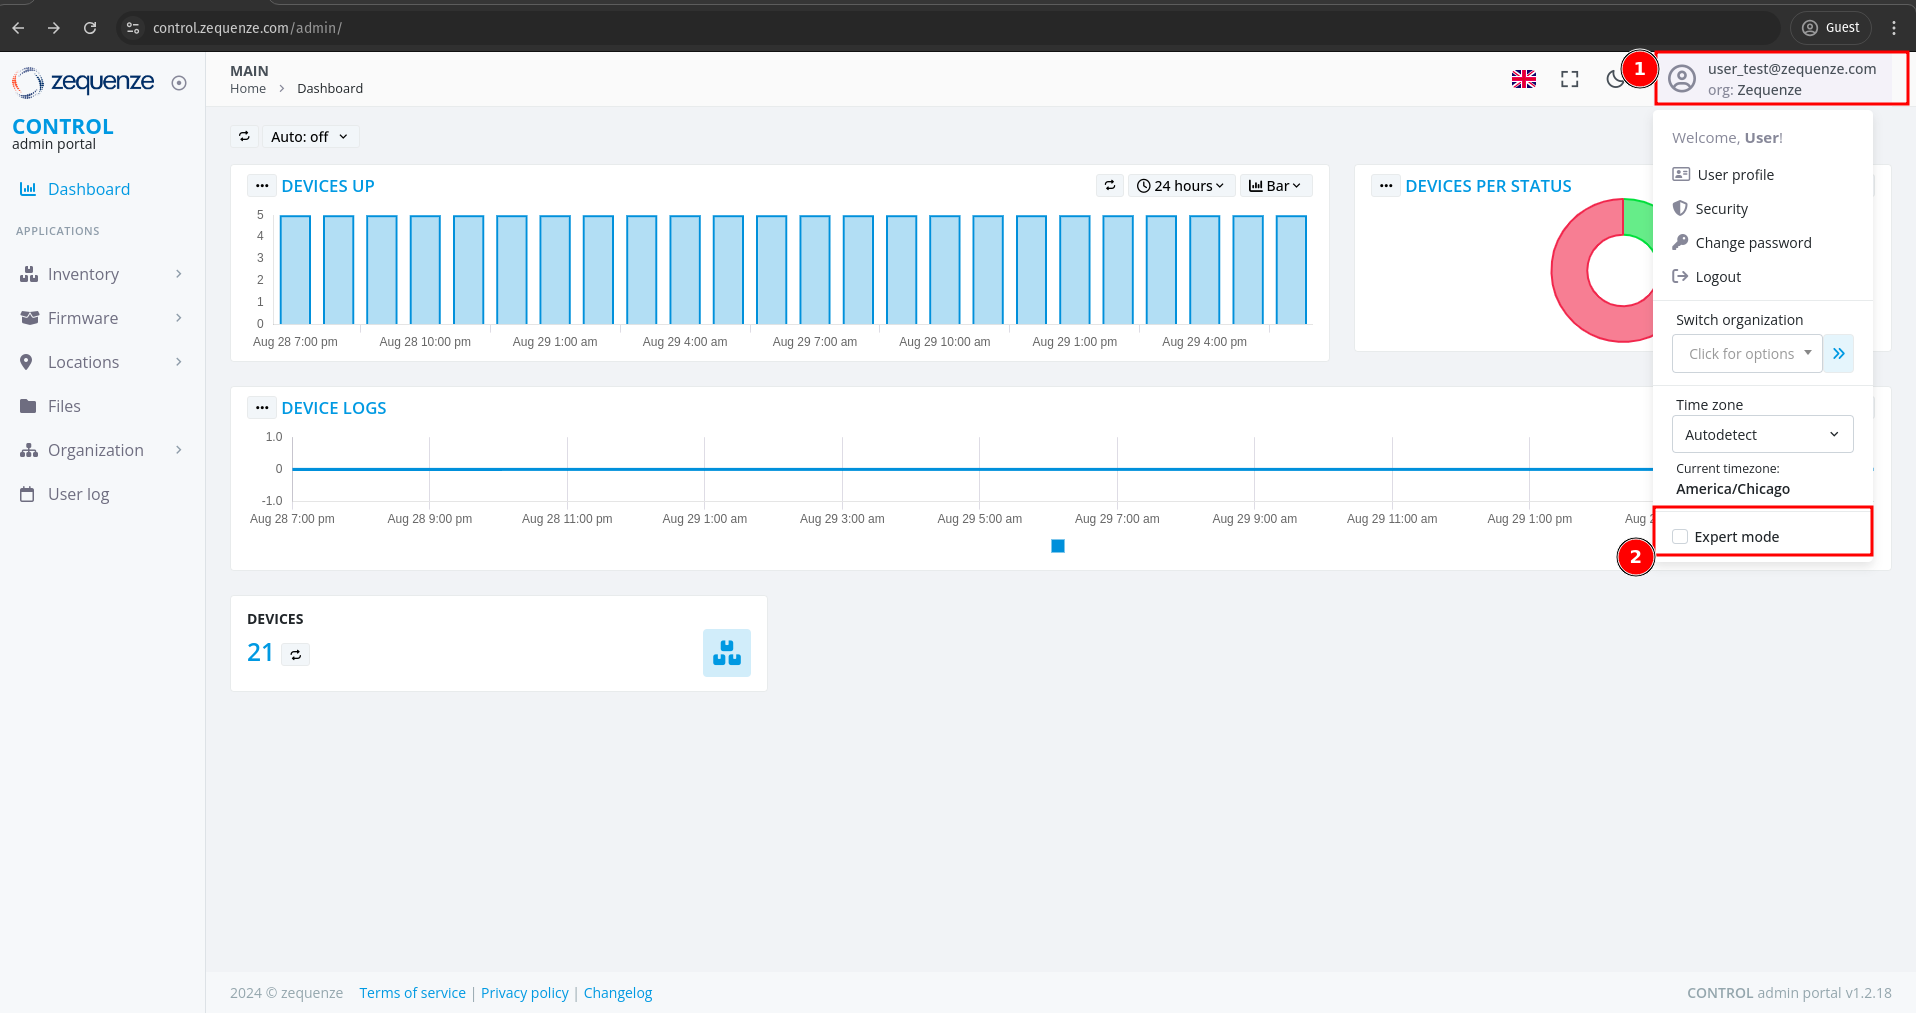
Once the process is complete, you will be redirected to the CONTROL platform:
Understanding the CONTROL Interface
Now that you're logged into the CONTROL platform, let's explore the available options:
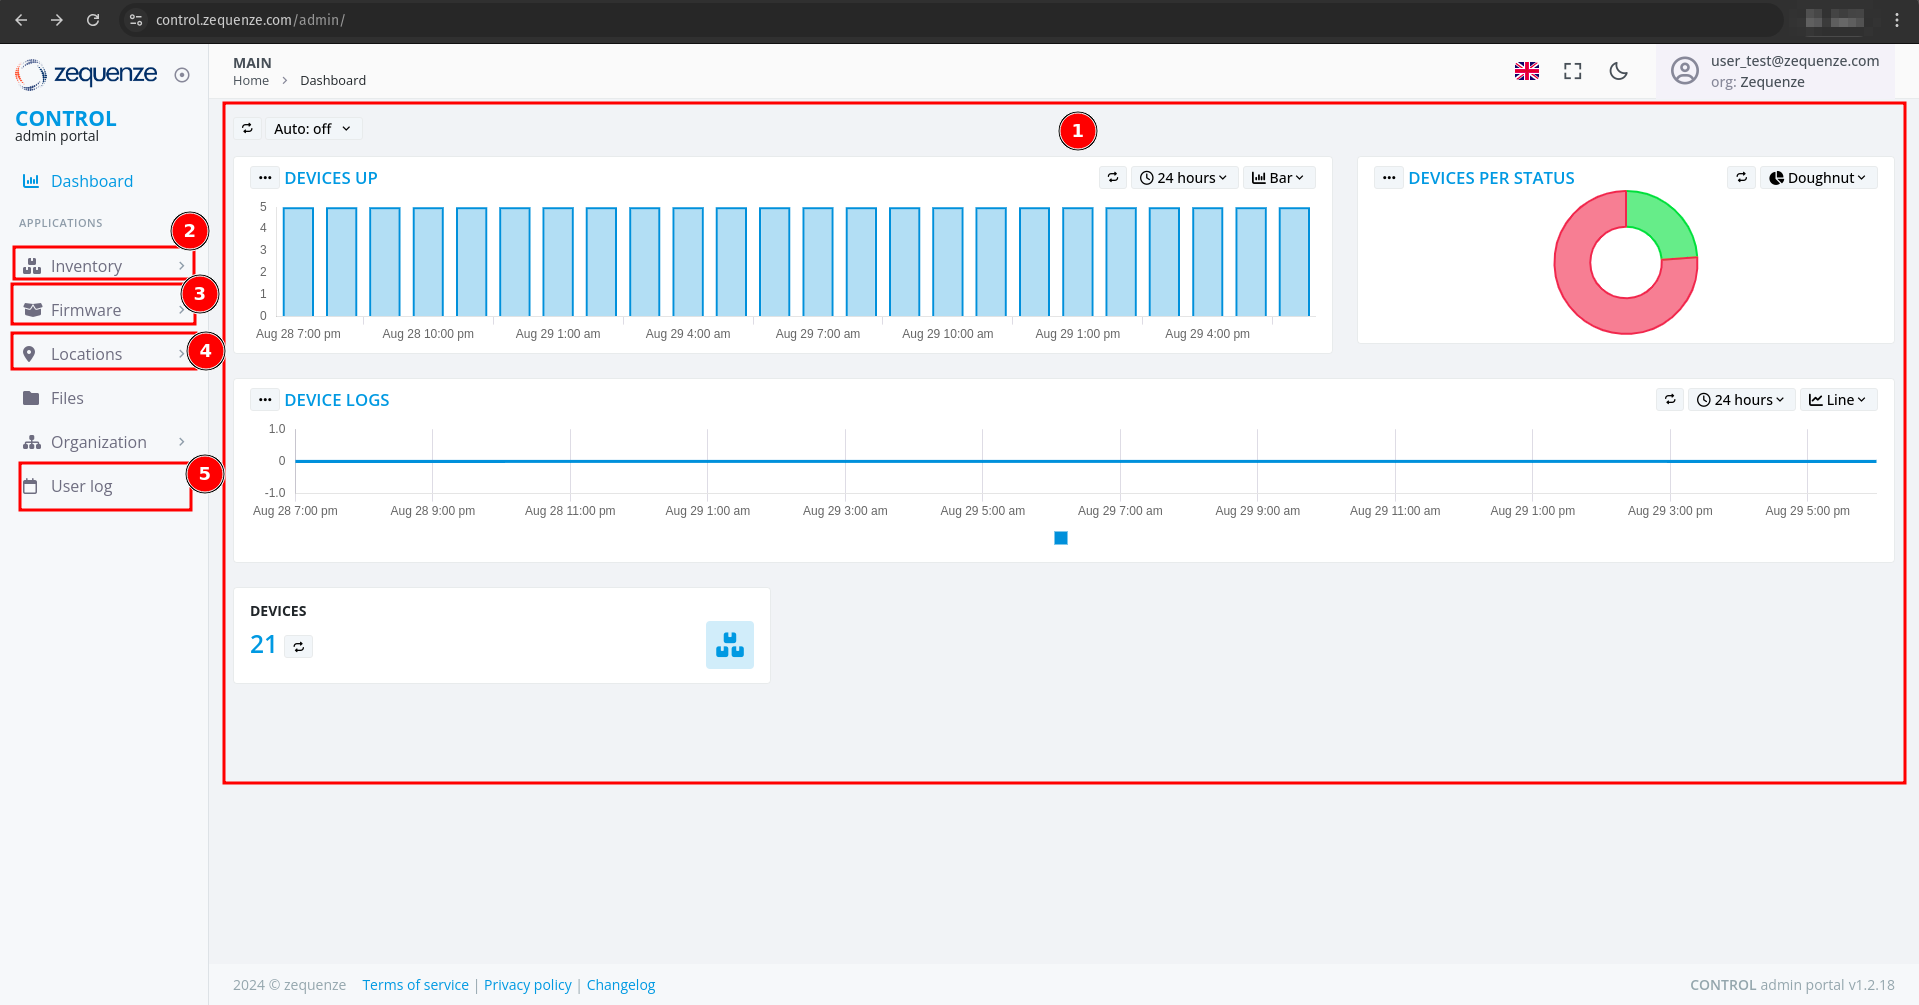
Main Dashboard
In the center of the screen, you'll find a series of customizable reports in the Main Dashboard. These reports include:
- Devices UP - Shows currently active devices
- Devices Per Status - Displays device status distribution
- Devices Logs - Provides access to device log information
Navigation Menu
-
Inventory - View devices, create configurations, and add parameters for each profile
-
Firmware - Upload different firmware versions for upgrades or downgrades, and customize firmware update workflows
-
Locations - Create and manage physical locations using:
- Geo-localization with coordinates
- Custom labels to identify device groups
- Organization by OLT or DOCSIS CMTS connections
-
User Log - View all transactions and changes made within the platform
Enabling Expert Mode
To access advanced features, you need to activate Expert Mode:
- Check the Expert mode checkbox
- Refresh the webpage by pressing F5 or using your browser's refresh button
This completes the basic overview of the CONTROL platform. The next step is to create a Profile.