Device logs
Overview
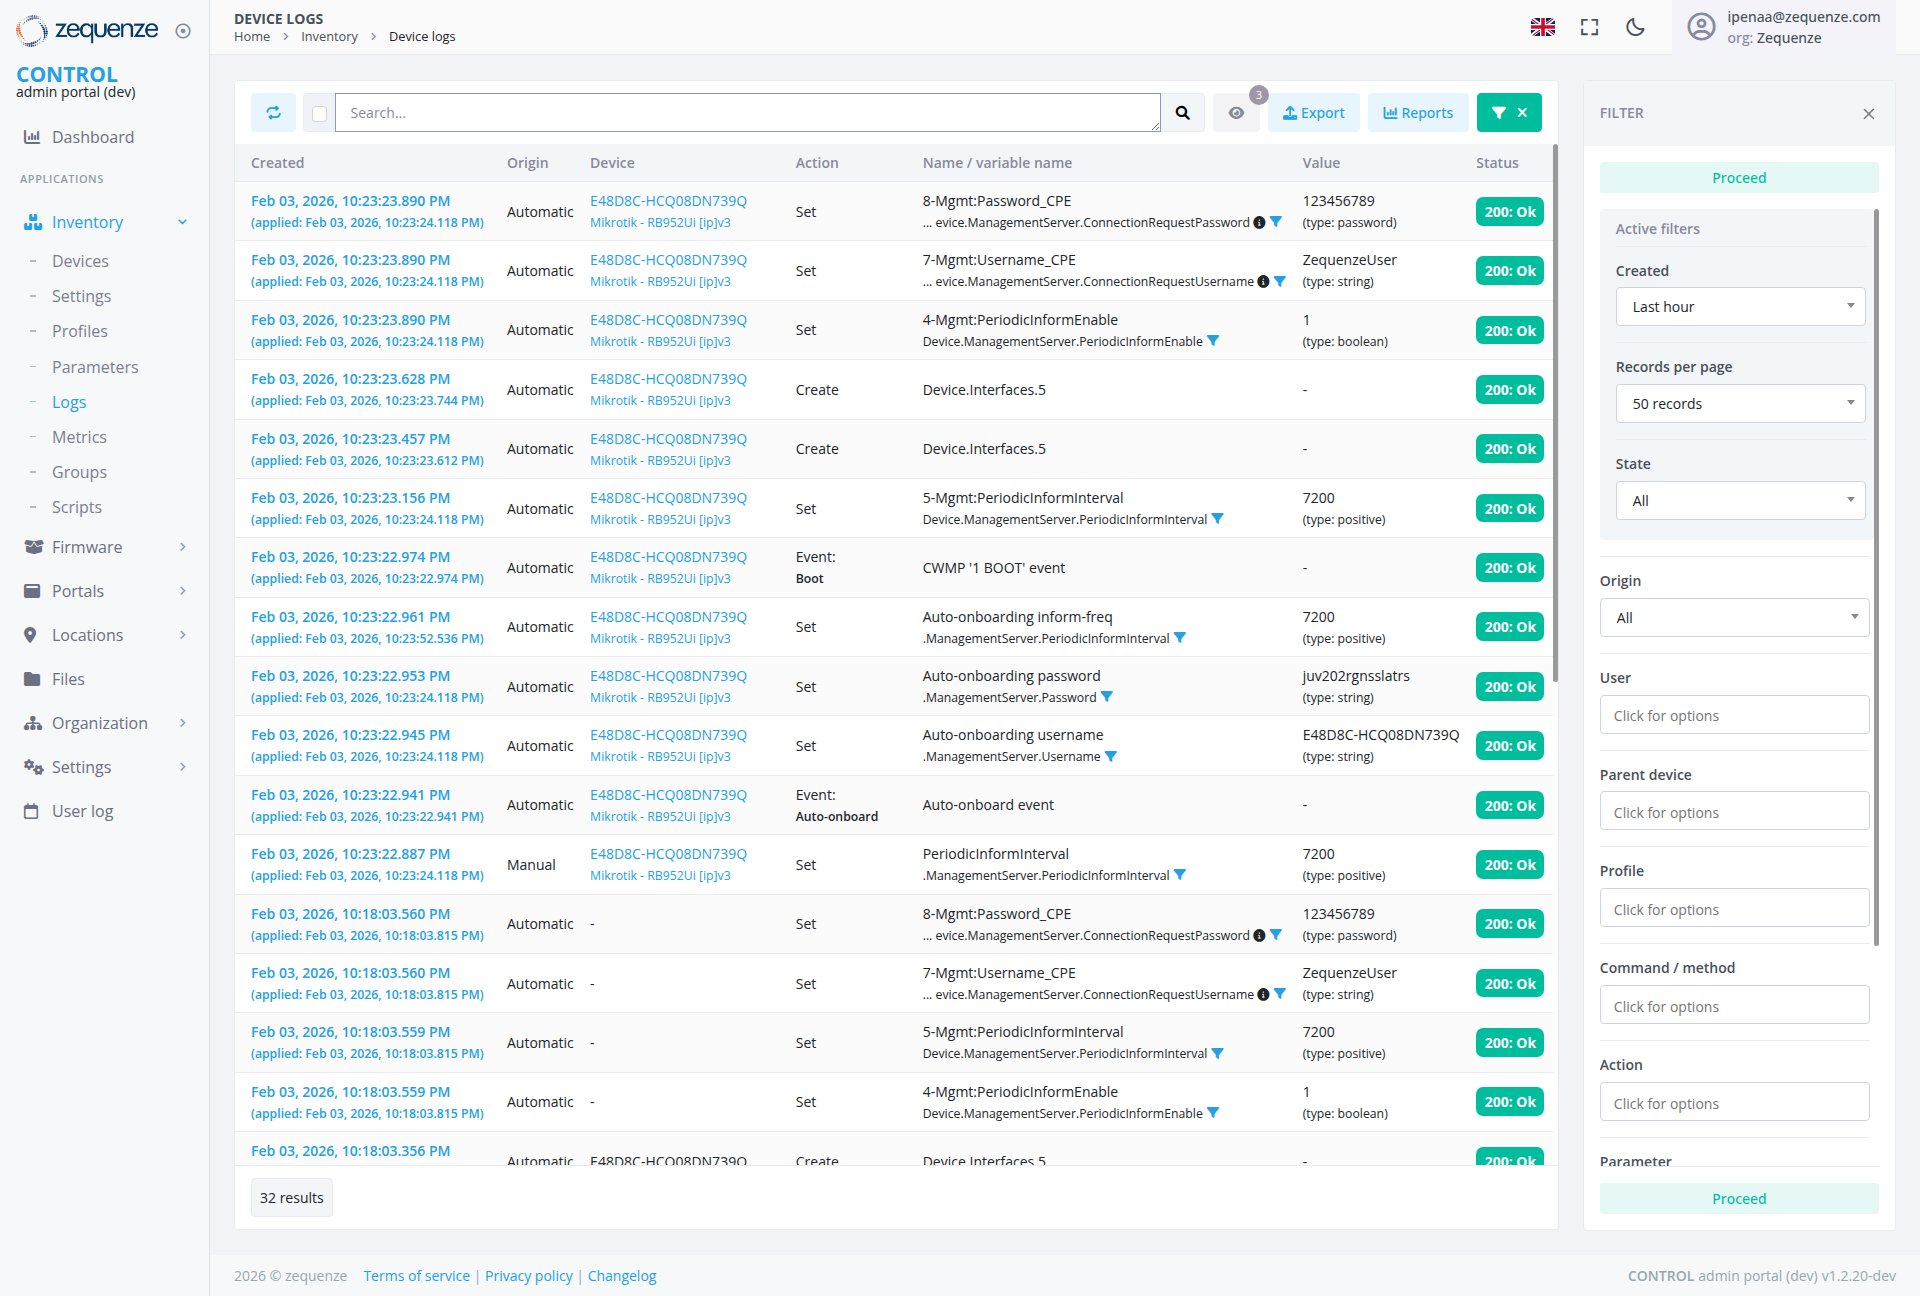
The Device Logs section of the Zequenze Control Portal provides a comprehensive view of all device activity and configuration changes. This page displays real-time and historical log entries for network devices, allowing administrators to monitor device events, track configuration modifications, and troubleshoot network issues.
Key Features
- Real-time Log Monitoring: View live device events and configuration changes as they occur
- Comprehensive Search: Advanced search functionality to filter logs by various criteria
- Export Capabilities: Export log data for external analysis and reporting
- Reports Generation: Generate custom reports from filtered log data
-
Detailed Event Information: Access to complete event details including timestamps, origins, and affected parameters
UI Elements
Header Section
- Search Bar: Located at the top center for quick log entry searches
Main Data Table
The central table displays log entries with the following columns:
- Created: Timestamp of when the event occurred
- Origin: Source of the event (e.g., "Automatic")
- Device: Device identifier or name
- Action: Type of action performed (e.g., "Set", "Create", "Event: Boot", etc.)
- Name/Variable Name: Specific parameter or event name affected
- Value: Current or new value of the parameter
-
Status: Overall status indicator
with green "200: Ok" badges displayed
Current Data Display
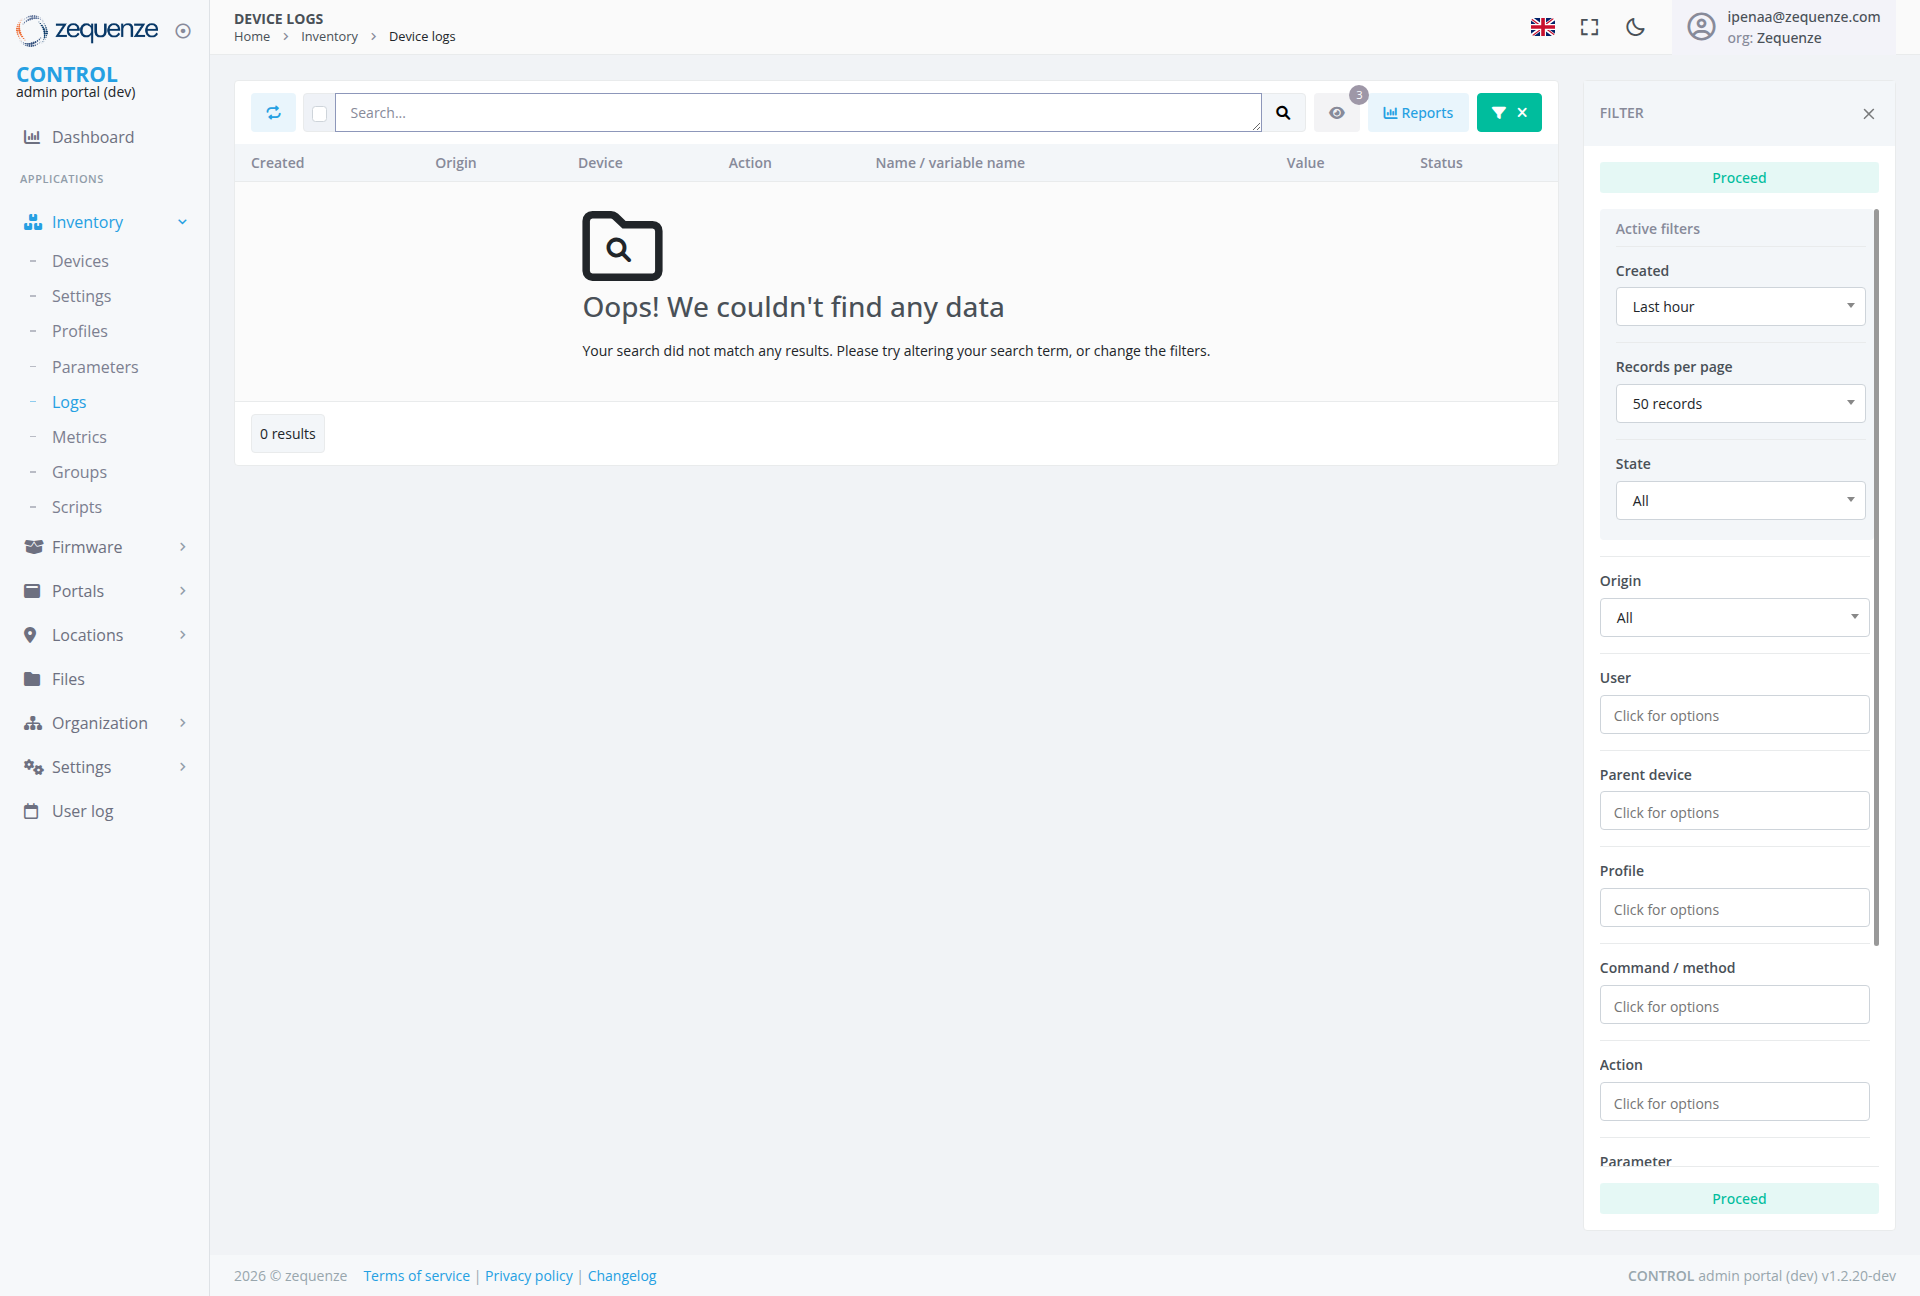
The page currently shows multipleno logsearch entriesresults with actuala device"No dataData" fromstate February 3, 2026:displaying:
-
ConfigurationSearchEventsIcon:MultipleLarge"Set"magnifyingactionsglassforicondeviceindicatingmanagementsearchparameters including password, username, and periodic settingsfunctionality -
CreateNoEventsData Message:Device"Oops!interfaceWecreationcouldn'teventsfind any data" prominently displayed -
BootHelpfulEventsText:CWMP"Your'1searchBOOT'dideventsnotformatchdeviceanystartupresults.monitoring
Filter Panel (Right Side)
The expandable filter panel is currently open and displays comprehensive filtering options:
- Panel State: Currently expanded, showing all available filter options
- Toggle Control: Green filter button with X close option for showing/hiding the panel
- Active Filter Section: "Proceed" filter is currently active and highlighted in green
-
Filter Options (currently visible):
- Created: Time-based filtering with "Last hour" dropdown selection
- Records per page: Currently set to "50 records"
- State: Dropdown with "All" selected
- Origin: Dropdown with "All" selected
- User: "Click for options" field
- Parent device: "Click for options" field
- Profile: "Click for options" field
- Command / method: "Click for options" field
- Action: "Click for options" field
- Parameter: Section with green "Proceed" active filter button
User Interactions
Searching and Filtering
- Quick Search: Enter search terms in the top search bar and click the search icon
- Filter Panel Access: Click the green "FILTER" button to expand the advanced filtering options
- Advanced Filtering: Use the expandable filter panel on the right with multiple filtering options including time-based, state, origin, and parameter filters
- Panel Management: Use the X button to close the filter panel when not needed
- Active Filter Management: Use the green "Proceed" button to apply or manage active parameter filters
- Dropdown Interactions: Click on dropdown menus for Created, State, and Origin filters to select specific options
- Expandable Options: Click on "Click for options" fields to access additional filtering criteria
Data Management
-
Export Data: Use the blue "Export" button to export current log data
Event Analysis
-
EventSearchDetailsRefinement:ViewWhendetailedencounteringinformationnoinresults,themodifytablesearchcolumnstermsincludingordeviceadjustidentifiers,filterstimestamps,asand actionssuggested -
StatusFilterMonitoringAdjustment:MonitorUsestatusvariousindicatorsfilterwithoptionsconsistenttogreenexpand"200:orOk"narrowbadges
Navigation
Access Path
Related Sections
- Dashboard: Return to main dashboard for overview
- Inventory: Access device inventory and management
- Settings: Configure logging preferences and parameters
Data Displayed
No Results State
When no data matches the current search and filter criteria, the system displays:
Event Types (When Data Available)
- Configuration Events: Device parameter setting and management operations
- Creation Events: Device interface and component creation events
- Boot Events: CWMP '1 BOOT' events for device startup monitoring
- Auto-onboarding Events: Automated device provisioning and configuration events
- Management Events: Device management server configuration activities
Information Categories
Actions Available
Primary Actions
- Search: Filter and locate specific log entries
Filtering Actions
- Panel Toggle: Click the green "FILTER" button to expand/collapse filtering options
- Time Filtering: Use "Created" dropdown to filter by time periods (Last hour, etc.)
- Records Control: Adjust "Records per page" to control data display (currently 50 records)
- State Filtering: Filter by device operational state using the State dropdown
- Origin Filtering: Filter by event source or origin using the Origin dropdown
- User-based Filtering: Access user filtering options by clicking "Click for options" in the User field
- Parent Device Filtering: Access parent device filtering by clicking "Click for options"
- Profile Filtering: Access profile filtering by clicking "Click for options"
- Command/Method Filtering: Access command/method filtering by clicking "Click for options"
- Action Filtering: Access action filtering by clicking "Click for options"
- Parameter Filtering: Advanced parameter-based filtering with green "Proceed" button for active filters
- Active Filter Management: Use the green "Proceed" button to manage currently applied parameter filters
AdministrativeSearch FunctionsOptimization Actions
-
EventSearchTrackingTerm Modification:MonitorAlterdevicesearchbehaviortermsandwhenperformance
Notes/Tips
-
Real-timeNoUpdatesResults Guidance:TheWhenlognoviewdataupdatesisautomaticallyfound, the system provides clear guidance toshowmodifynewsearcheventsterms or adjust filters -
DataFilterAvailabilityVisibility:TheActiveinterfacefiltersdisplaysremainactualvisibledevice eventseven whenavailable,noshowingresultsdetailedaredevicefound,identifiersmaking it easy to identify andtimestampsmodifyfromsearchMikrotik RB952Ui device models