Device logs
Overview
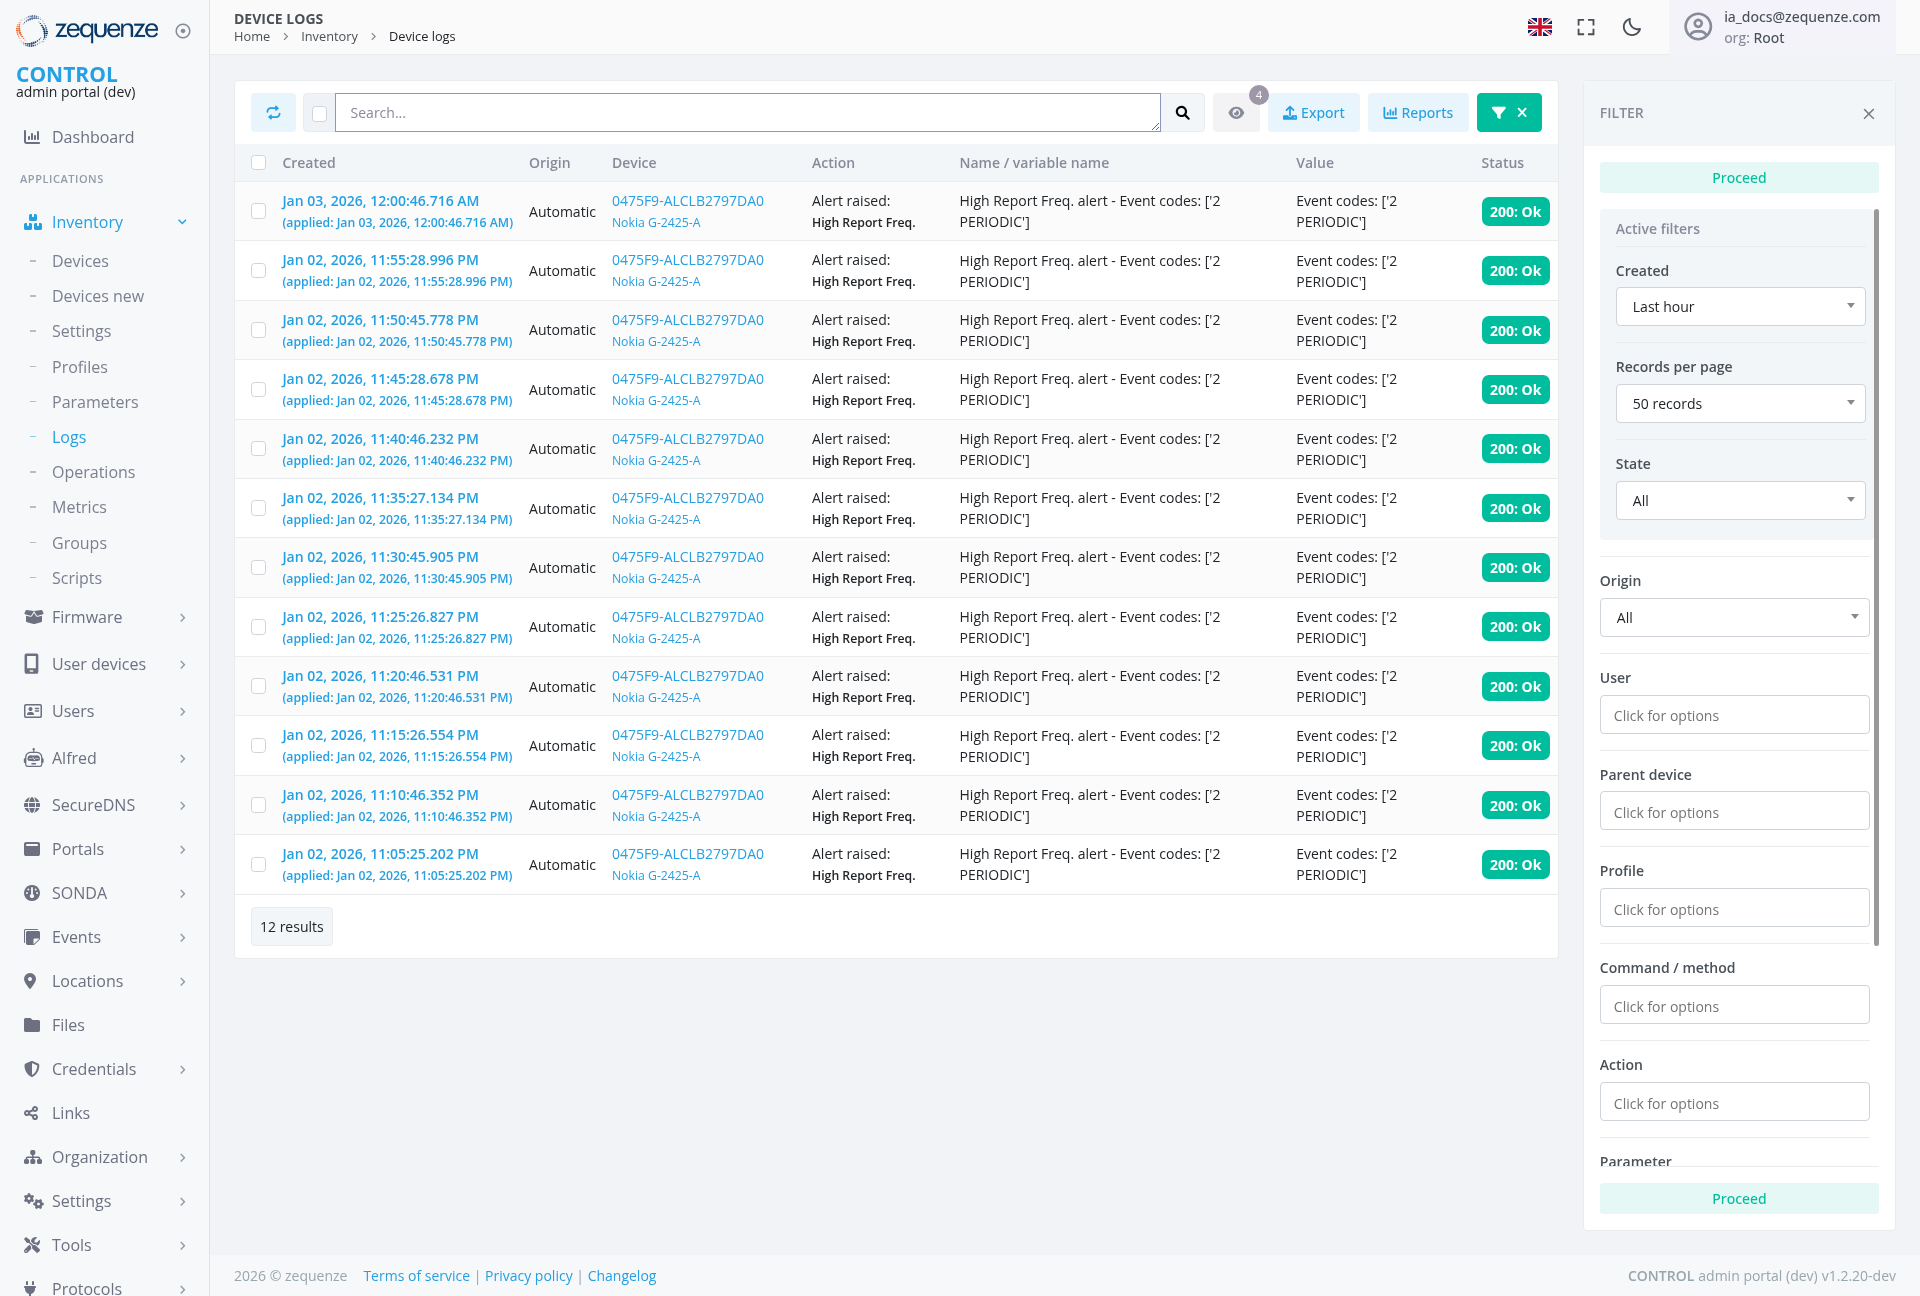
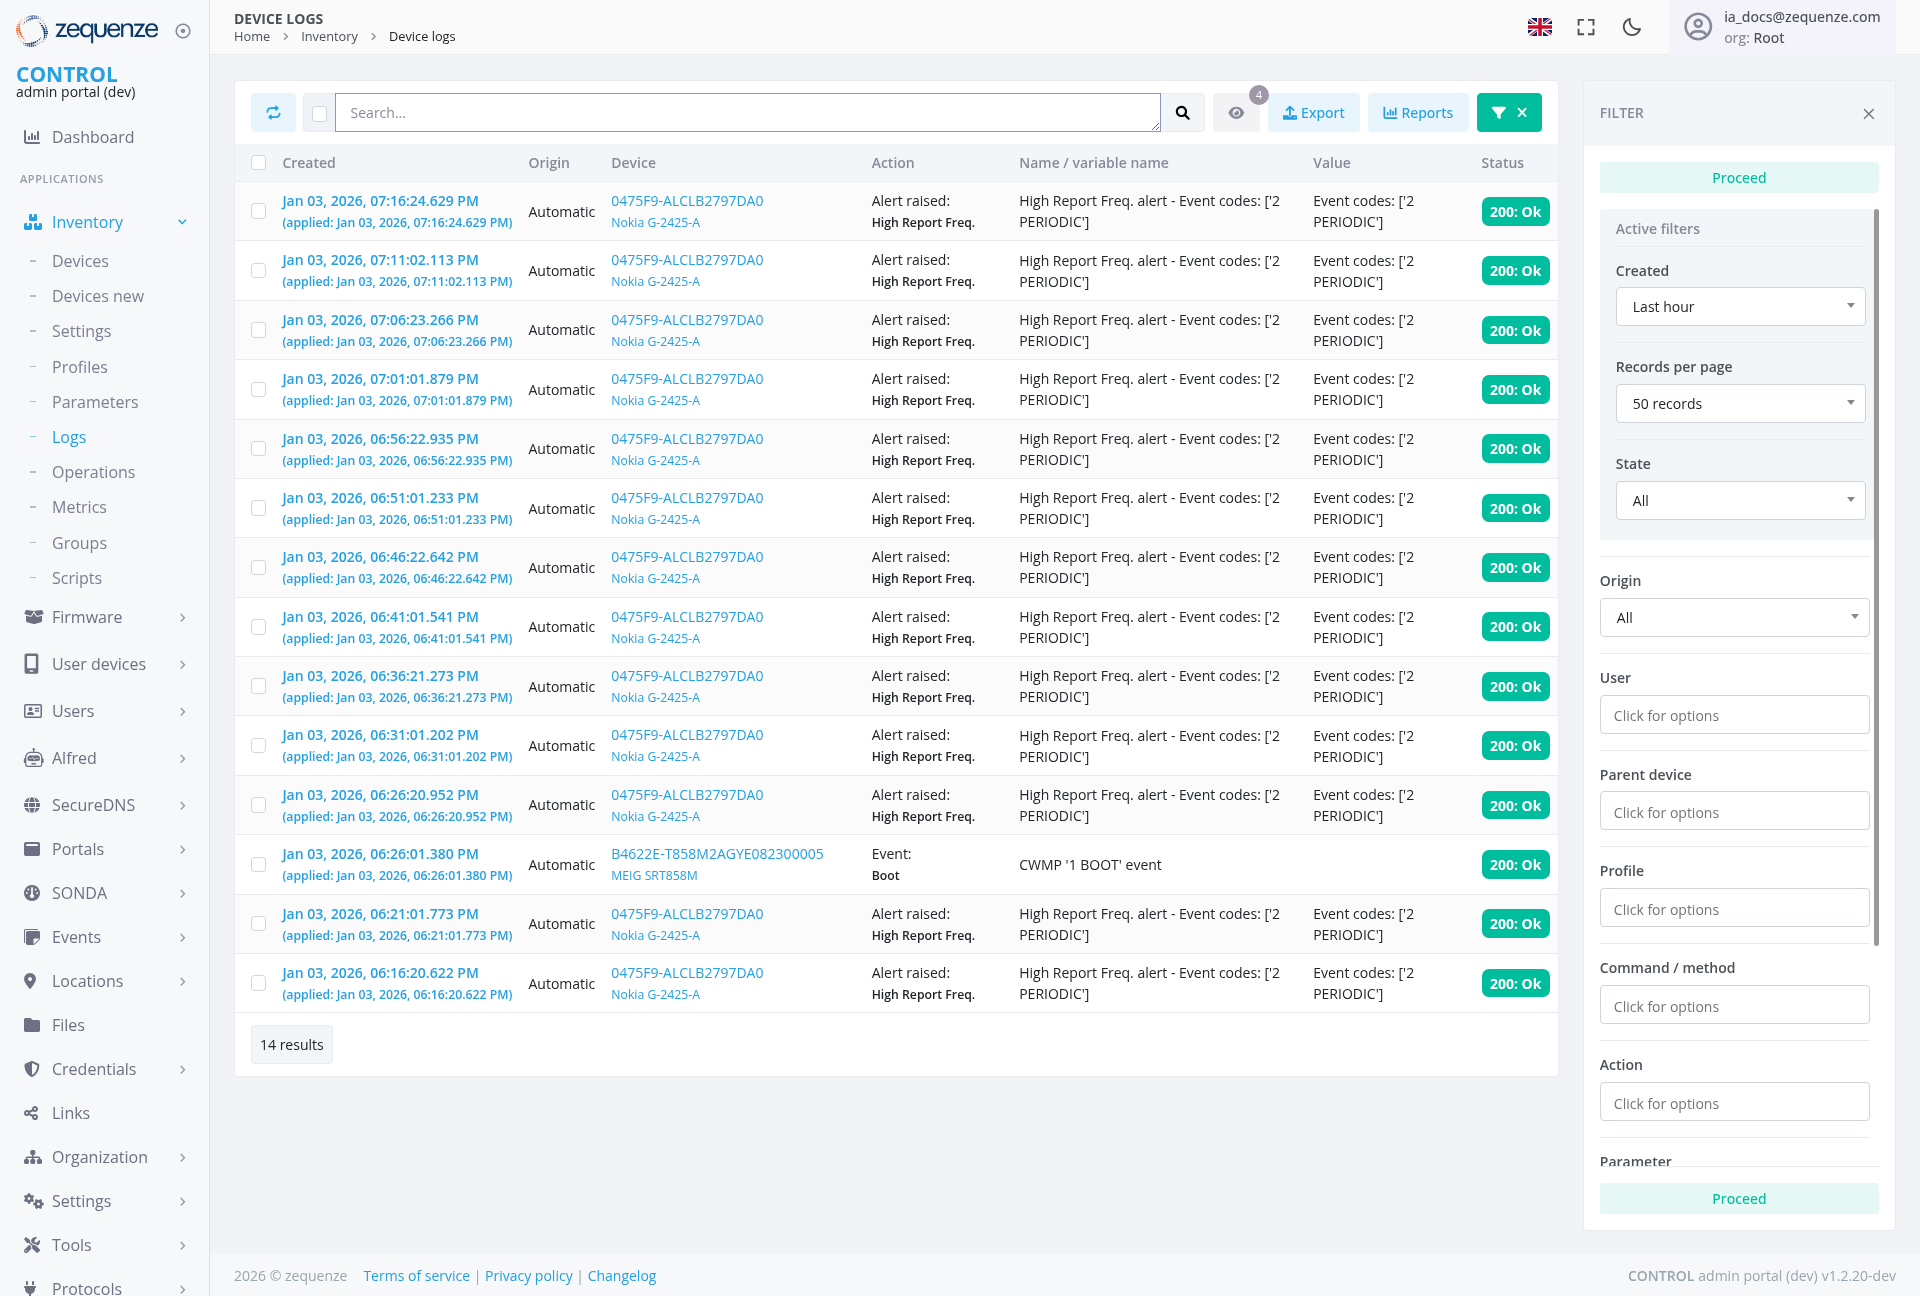
The Device Logs section of the Zequenze Control Portal provides a comprehensive view of all device activity and configuration changes. This page displays real-time and historical log entries for network devices, allowing administrators to monitor device events, track configuration modifications, and troubleshoot network issues.
Key Features
- Real-time Log Monitoring: View live device events and configuration changes as they occur
- Comprehensive Search: Advanced search functionality to filter logs by various criteria
- Export Capabilities: Export log data for external analysis and reporting
- Reports Generation: Generate custom reports from filtered log data
- Detailed Event Information: Access to complete event details including timestamps, origins, and affected parameters
- Advanced Filtering System: Expandable filter panel with comprehensive filtering options for precise log analysis
UI Elements
Header Section
- Search Bar: Located at the top center for quick log entry searches
- Export Button: Blue "Export" button for exporting log data
- Reports Button: Light blue "Reports" button for generating custom reports
- Filter Toggle: Green "FILTER" button with close (X) option for toggling the filter panel
Main Data Table
The central table displays log entries with the following columns:
- Created: Timestamp of when the event occurred
- Origin: Source of the event (e.g., "Automatic")
- Device: Device identifier or name
- Action: Type of action performed (e.g., "Alert raised: High Report Freq")
- Name/Variable Name: Specific parameter or event name affected
- Value: Current or new value of the parameter
- Status: Overall status indicator with green "200: Ok" badges displayed
Current Data Display
The page currently shows multiple log entries with actual device data:
-
Alert Events: Multiple "Alert raised: High Report Freq" alerts with event codes [2 PERIODIC] from Nokia G-2425-A
devicesdevices, plus a CWMP '1 BOOT' event - Device Identifiers: Device IDs including "047SF9-ALCUB27970A0" Nokia G-2425-A devices and "B4622E-T8SSM2AGVEU8230000S" MEG devices
-
Timestamps: All entries from January
2,3, 2026, with precise timestamps including applied times - Status Indicators: Consistent green "200: Ok" status badges across all entries
-
Results Counter: "
1214 results" shown at the bottom left
Filter Panel (Right Side)
The expandable filter panel is currently open and displays comprehensive filtering options:
- Panel State: Currently expanded, showing all available filter options
- Toggle Control: Green filter button with X close option for showing/hiding the panel
- Active Filter Section: "Proceed" filter is currently active and highlighted in green
-
Filter Options (currently visible):
- Created: Time-based filtering with "Last hour" dropdown selection
- Records per page: Currently set to "50 records"
- State: Dropdown with "All" selected
- Origin: Dropdown with "All" selected
- User: "Click for options" field
- Parent device: "Click for options" field
- Profile: "Click for options" field
- Command / method: "Click for options" field
- Action: "Click for options" field
- Parameter: Section with green "Proceed" active filter button
User Interactions
Searching and Filtering
- Quick Search: Enter search terms in the top search bar and click the search icon
- Filter Panel Access: Click the green "FILTER" button to expand the advanced filtering options
- Advanced Filtering: Use the expandable filter panel on the right with multiple filtering options including time-based, state, origin, and parameter filters
- Panel Management: Use the X button to close the filter panel when not needed
- Active Filter Management: Use the green "Proceed" button to apply or manage active parameter filters
- Dropdown Interactions: Click on dropdown menus for Created, State, and Origin filters to select specific options
- Expandable Options: Click on "Click for options" fields to access additional filtering criteria
Data Management
- Export Data: Use the blue "Export" button to export current log data
- Generate Reports: Use the "Reports" button to create custom analytical reports
- Filter Toggle: Use the green "FILTER" button to show/hide the filtering interface
- Pagination Control: Adjust records per page display using the dropdown in the filter panel
Event Analysis
- Event Details: View detailed information in the table columns including device identifiers, timestamps, and actions
- Status Monitoring: Monitor status indicators with consistent green "200: Ok" badges
- Parameter Tracking: Follow specific parameter changes across time with complete status visibility
- Time-based Analysis: Use the "Last hour" filter and other time controls for temporal analysis
Navigation
Access Path
Related Sections
- Dashboard: Return to main dashboard for overview
- Inventory: Access device inventory and management
- Settings: Configure logging preferences and parameters
Data Displayed
Event Types
- Alert Events: High Report Frequency alerts with periodic event codes
- Boot Events: CWMP '1 BOOT' events for device startup monitoring
Information Categories
- Alert Notifications: Device-generated alerts for high frequency reporting
Actions Available
Primary Actions
- Search: Filter and locate specific log entries
- Export Data: Export current log entries using the Export button
- Generate Reports: Create analytical reports from log data
- Toggle Filters: Use the green "FILTER" button to show/hide advanced filtering options
- Real-time Monitoring: View live device events and changes
Filtering Actions
- Panel Toggle: Click the green "FILTER" button to expand/collapse filtering options
- Time Filtering: Use "Created" dropdown to filter by time periods (Last hour, etc.)
- Records Control: Adjust "Records per page" to control data display (currently 50 records)
- State Filtering: Filter by device operational state using the State dropdown
- Origin Filtering: Filter by event source or origin using the Origin dropdown
- User-based Filtering: Access user filtering options by clicking "Click for options" in the User field
- Parent Device Filtering: Access parent device filtering by clicking "Click for options"
- Profile Filtering: Access profile filtering by clicking "Click for options"
- Command/Method Filtering: Access command/method filtering by clicking "Click for options"
- Action Filtering: Access action filtering by clicking "Click for options"
- Parameter Filtering: Advanced parameter-based filtering with green "Proceed" button for active filters
- Active Filter Management: Use the green "Proceed" button to manage currently applied parameter filters
Administrative Functions
- Event Tracking: Monitor device behavior and performance
- Alert Management: Track and respond to device-generated alerts
- Boot Monitoring: Track device startup and initialization events
Notes/Tips
- Real-time Updates: The log view updates automatically to show new events
- Data Availability: The interface displays actual device events when available, showing detailed device identifiers and timestamps from Nokia G-2425-A and MEG device models
- Multi-vendor Support: The system tracks events from multiple device vendors including Nokia and MEG devices