Device logs
Overview
The Device Logs section of the Zequenze Control Portal provides a comprehensive view of all device activity and configuration changes. This page displays real-time and historical log entries for network devices, allowing administrators to monitor device events, track configuration modifications, and troubleshoot network issues.
Key Features
- Real-time Log Monitoring: View live device events and configuration changes as they occur
- Comprehensive Search: Advanced search functionality to filter logs by various criteria
- Export Capabilities: Export log data for external analysis and reporting
- Reports Generation: Generate custom reports from filtered log data
- Detailed Event Information: Access to complete event details including timestamps, origins, and affected parameters
-
Advanced Filtering System:
ExpandedCollapsible filter panel with comprehensive filtering options for precise log analysis
UI Elements
Header Section
- Search Bar: Located at the top center for quick log entry searches
- Export Button: Blue "Export" button for exporting log data
- Reports Button: Light blue "Reports" button for generating custom reports
-
Filter
PanelToggle:ExpandedGreenright-side"FILTER"panelbutton withcomprehensiveclosefiltering(X)optionsoption for toggling the filter panel
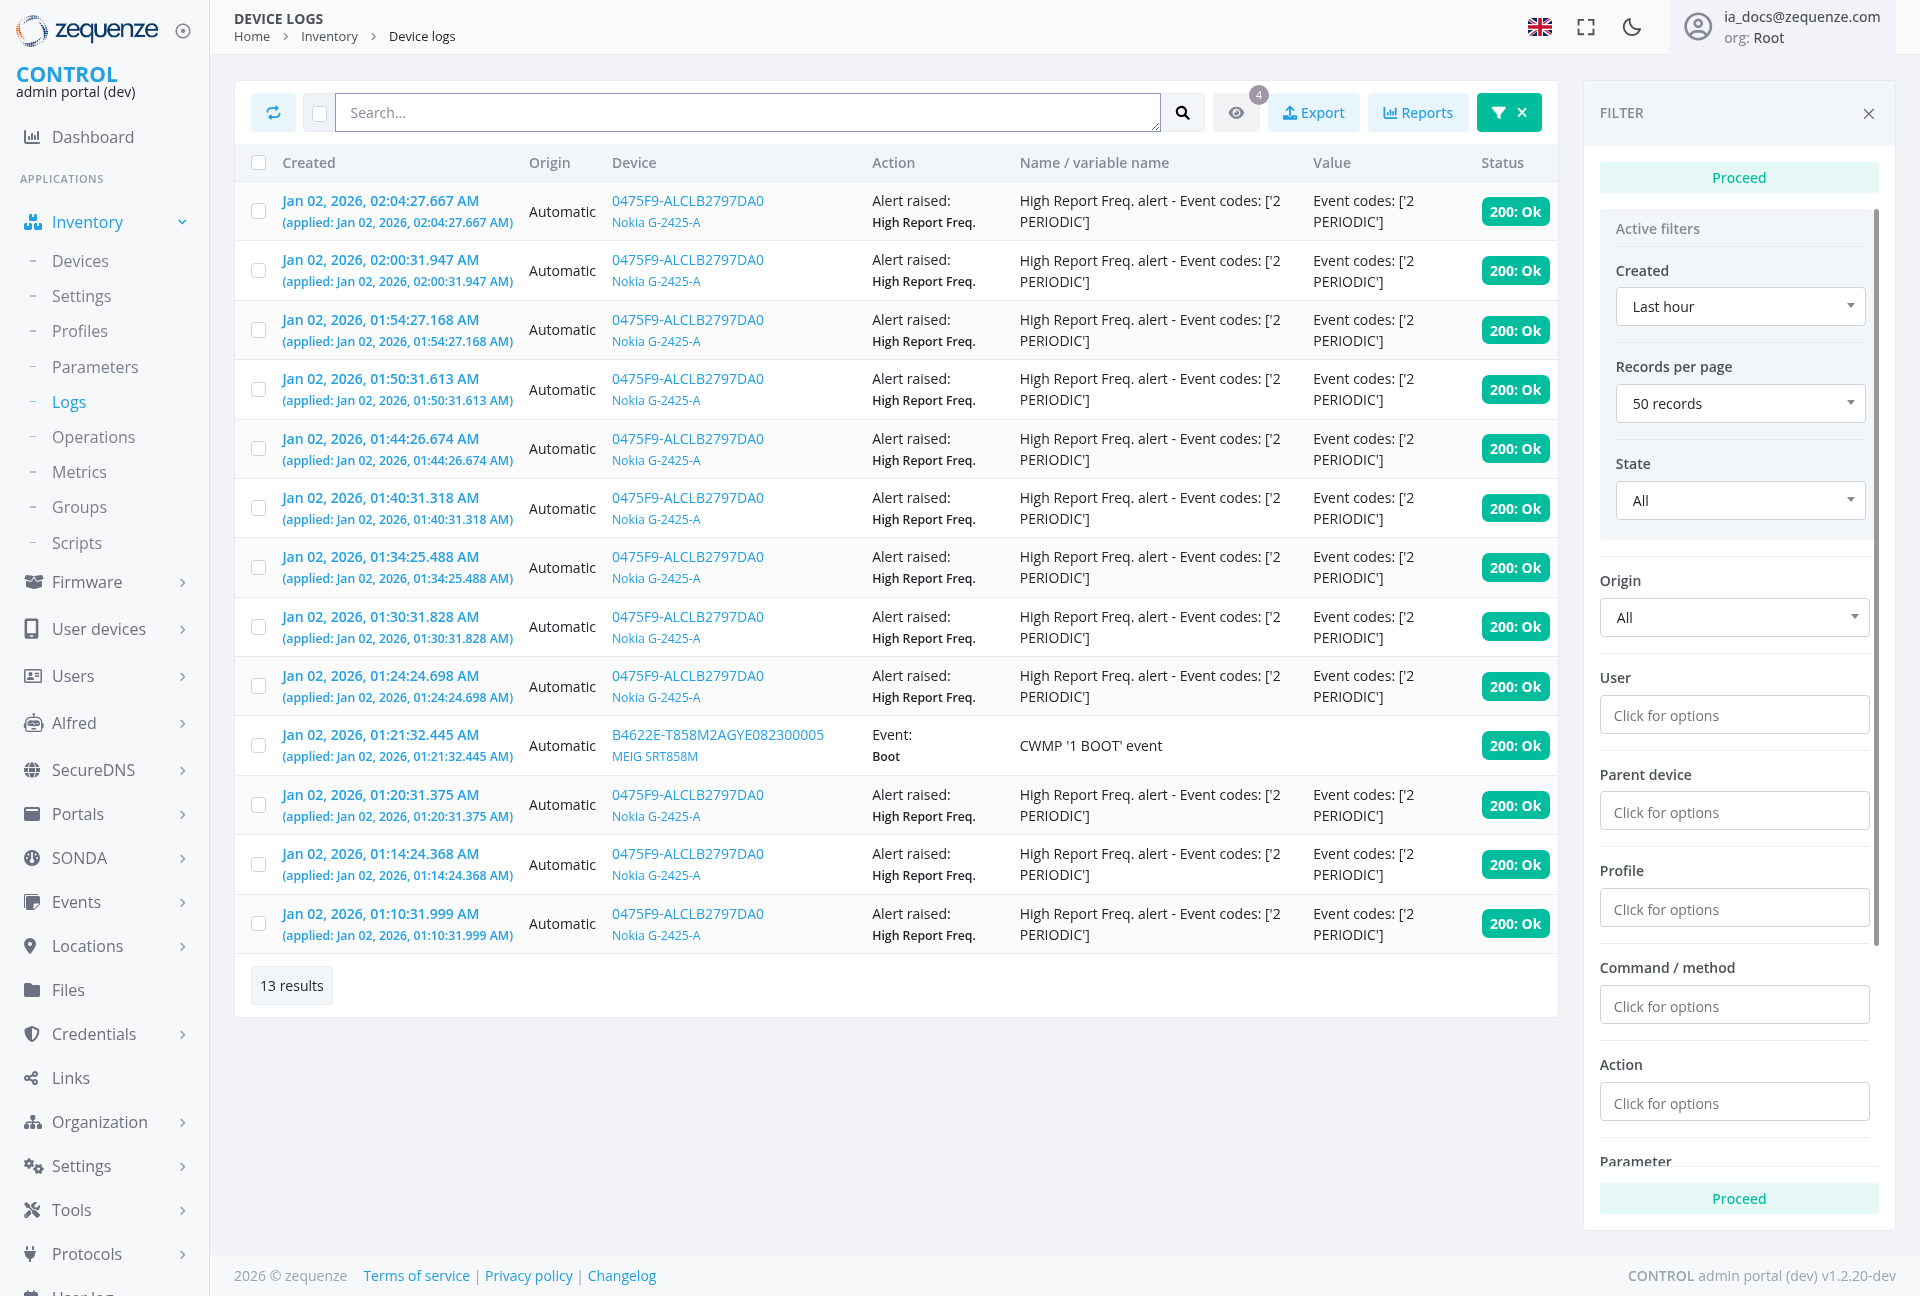
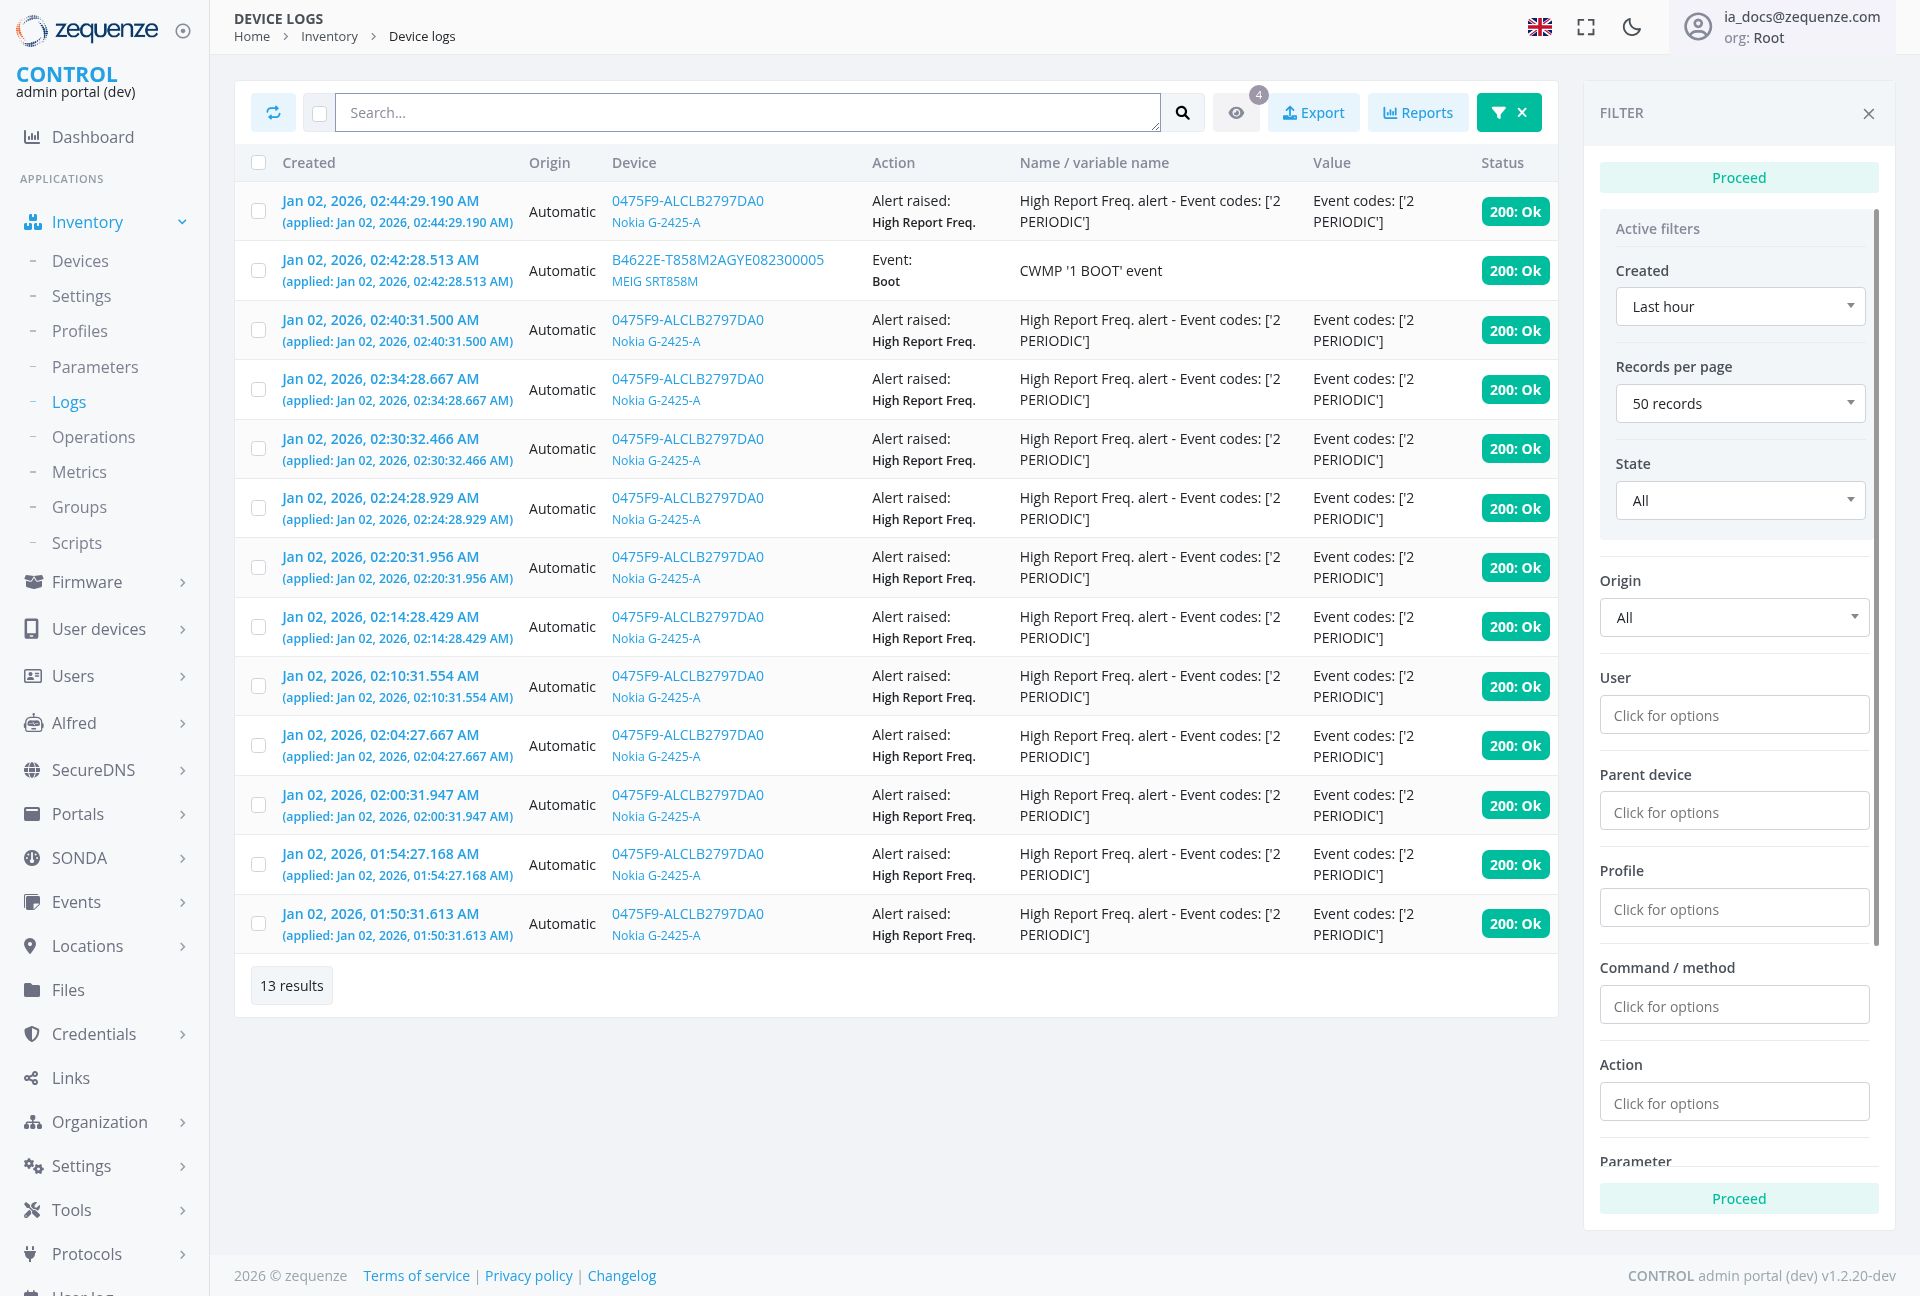
Main Data Table
The central table displays log entries with the following columns:
- Created: Timestamp of when the event occurred
- Origin: Source of the event (e.g., "Automatic")
- Device: Device identifier or name
- Action: Type of action performed (e.g., "Alert raised: High Report Freq")
- Name/Variable Name: Specific parameter or event name affected
- Value: Current or new value of the parameter
- Status: Overall status indicator with green "200: Ok" badges displayed
Current Data Display
The page currently shows multiple log entries with actual device data:
- Alert Events: Multiple "Alert raised: High Report Freq" alerts with event codes [2 PERIODIC] from Nokia G-2425-A devices
- Boot Event: CWMP 'I BOOT' event from MFG SR1858M device
- Device Identifiers: Various device IDs including "047SF9-ALCUB27970A0" and "B4C22E-T958MA2A0YE062300005"
- Timestamps: All entries from January 2, 2026, with precise timestamps including applied times
- Status Indicators: Consistent green "200: Ok" status badges across all entries
- Results Counter: "13 results" shown at the bottom left
Filter Panel (Right Side)
The expandedcollapsible filter panel provides comprehensive filtering options:options and is currently collapsed:
-
Panel State: Currently
expanded,collapsed,showingwithdetailedgreenfiltering"FILTER"controlsbutton visible for expansion -
StateToggleFilterControl:DropdownGreenmenufilter button with"All"Xselectedclose option forfilteringshowing/hidingbythedevice statepanel -
OriginFilterFilterOptions (available when expanded):Dropdownmenu - State filtering with
"All"dropdownselectedmenus
User Interactions
Searching and Filtering
- Quick Search: Enter search terms in the top search bar and click the search icon
- Filter Panel Access: Click the green "FILTER" button to expand the advanced filtering options
Data Management
- Export Data: Use the blue "Export" button to export current log data
- Generate Reports: Use the "Reports" button to create custom analytical reports
-
PaginationFilterControlToggle: Use the green "RecordsFILTER"per page" dropdownbutton tocontrolshow/hide thenumberfilteringof entries displayed
Event Analysis
- Event Details: View detailed information in the table columns including device identifiers, timestamps, and actions
- Status Monitoring: Monitor status indicators with consistent green "200: Ok" badges
- Parameter Tracking: Follow specific parameter changes across time with complete status visibility
-
Multi-criteriaStreamlinedAnalysisInterface:UseWorkcombinationwithofa cleaner interface when filters are collapsed forcomprehensivebettereventdataanalysisvisibility
Navigation
Access Path
Related Sections
- Dashboard: Return to main dashboard for overview
- Inventory: Access device inventory and management
- Settings: Configure logging preferences and parameters
Data Displayed
Event Types
- Alert Events: High Report Frequency alerts with periodic event codes
- Boot Events: Device startup and initialization logs (e.g., CWMP 'I BOOT' events)
- Configuration Changes: Parameter modifications and updates
- Network Events: Connectivity and communication logs
- System Events: Operational status and health indicators
Information Categories
- Alert Notifications: Device-generated alerts for high frequency reporting
- CWMP Events: TR-069 protocol-related activities including boot events
- Device Configuration: Device-specific parameters and settings
- Security Settings: Password, SSID, and authentication configurations
- Network Parameters: Channel, frequency, and connectivity settings
Actions Available
Primary Actions
- Search: Filter and locate specific log entries
- Export Data: Export current log entries using the Export button
- Generate Reports: Create analytical reports from log data
-
AdvancedToggleFilteringFilters: Use thecomprehensivegreenfilter"FILTER"panelbuttonwithtomultipleshow/hidecriteriaadvanced filtering options - Real-time Monitoring: View live device events and changes
Filtering Actions
- Panel Toggle: Click the green "FILTER" button to expand filtering options
Administrative Functions
- Event Tracking: Monitor device behavior and performance
- Alert Management: Track and respond to device-generated alerts
- Troubleshooting: Identify and diagnose network issues through boot events and system logs
- Compliance Monitoring: Track configuration compliance and changes
- Audit Trail: Maintain records of all device modifications
-
ActiveInterfaceFilter ManagementOptimization:MonitorToggleandfiltermanagepanelcurrentlyvisibilityappliedforfiltersoptimal workspace management
Notes/Tips
- Real-time Updates: The log view updates automatically to show new events
- Data Availability: The interface displays actual device events when available, showing detailed device identifiers and timestamps from various device models
-
ComprehensiveCollapsibleFilteringInterface: Theexpandedfilter panelprovidescanextensivebeoptionstoggledforusingprecisetheloggreenanalysis"FILTER"andbutton to maximize datarefinementviewing space - Search Refinement: Use the search functionality combined with advanced filters for highly specific log queries
- Device Identification: Each log entry clearly identifies the source device with full device identifiers and model information
- Status Indicators: Consistent green "200: Ok" status badges provide clear operational status tracking
-
Pagination Control: Adjust the records per page (currently set to 50) to optimize viewing preferences