Device logs
Overview
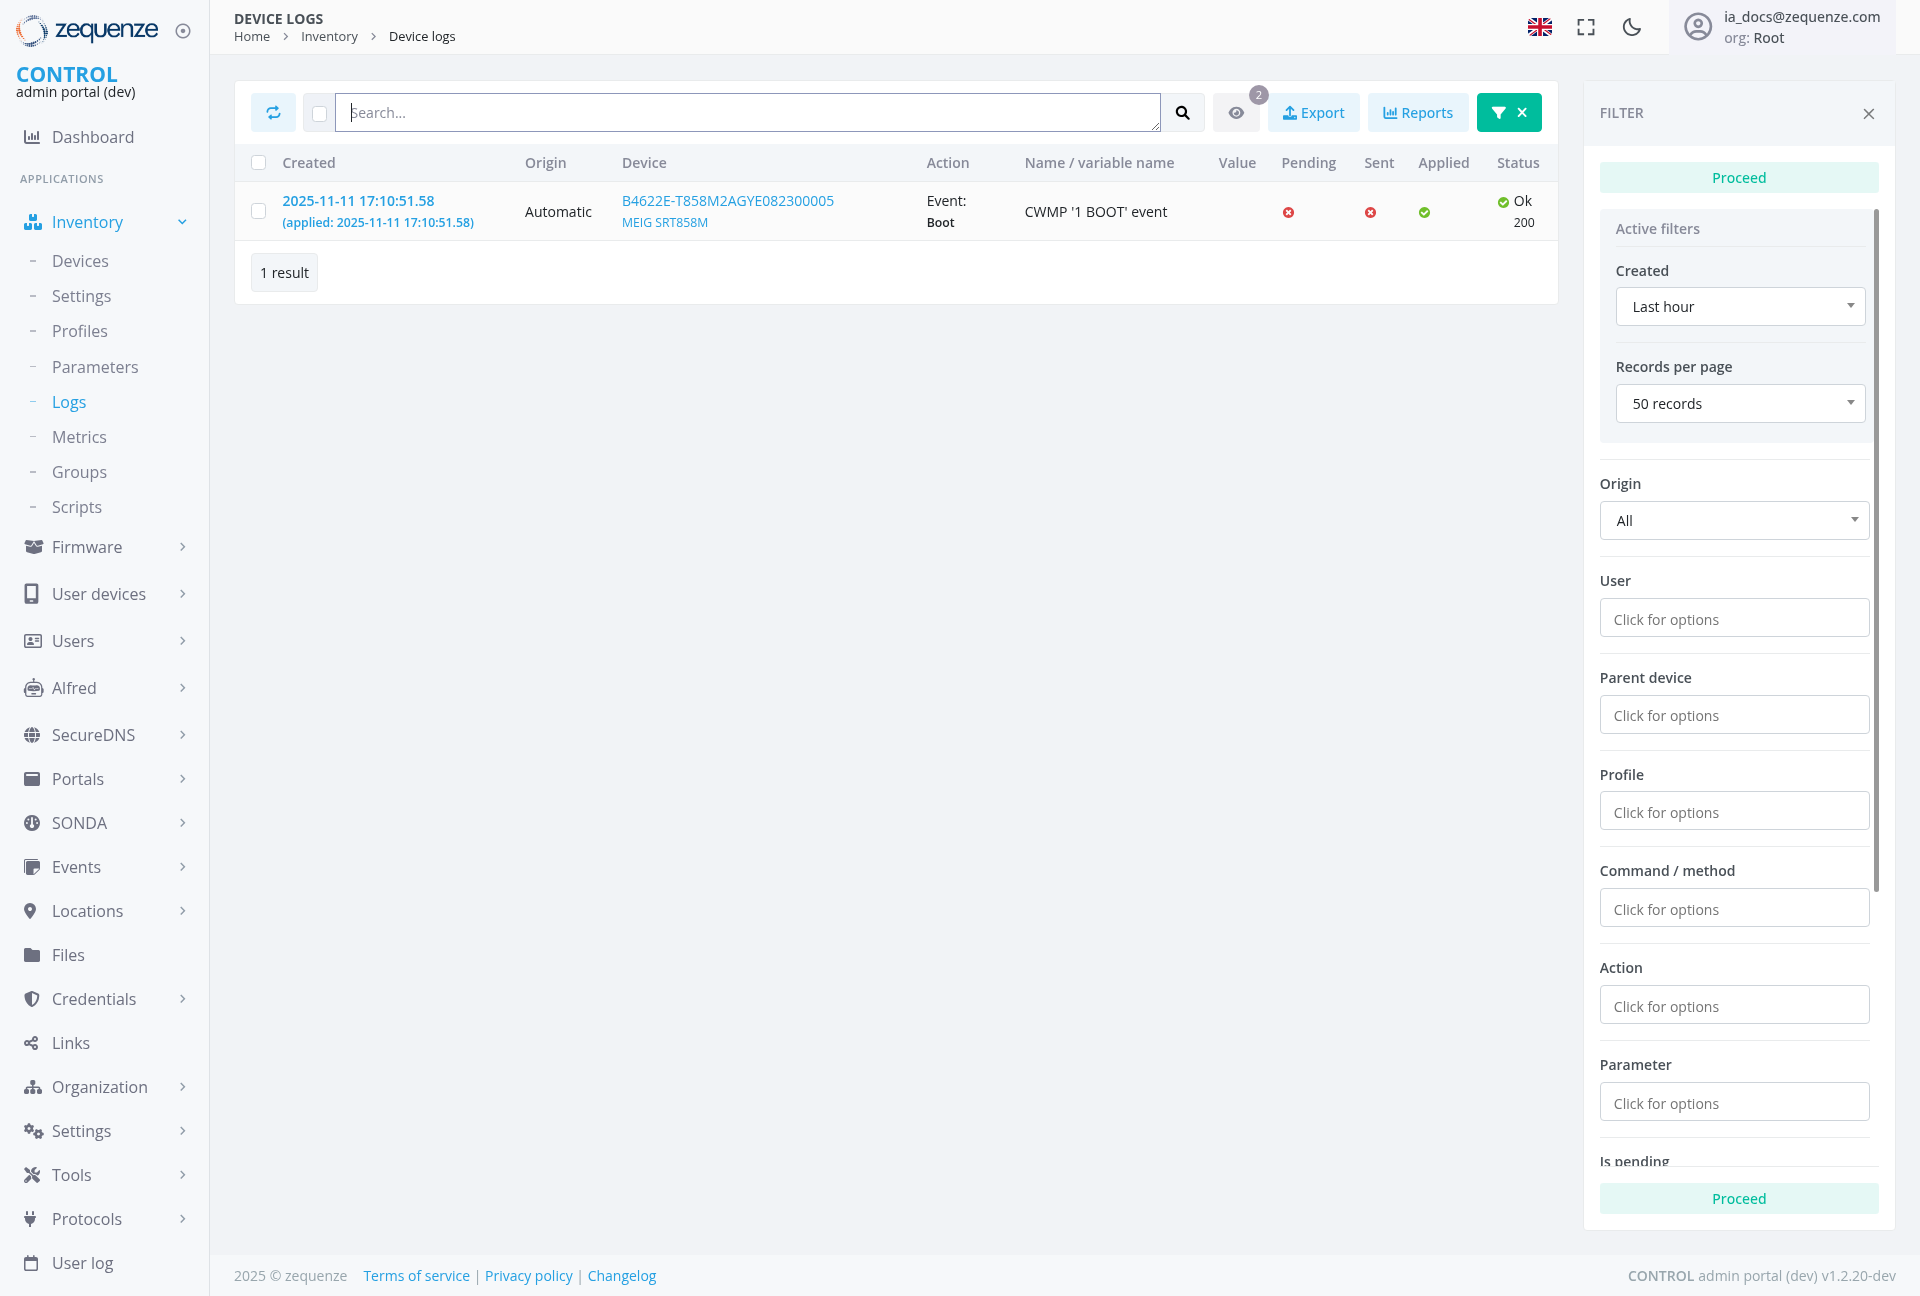
The Device Logs section of the Zequenze Control Portal provides a comprehensive view of all device activity and configuration changes. This page displays real-time and historical log entries for network devices, allowing administrators to monitor device events, track configuration modifications, and troubleshoot network issues.
Key Features
- Real-time Log Monitoring: View live device events and configuration changes as they occur
- Comprehensive Search: Advanced search functionality to filter logs by various criteria
- Export Capabilities: Export log data for external analysis and reporting
- Reports Generation: Generate custom reports from filtered log data
- Detailed Event Information: Access to complete event details including timestamps, origins, and affected parameters
- Filtering System: Multiple filter options to narrow down log entries based on specific criteria
UI Elements
Header Section
- Search Bar: Located at the top center for quick log entry searches
- Export Button: Blue "Export" button for exporting log data
- Reports Button: Light blue "Reports" button for generating custom reports
- Close Filter Button: Green "X" button for closing the filter panel
- Filter Panel: Expanded right-side panel with advanced filtering options
Main Data Table
The central table displays log entries with the following columns:
- Created: Timestamp of when the event occurred
- Origin: Source of the event (e.g., "Automatic")
- Device: Device identifier or name
-
Action: Type of action performed (e.g., "
Event:AlertBoot"raised: High Report Freq") - Name/Variable Name: Specific parameter or event name affected
- Value: Current or new value of the parameter
-
Pending: Status indicator for pending changes
Current Data Display
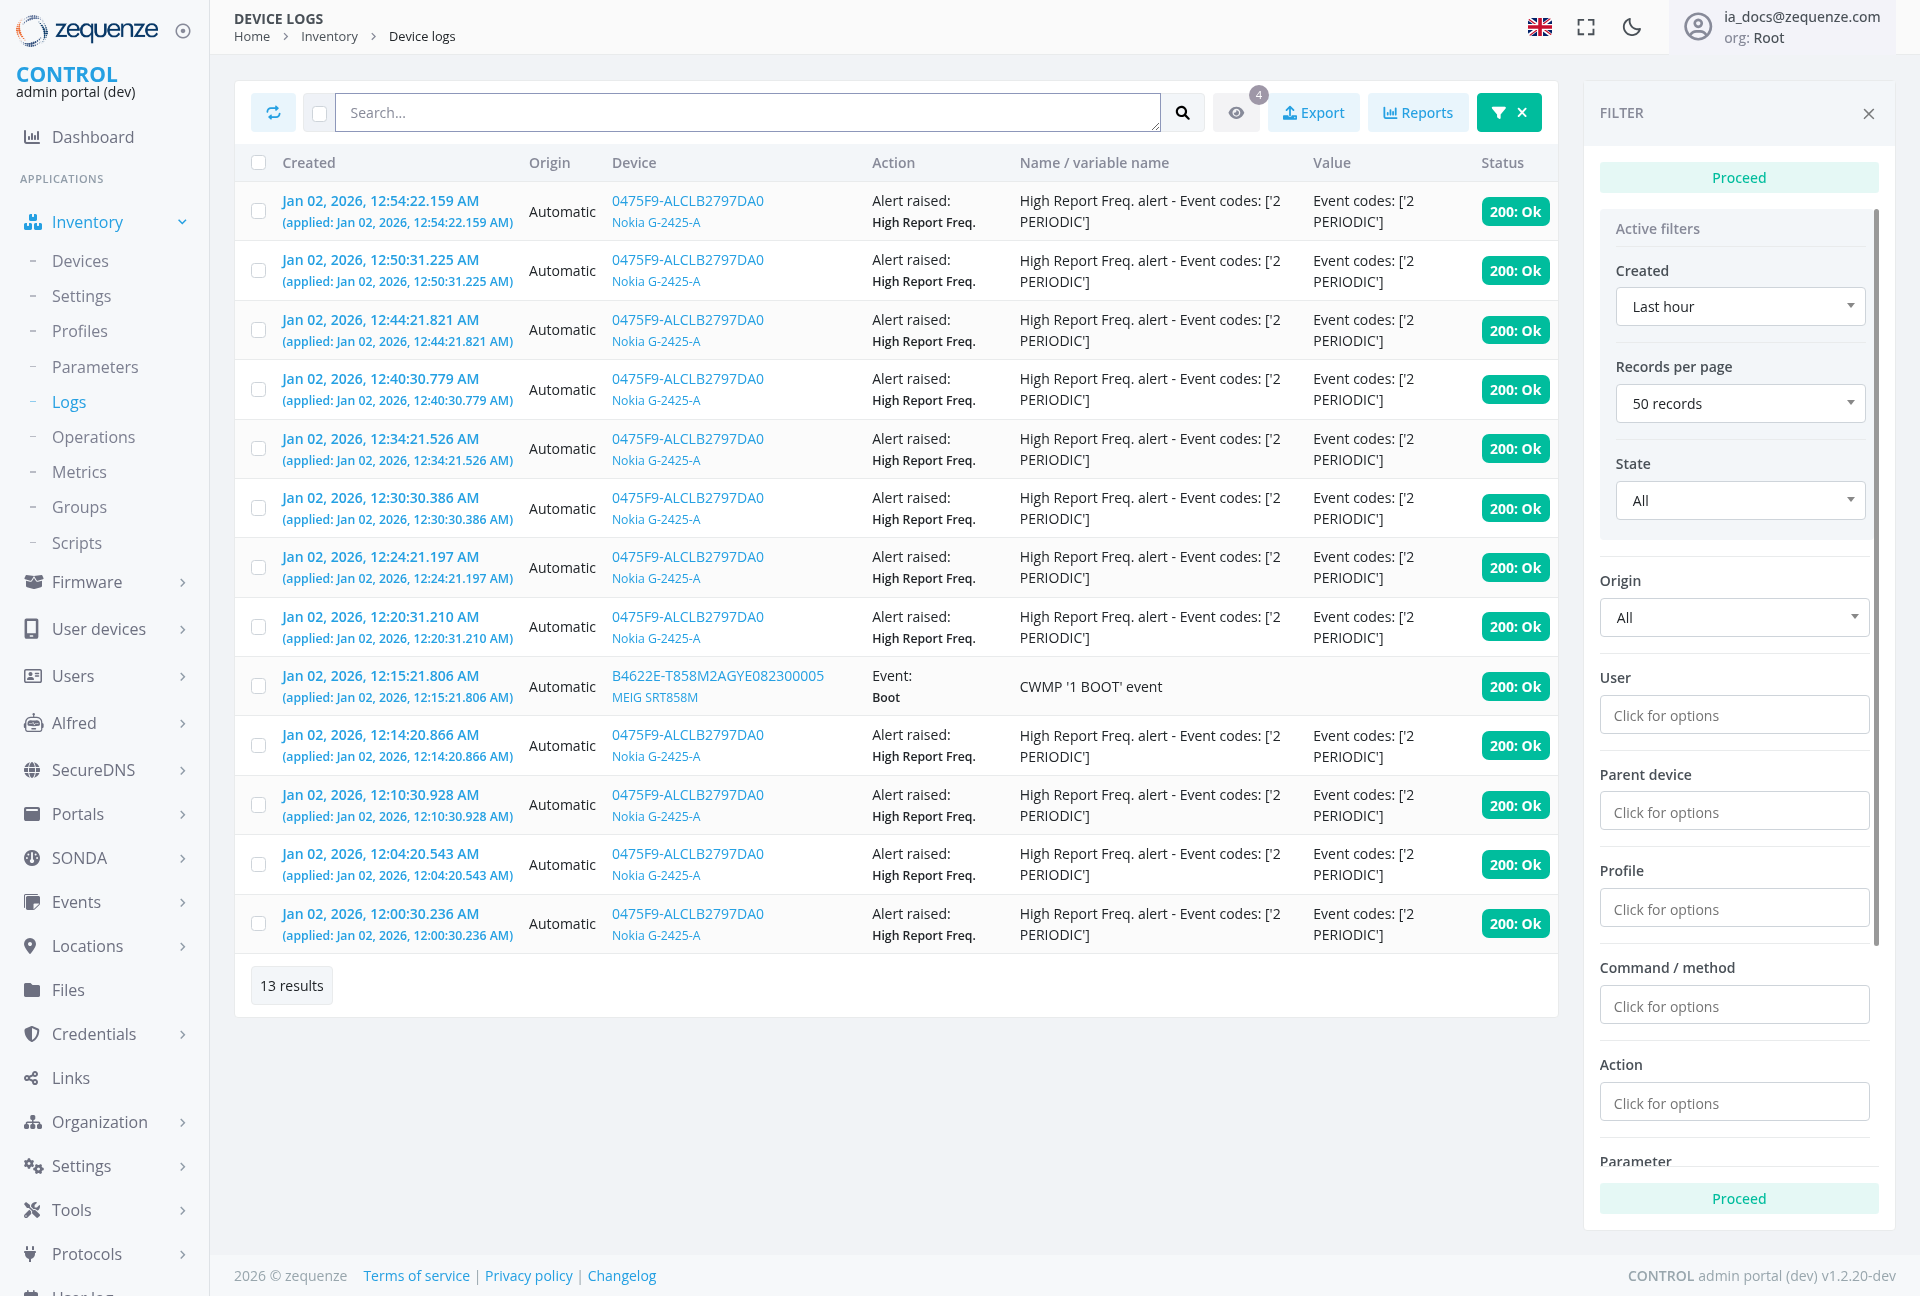
The page currently shows onemultiple log entryentries with actual device data:
-
EntryAlert Events: Multiple "Alert raised: High Report Freq" alerts with event codes [2 PERIODIC] from Nokia G-2425-A devices
Filter Panel (Right Side)
- Process Status: "Proceed" status indicator at the top in a green badge
- Active filters: Display of currently applied filters
- Created: Time-based filtering with "Last hour" dropdown selection
- Records per page: "50 records" dropdown for pagination controls
User Interactions
Searching and Filtering
- Quick Search: Enter search terms in the top search bar and click the search icon
- Advanced Filtering: The filter panel is expanded on the right showing active filtering options
- Time-based Filtering: Use the "Created" filter set to "Last hour" to specify time ranges for log entries
- Multi-criteria Filtering: Combine multiple filters for precise log entry selection including parameter and action-based filters
- Close Filters: Use the green "X" button to close the filter panel
Data Management
- Export Data: Use the blue "Export" button to export current log data
- Generate Reports: Use the "Reports" button to create custom analytical reports
- Pagination: Navigate through log entries using the "50 records" per page selector
Event Analysis
- Event Details: View detailed information in the table columns including device identifiers, timestamps, and actions
-
Status Monitoring: Monitor
Pending, Sent, and Appliedstatus indicators withvisualconsistentcolor-codedgreencircular"200:markersOk" badges - Parameter Tracking: Follow specific parameter changes across time with complete status visibility
Navigation
Access Path
Related Sections
- Dashboard: Return to main dashboard for overview
- Inventory: Access device inventory and management
- Settings: Configure logging preferences and parameters
Data Displayed
Event Types
- Alert Events: High Report Frequency alerts with periodic event codes
Information Categories
Actions Available
Primary Actions
- Search: Filter and locate specific log entries
- Export Data: Export current log entries using the Export button
- Generate Reports: Create analytical reports from log data
- Close Filters: Hide the filter panel using the close button
- Real-time Monitoring: View live device events and changes
Administrative Functions
- Event Tracking: Monitor device behavior and performance
Notes/Tips
- Real-time Updates: The log view updates automatically to show new events
- Data Availability: The interface displays actual device events when available, showing detailed device identifiers and timestamps from various device models
- Filter Persistence: Applied filters remain active during the session and are visible in the expanded filter panel with green status badges
- Search Refinement: Use the search functionality and filters to narrow down results to specific devices or time periods
-
Device Identification: Each log entry clearly identifies the source device with full device identifiers and model information
(e.g., MFG SR1858M) -
Status Indicators:
Color-codedConsistentcirculargreen "200: Ok" statusindicatorsbadges providecomprehensiveclearchangeoperational status trackingwith red and green visual markers - Expandable Interface: The filter panel can be closed for more viewing space of the main data table
- Export Functionality: Use the Export button to extract log data for external analysis and record keeping
-
AppliedAlertTimestampsMonitoring:EachTheentrysystemshowsdisplaysbothvariouscreationalertandtypesapplicationincludingtimestampshigh report frequency notifications forcompleteproactiveaudit trail trackingmonitoring -
Enhanced Filtering: Additional filter options
forincludingActionStateand Parameter fieldsfield provide more granular search capabilities