Device logs
Overview
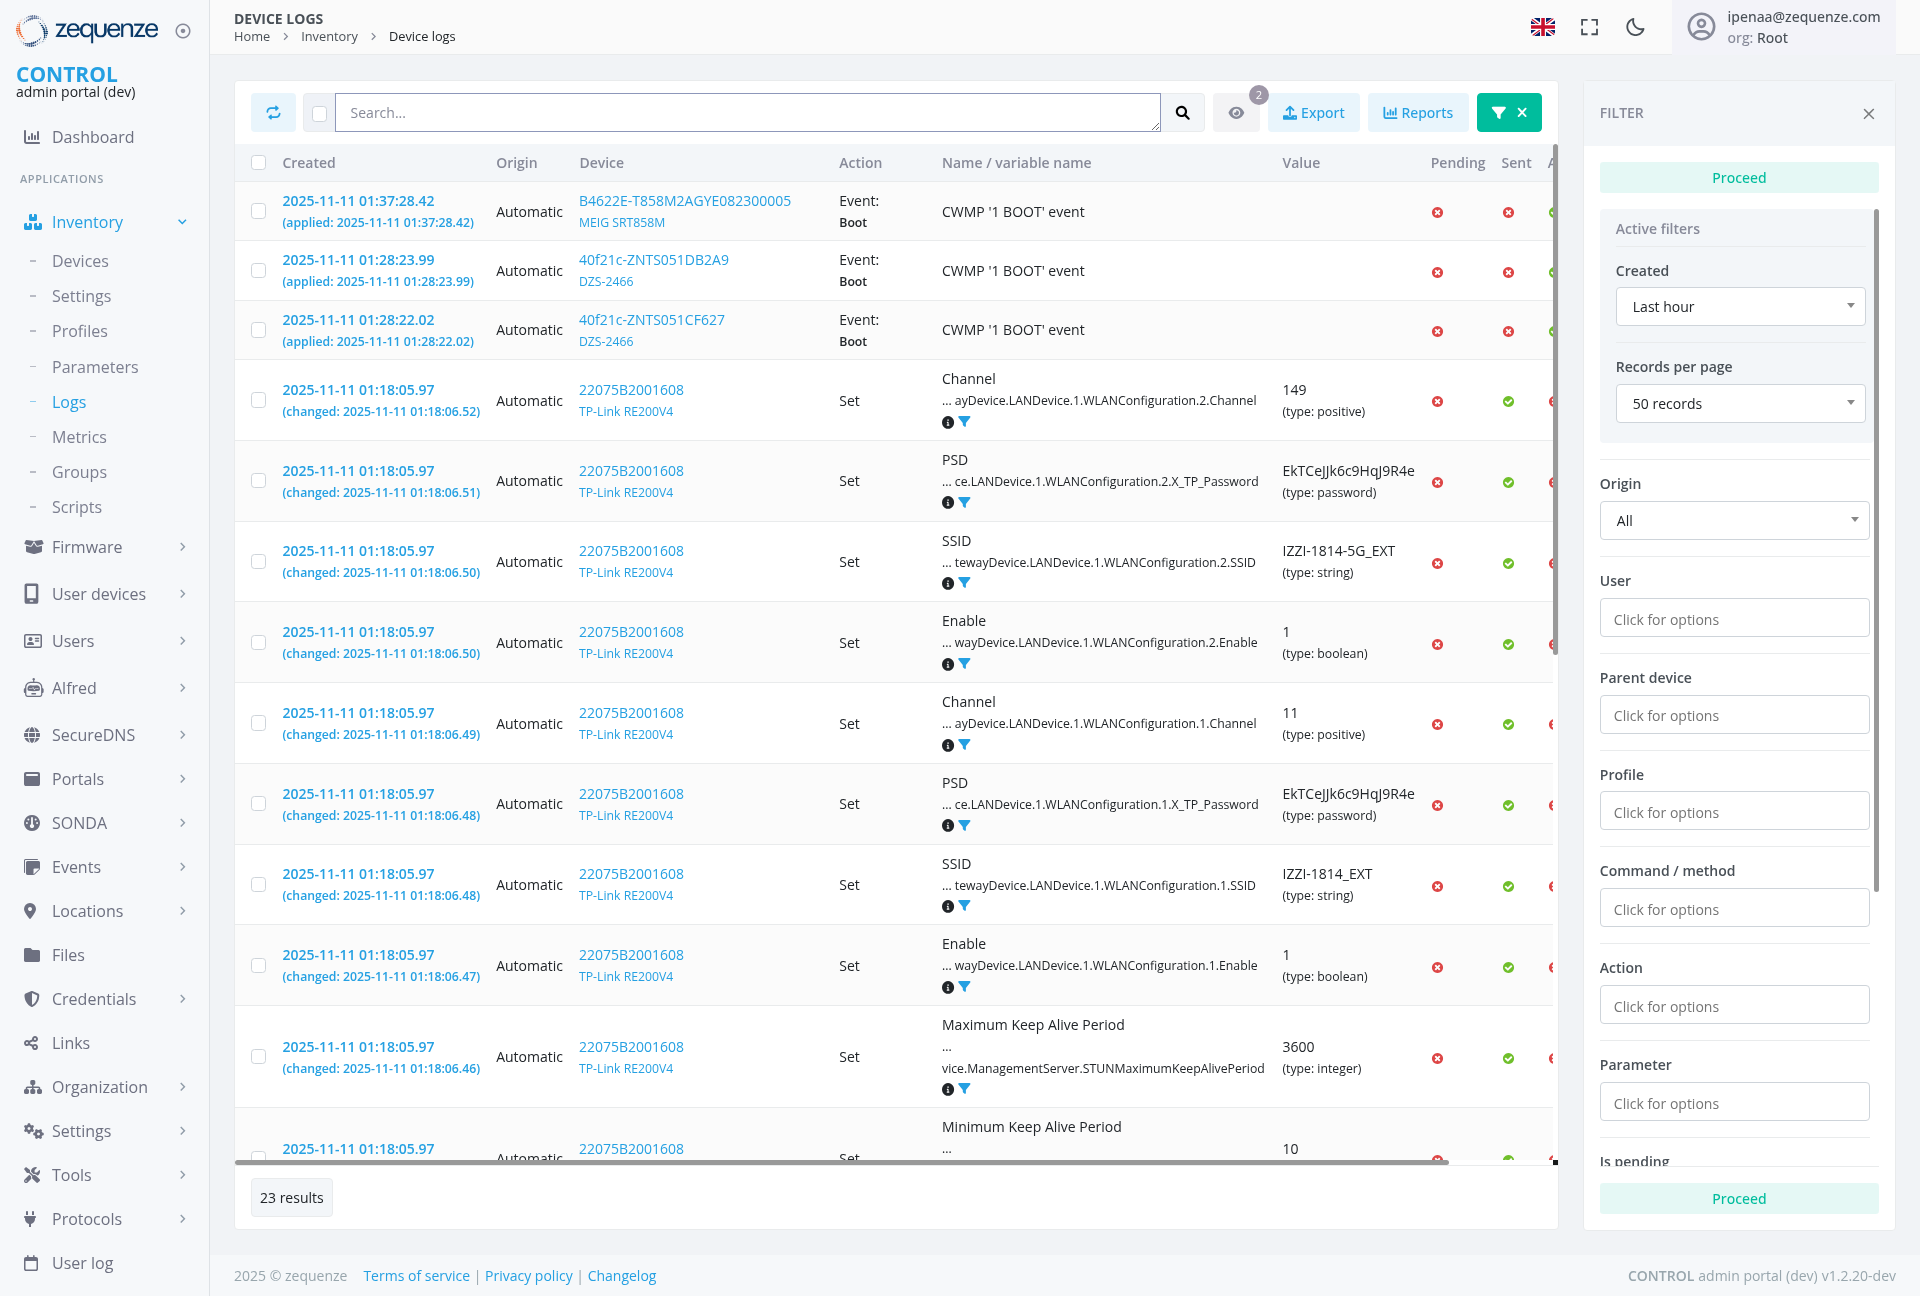
The Device Logs section of the Zequenze Control Portal provides a comprehensive view of all device activity and configuration changes. This page displays real-time and historical log entries for network devices, allowing administrators to monitor device events, track configuration modifications, and troubleshoot network issues.
Key Features
- Real-time Log Monitoring: View live device events and configuration changes as they occur
- Comprehensive Search: Advanced search functionality to filter logs by various criteria
- Export Capabilities: Export log data for external analysis and reporting
- Reports Generation: Generate custom reports from filtered log data
UI Elements
Header Section
- Search Bar: Located at the top center for quick log entry searches
- Export Button: Blue "Export" button for downloading log data
- Reports Button: Light blue "Reports" button for generating custom reports
- Close Filter Button: Green "X" button for closing the filter panel
Main Data Table
The central table displays log entries with the following columns:
- Created: Timestamp of when the event occurred (with applied timestamp shown)
- Origin: Source of the event (Automatic, Manual, etc.)
- Device: Device identifier or name
-
Action: Type of action performed (Event,
Set,Boot, etc.) - Name/Variable Name: Specific parameter or event name affected
- Value: Current or new value of the parameter
- Pending: Status indicator for pending changes (shown as red circles for pending)
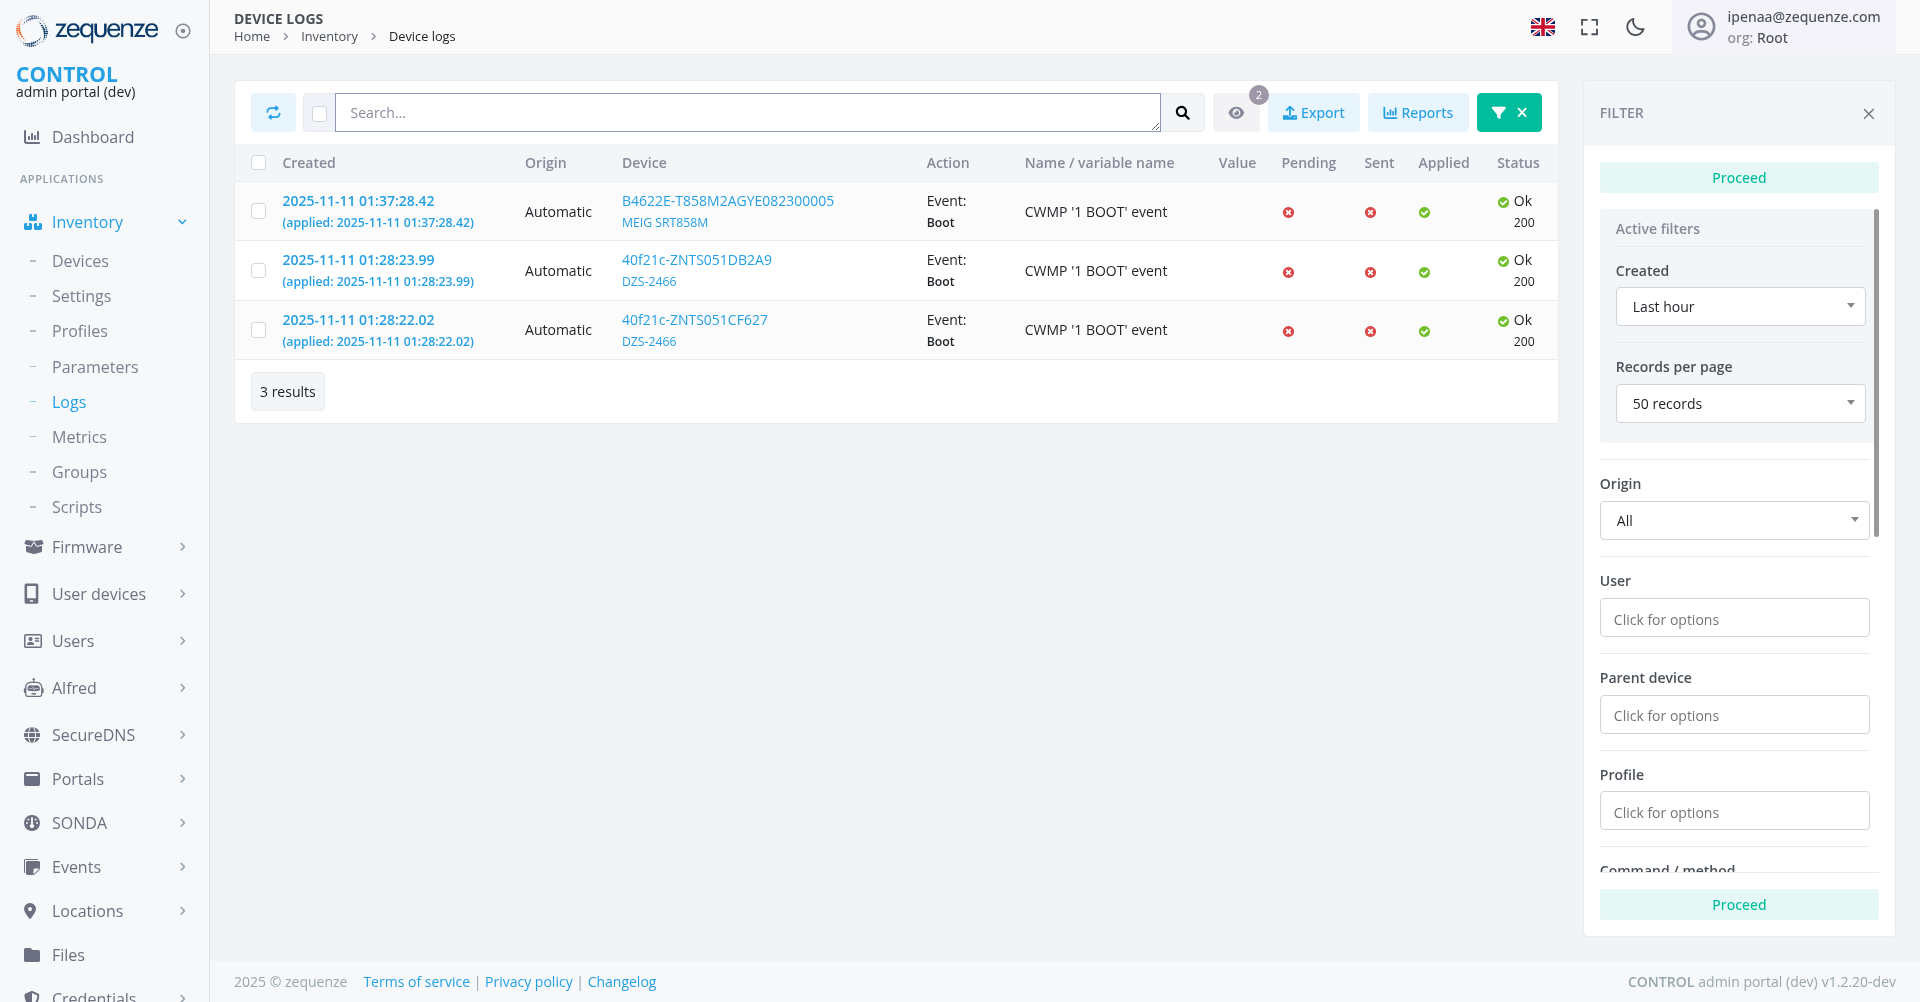
- Sent: Status indicator for transmitted changes (shown as red circles for not sent, green for sent)
Filter Panel (Right Side)
-
Process Status:
Toggle"Proceed"betweenstatusdifferentindicatorprocessingatstatesthe top
User Interactions
Searching and Filtering
- Quick Search: Enter search terms in the top search bar and click the search icon
-
Advanced Filtering:
Open theThe filter panel is expanded on the righttoshowingaccess detailedactive filtering options - Time-based Filtering: Use the "Created" filter set to "Last hour" to specify time ranges for log entries
- Multi-criteria Filtering: Combine multiple filters for precise log entry selection
Data Management
- Export Data: Click the "Export" button to download filtered log data
- Generate Reports: Use the "Reports" button to create custom analytical reports
-
Pagination: Navigate through log entries using the
records"50 records" per page selector
Event Analysis
-
Event Details:
Click on individual log entries to viewView detailed information in the expanded table columns -
Status Monitoring: Monitor
pendingPending, Sent, andsentApplied status indicators for configuration changes - Parameter Tracking: Follow specific parameter changes across time with complete status visibility
Navigation
Access Path
Related Sections
- Dashboard: Return to main dashboard for overview
- Inventory: Access device inventory and management
- Settings: Configure logging preferences and parameters
Data Displayed
Event Types
- Boot Events: Device startup and initialization logs (CWMP "BOOT" events shown)
- Configuration Changes: Parameter modifications and updates
- Network Events: Connectivity and communication logs
- System Events: Operational status and health indicators
Information Categories
- CWMP Events: TR-069 protocol-related activities (CWMP "1 BOOT" events displayed)
-
Device Configuration:
WLAN,Device-specificLAN,parameters andsystem parameter changessettings - Security Settings: Password, SSID, and authentication configurations
- Network Parameters: Channel, frequency, and connectivity settings
Actions Available
Primary Actions
- Search: Filter and locate specific log entries
- Export: Download log data in various formats
- Generate Reports: Create analytical reports from log data
- Close Filters: Hide the filter panel using the close button
Administrative Functions
- Event Tracking: Monitor device behavior and performance
- Troubleshooting: Identify and diagnose network issues
- Compliance Monitoring: Track configuration compliance and changes
- Audit Trail: Maintain records of all device modifications
Notes/Tips
- Real-time Updates: The log view updates automatically to show new events (currently showing 3 results)
-
Color Coding: Status indicators use color coding (
red/green)red for pending/not sent, green for applied/sent) for quick visual assessment - Filter Persistence: Applied filters remain active during the session and are visible in the expanded filter panel
-
Timestamp Precision: All events include precise timestamps
forwithaccurateappliedchronologicaltimestampstrackingshown in blue - Device Identification: Each log entry clearly identifies the source device and affected parameters
-
Status Indicators:
PayMultipleattention to "Pending" and "Sent"status columnsto(Pending,monitorSent,configurationApplied,deploymentStatus)statusprovide comprehensive change tracking