Dashboard: Main
Overview
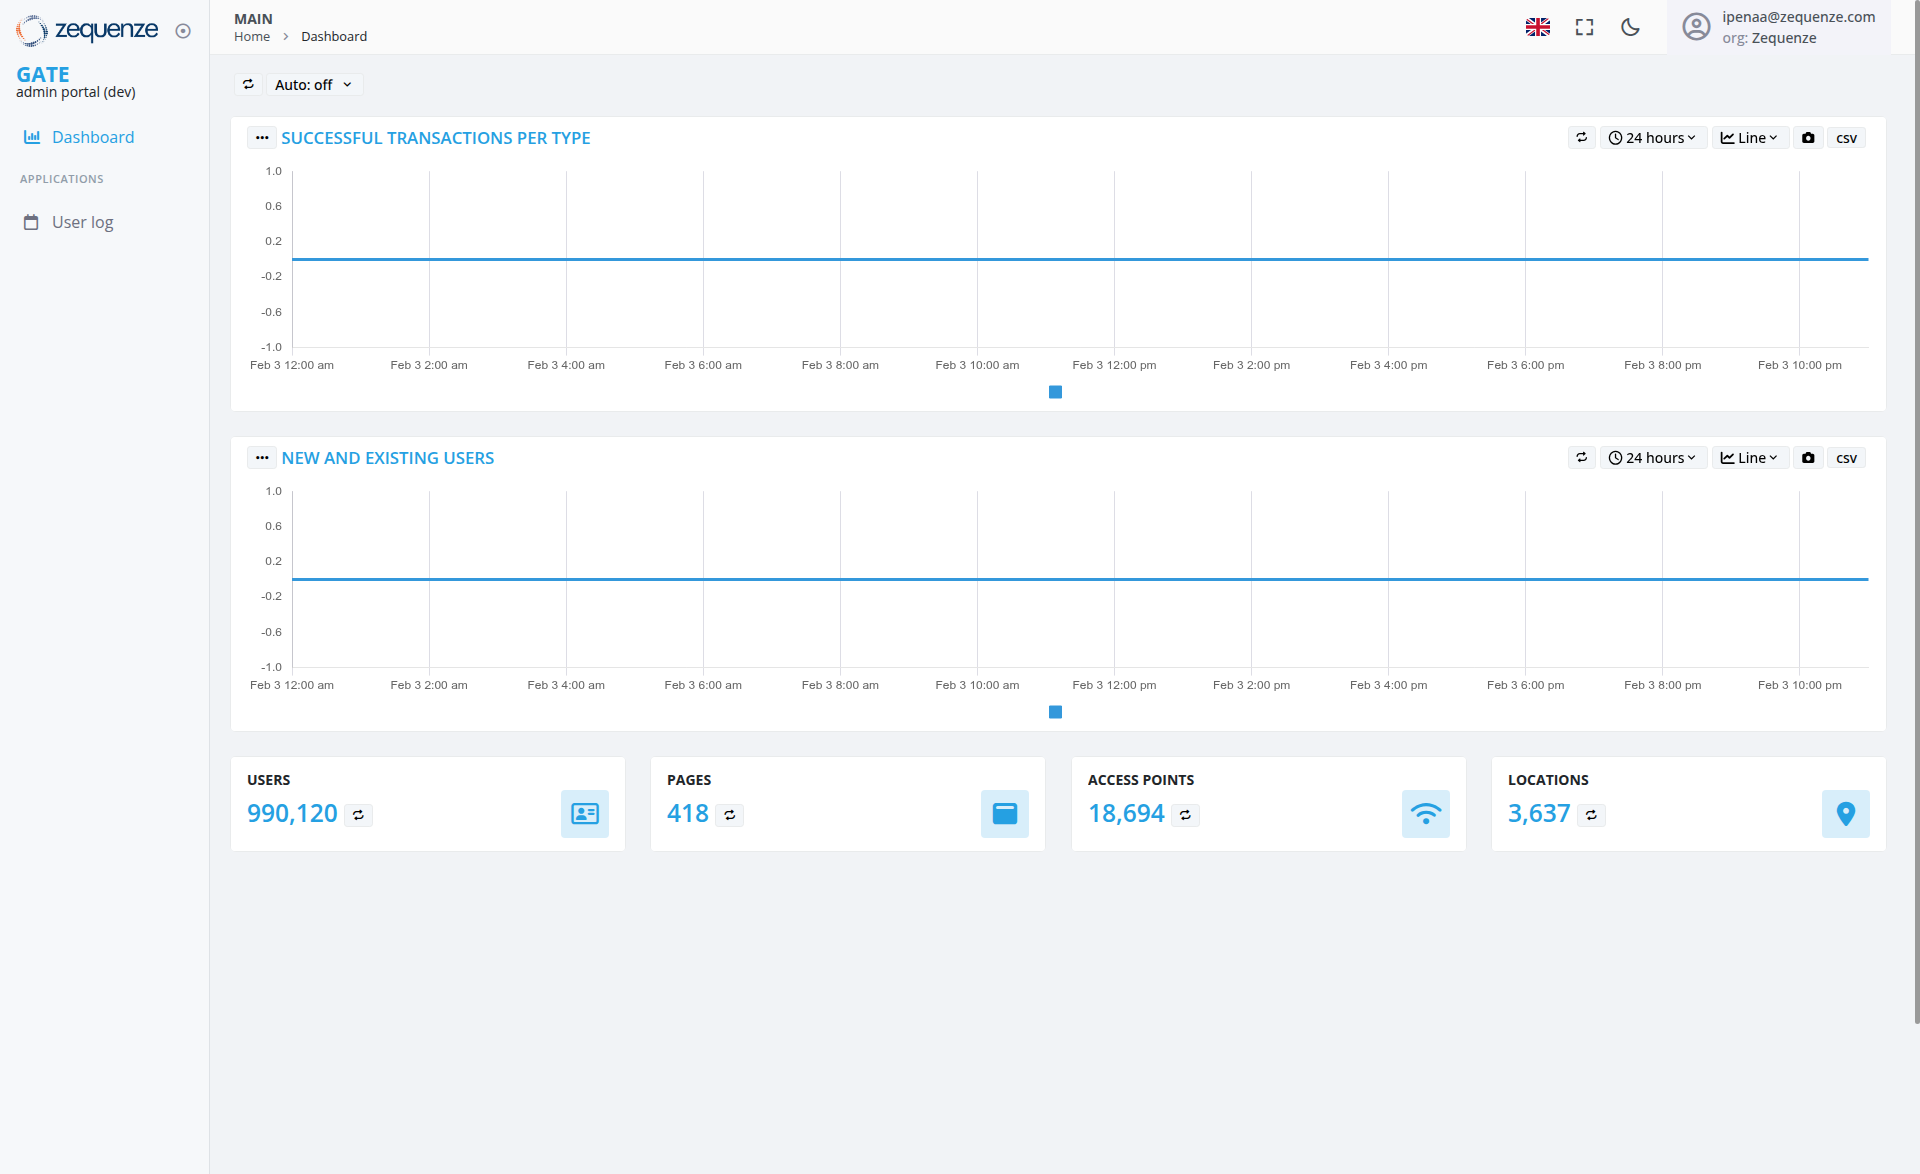
The Zequenze Control Portal Dashboard provides a comprehensive real-time analytics interface for monitoring user authentication and system activity. This main dashboard displays key performance metrics through interactive charts and summary statistics, enabling administrators to track successful transactions, user activity patterns, and system usage across different time periods.
Key Features
Real-time Analytics Charts
- Successful Transactions Per Type: Line chart showing transaction activity over time
- New and Existing Users: Line chart tracking the volume of new versus existing user activity over time
Summary Statistics Cards
-
Users:
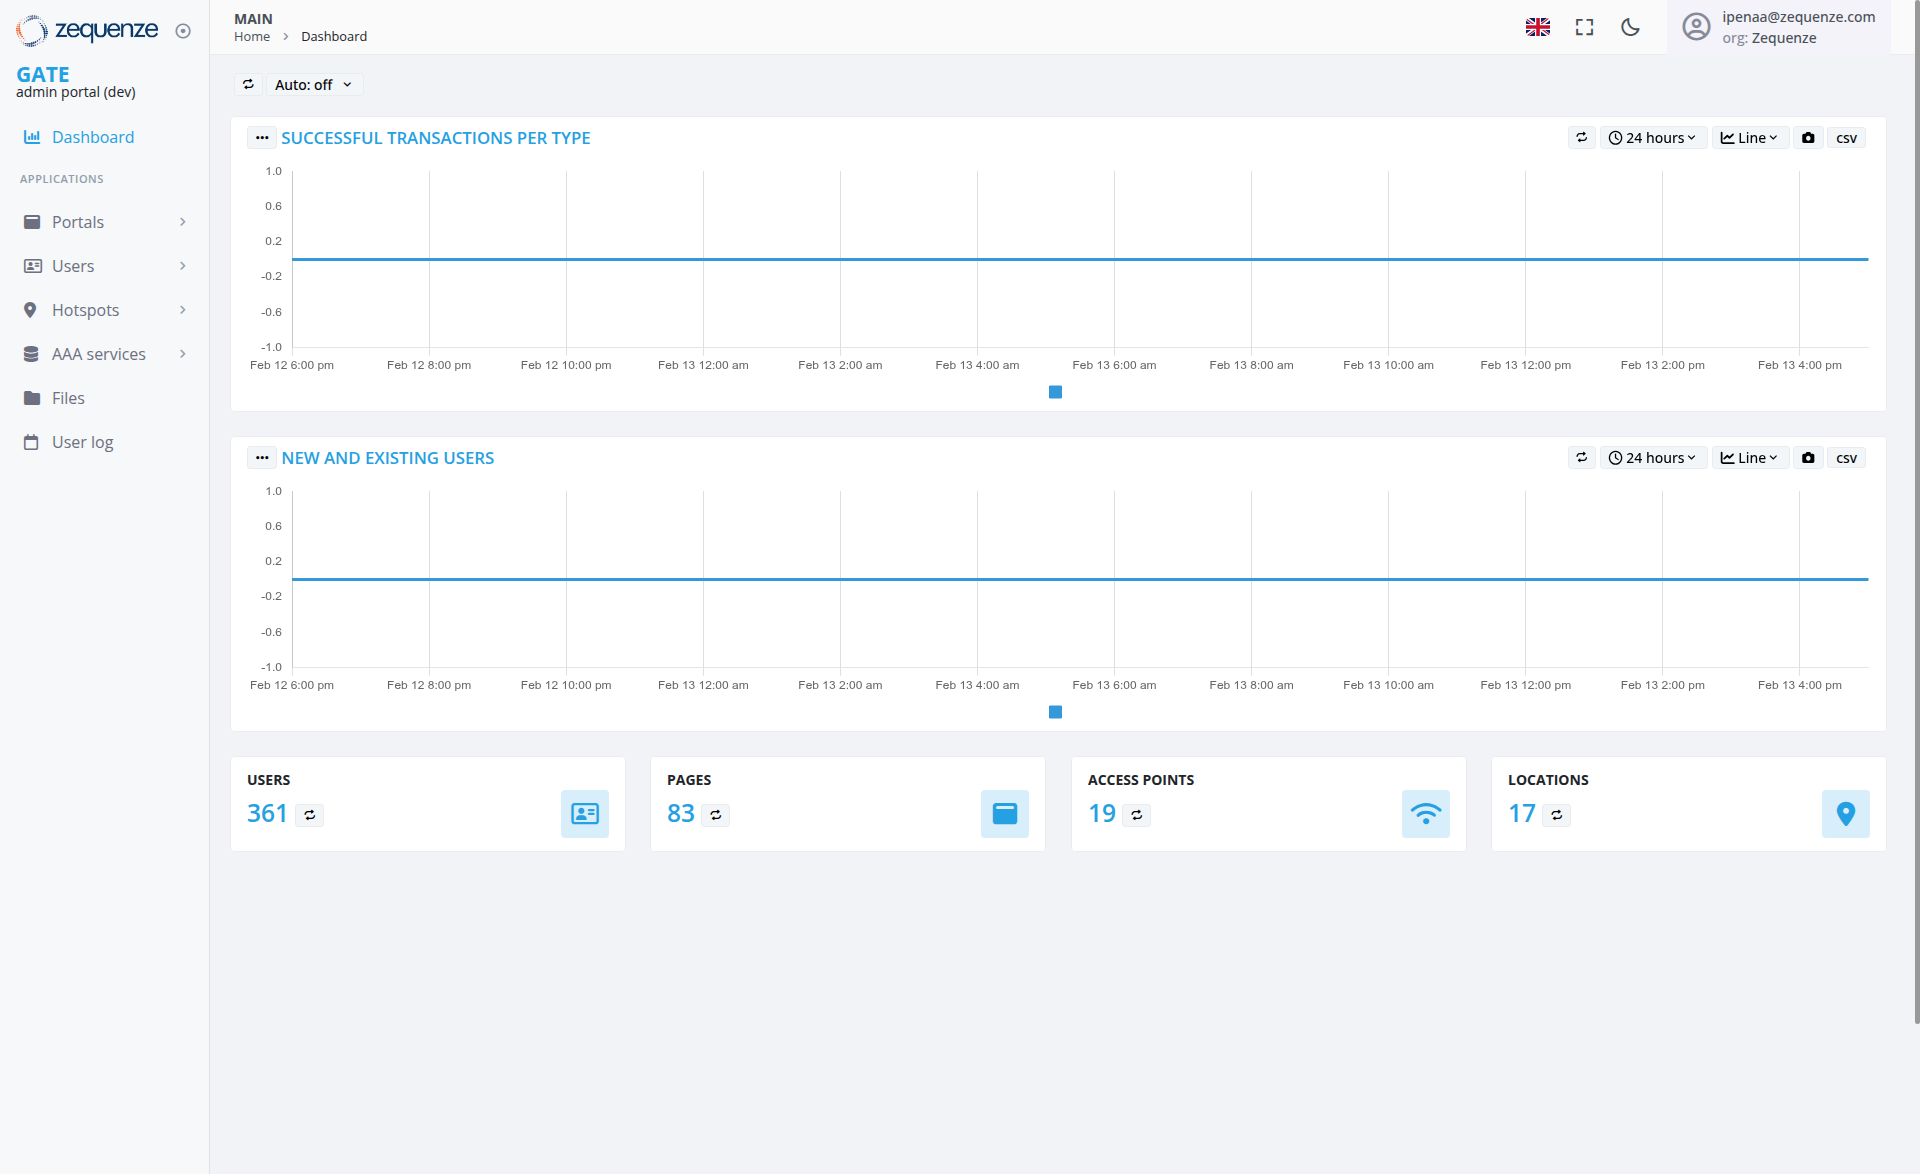
990,120361 total users with trend indicator -
Pages:
41883 total pages accessed -
Access Points:
18,69419 total access points -
Locations:
3,63717 unique locations
UI Elements
Navigation Sidebar
- GATE section with Dashboard link highlighted
-
APPLICATIONS menu including:
- Portals
Chart Controls
- Time Range Selector: "24 hours" dropdown for filtering data periods
- View Options: Line chart and CSV export functionality positioned in the top-right corner of each chart
- Auto-refresh: "Auto: off" toggle for real-time updates
User Interactions
Chart Interaction
- Hover over chart lines to view specific data points and timestamps
- Toggle between different time ranges using the dropdown selectors
- Export data to CSV format for external analysis using the CSV button in the chart header
- Switch between line and other chart view formats
Navigation
Navigation
Access Path
- Current Location: MAIN > Home > Dashboard
- Portal Environment: GATE admin portal (dev)
- User Context: Administrative access with Zequenze organization privileges
Quick Actions
- Language toggle (EN flag icon)
- Full-screen mode toggle
- Dark/light theme switcher
- User profile and settings access
Data Displayed
Transaction Metrics
The "Successful Transactions Per Type" chart shows:
-
Time Range: February
21211:6:00 pm through February3149:4:00 pm -
Activity Pattern: Flat line at approximately 0.2 level throughout the time period with a single data point spike near February
31311:4:00 am - Volume Range: Minimal activity with scale from -1.0 to 1.0
User Activity Patterns
The "New and Existing Users" chart displays:
-
Time Range: February
21211:6:00 pm through February3149:4:00 pm -
Activity Pattern: Flat line at approximately 0 level throughout the time period with a single data point near February
31311:4:00 am - Volume Range: Minimal activity with scale from -1.0 to 1.0
Actions Available
Data Management
- Export Data: Download chart data in CSV format using the CSV button in each chart's header
- Refresh Controls: Toggle auto-refresh for real-time monitoring
- Time Range Adjustment: Modify viewing period to 24 hours or other intervals
Administrative Functions
-
Access Sub-modules: Navigate to detailed sections (Portals, Users, Hotspots, AAA services, Files, User
log, etc.)log)
Notes/Tips
Performance Monitoring
- Monitor transaction activity for system usage patterns
- Track user activity for engagement analysis
- Use CSV exports for detailed offline analysis and reporting
Best Practices
- Enable auto-refresh during active monitoring sessions
- Regularly check different time ranges to identify trends
- Cross-reference summary statistics with chart data for validation
System Status
- The dashboard shows data for a development environment (gate-dev.zequenze.com)
- All metrics represent real-time or near-real-time data
- Current data shows minimal activity during the displayed time period, indicating low system usage or a quiet operational period