Dashboard: Main
Overview
The Zequenze Control Portal Dashboard provides a comprehensive real-time analytics interface for monitoring user authentication and system activity. This main dashboard displays key performance metrics through interactive charts and summary statistics, enabling administrators to track successful transactions, user activity patterns, and system usage across different time periods.
Key Features
Real-time Analytics Charts
-
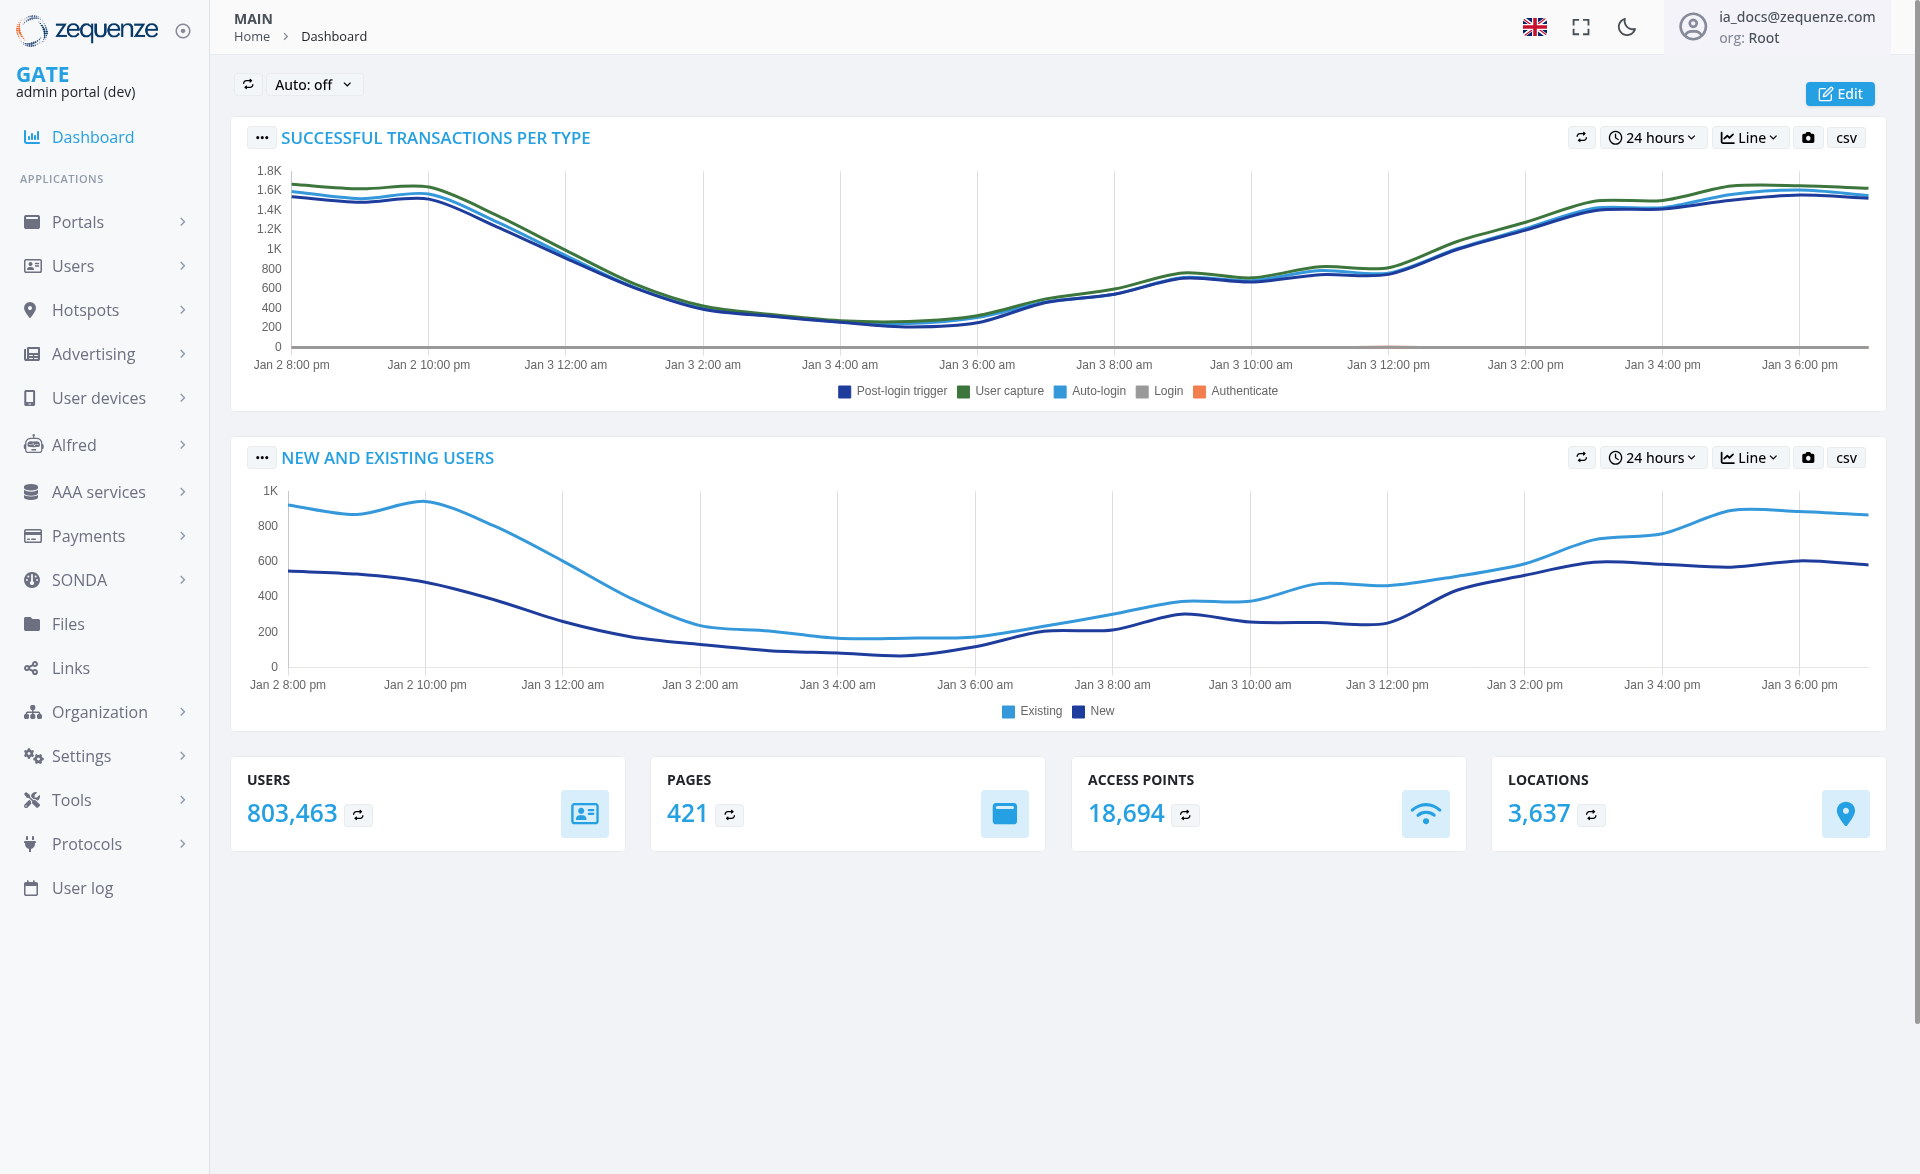
Successful Transactions Per Type:
Multi-lineLine chart showingvarioustransactionauthenticationactivitymethodsoverincluding Post-login trigger, User capture, Auto-login, Login, and Authenticatetime -
New and Existing Users:
Dual-lineLine chart tracking the volume of new versus existing user activity over time
Summary Statistics Cards
-
Users:
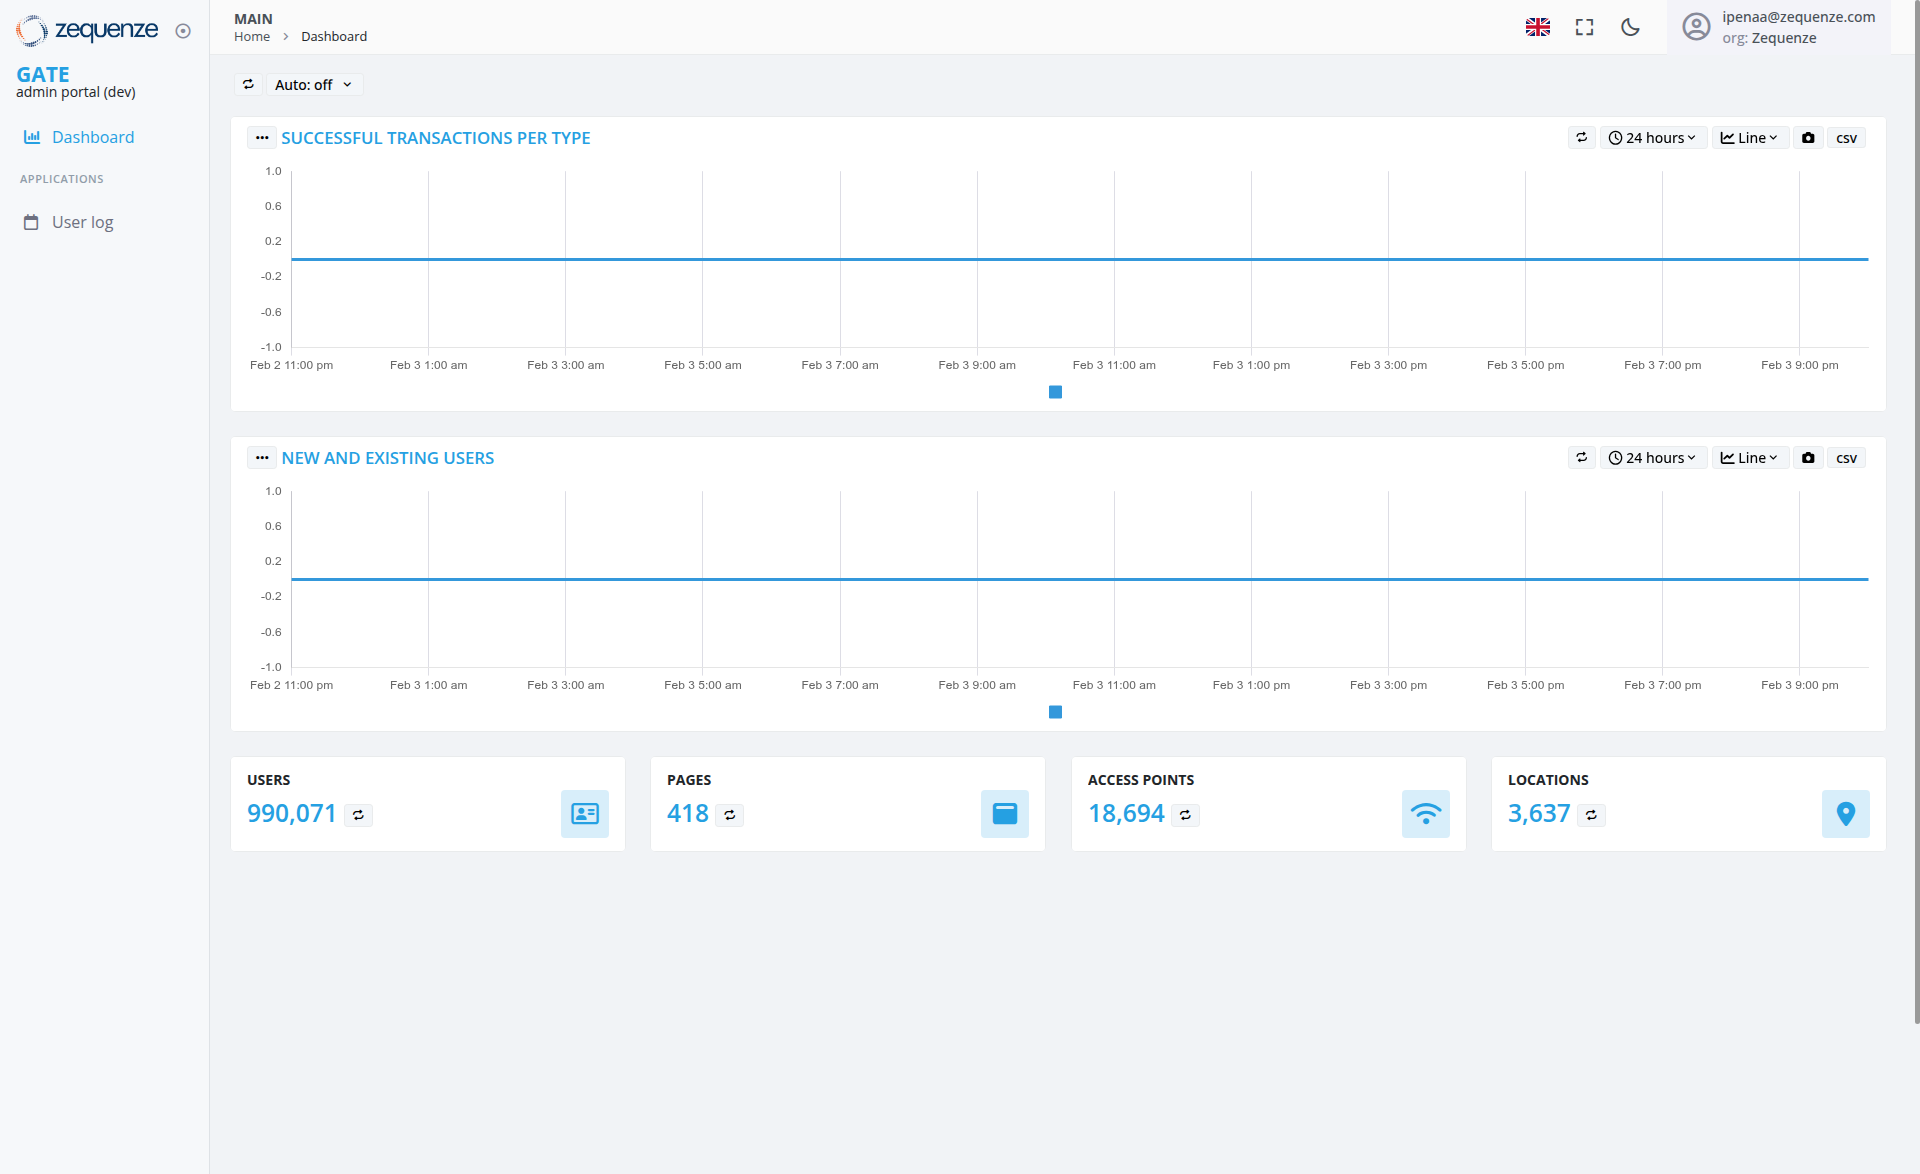
803,463990,071 total users with trend indicator -
Pages:
421418 total pages accessed - Access Points: 18,694 total access points
- Locations: 3,637 unique locations
UI Elements
Navigation Sidebar
- GATE section with Dashboard link highlighted
-
APPLICATIONS menu including:
Portals
Chart Controls
- Time Range Selector: "24 hours" dropdown for filtering data periods
- View Options: Line chart and CSV export functionality positioned in the top-right corner of each chart
- Auto-refresh: "Auto: off" toggle for real-time updates
User Interactions
Chart Interaction
- Hover over chart lines to view specific data points and timestamps
- Toggle between different time ranges using the dropdown selectors
- Export data to CSV format for external analysis using the CSV button in the chart header
- Switch between line and other chart view formats
Navigation
Navigation
Access Path
- Current Location: MAIN > Home > Dashboard
- Portal Environment: GATE admin portal (dev)
-
User Context: Administrative access with
RootZequenze organization privileges
Quick Actions
- Language toggle (EN flag icon)
- Full-screen mode toggle
- Dark/light theme switcher
- User profile and settings access
Data Displayed
Transaction Metrics
The "Successful Transactions Per Type" chart shows:
-
Peak Activity: Multiple transaction types maintaining approximately 1,400-1,500 transactions during sustained periods
User Activity Patterns
The "New and Existing Users" chart displays:
-
ExistingTimeUsersRange(light blue line):HigherFebruaryvolume,2ranging11:00150-900pmusersthroughwithFebruarypronounced3daily9:00cycles
Actions Available
Data Management
- Export Data: Download chart data in CSV format using the CSV button in each chart's header
- Refresh Controls: Toggle auto-refresh for real-time monitoring
- Time Range Adjustment: Modify viewing period to 24 hours or other intervals
Administrative Functions
-
Edit Dashboard: Customize chart layouts and configurations
Notes/Tips
Performance Monitoring
- Monitor transaction
peaksactivitytoforidentifysystemhigh-usageperiods and capacity planning needspatterns - Track
theuserratio of new vs. existing usersactivity forgrowthengagement analysis - Use CSV exports for detailed offline analysis and reporting
Best Practices
- Enable auto-refresh during active monitoring sessions
- Regularly check different time ranges to identify trends
- Cross-reference summary statistics with chart data for validation
Monitor the coordinated performance across all transaction types for system health assessment
System Status
- The dashboard shows data for a development environment (gate-dev.zequenze.com)
- All metrics represent real-time or near-real-time data
Color-coded legends help distinguish between different transaction types and user categories