Dashboard: Main
Overview
The Zequenze Control Portal Dashboard provides a comprehensive real-time analytics interface for monitoring user authentication and system activity. This main dashboard displays key performance metrics through interactive charts and summary statistics, enabling administrators to track successful transactions, user activity patterns, and system usage across different time periods.
Key Features
Real-time Analytics Charts
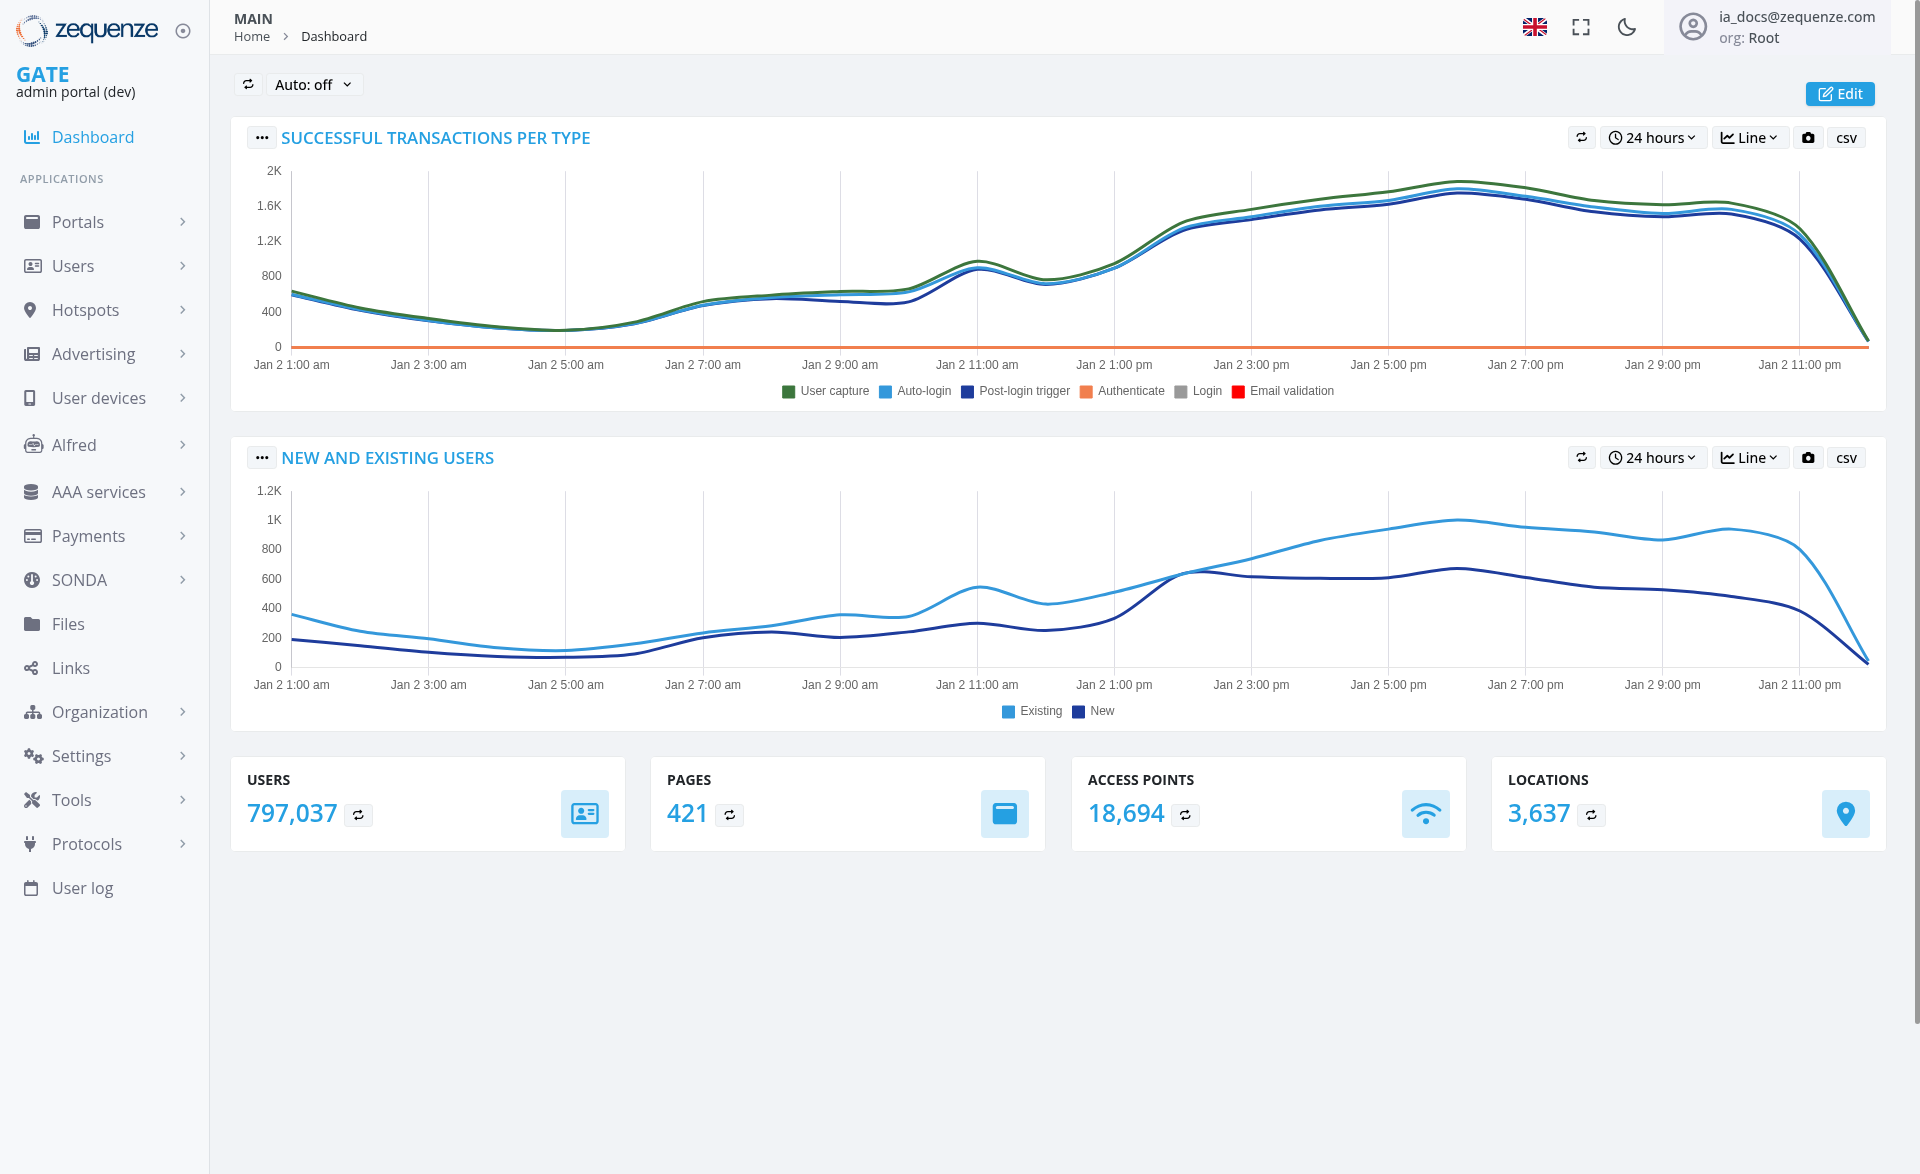
- Successful Transactions Per Type: Multi-line chart showing various authentication methods including Post-login trigger, Auto-login, User capture, Authenticate, Login, and Email validation
- New and Existing Users: Dual-line chart tracking the volume of new versus existing user activity over time
Summary Statistics Cards
-
Users:
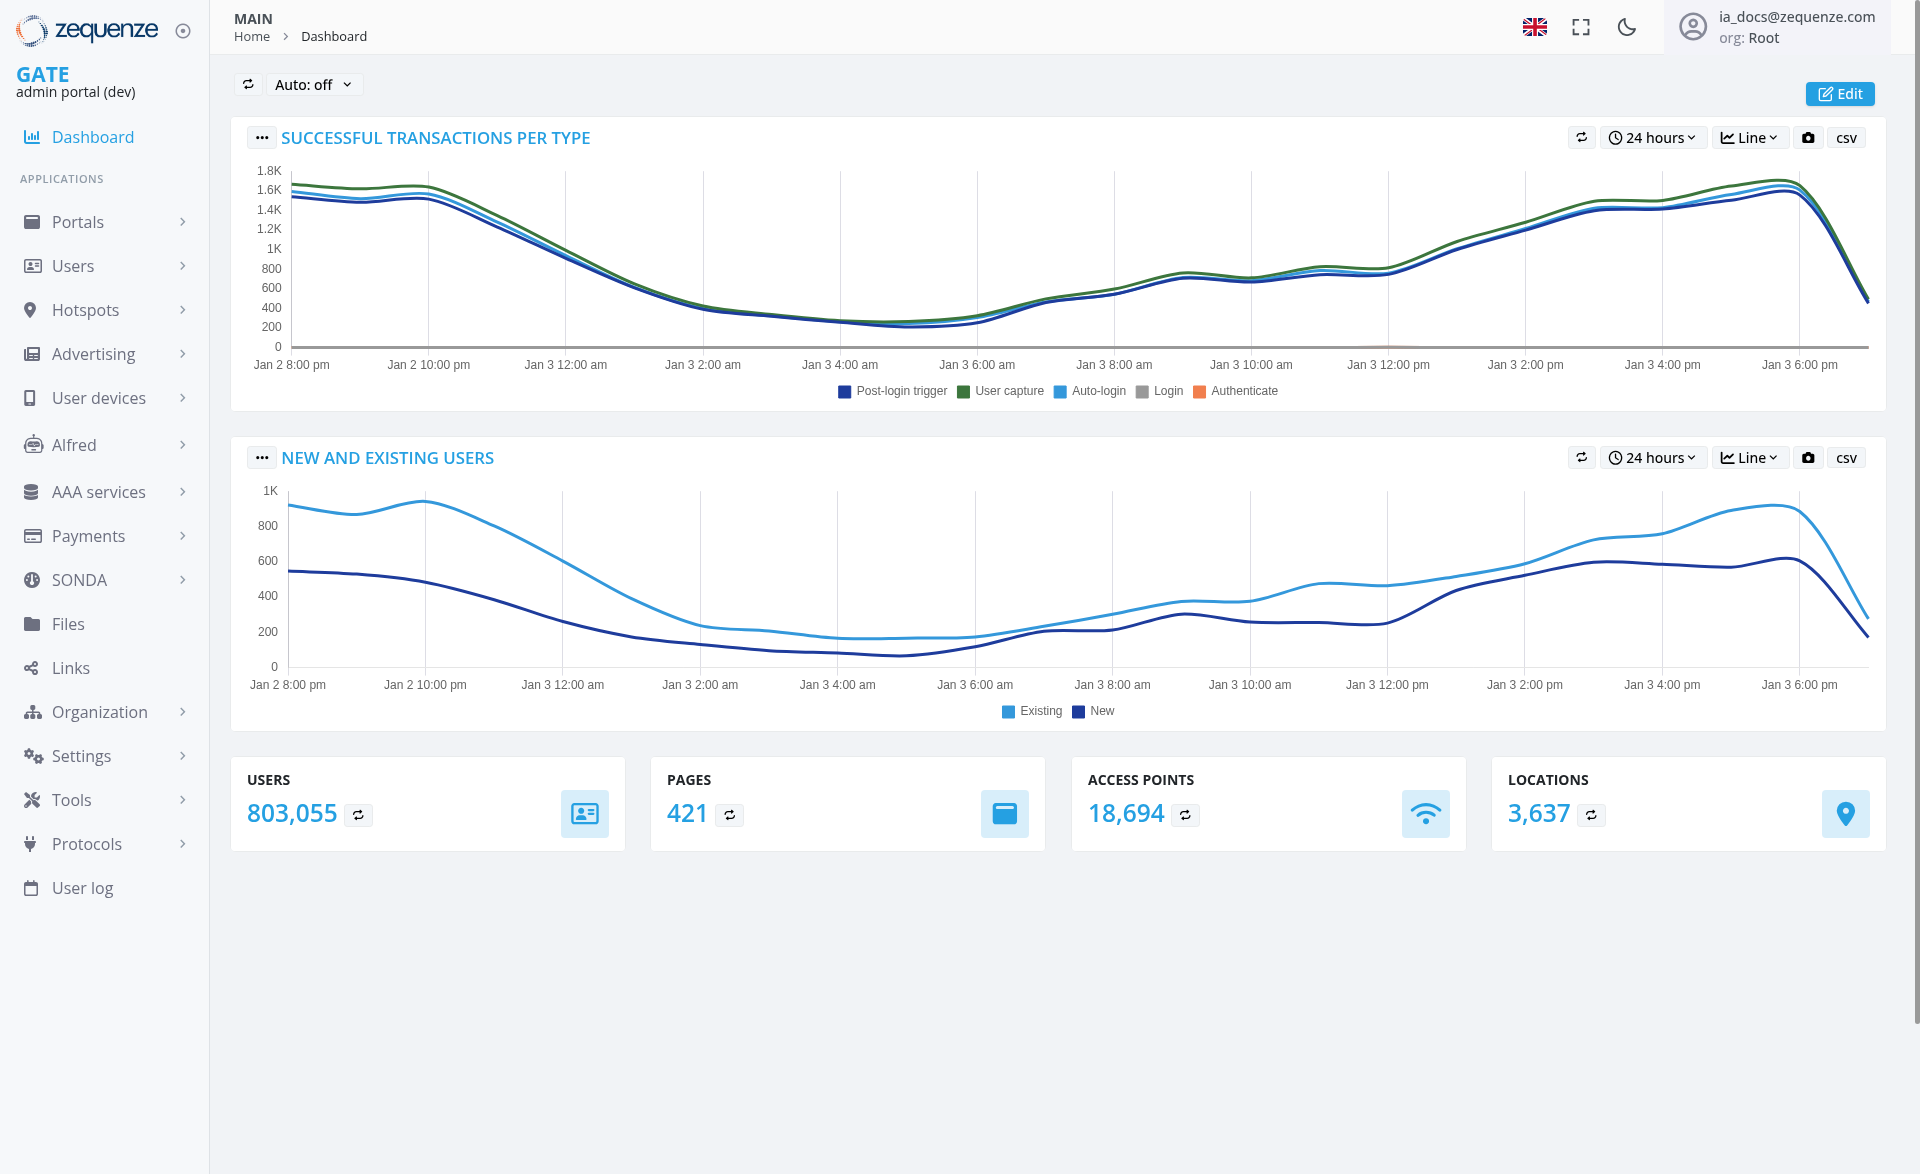
797,037803,055 total users with trend indicator - Pages: 421 total pages accessed
- Access Points: 18,694 total access points
- Locations: 3,637 unique locations
UI Elements
Navigation Sidebar
- GATE section with Dashboard link highlighted
-
APPLICATIONS menu including:
- Portals
- Users
- Hotspots
- Advertising
- User devices
- Alfred
- AAA services
- Payments
- SONDA
- Files
- Links
- Organization
- Settings
- Tools
- Protocols
- User log
Chart Controls
- Time Range Selector: "24 hours" dropdown for filtering data periods
- View Options: Line chart and CSV export functionality positioned in the top-right corner of each chart
- Auto-refresh: "Auto: off" toggle for real-time updates
- Edit Mode: Available through the "Edit" button in the top-right corner
User Interactions
Chart Interaction
- Hover over chart lines to view specific data points and timestamps
- Toggle between different time ranges using the dropdown selectors
- Export data to CSV format for external analysis using the CSV button in the chart header
- Switch between line and other chart view formats
Navigation
Navigation
Access Path
- Current Location: MAIN > Home > Dashboard
- Portal Environment: GATE admin portal (dev)
- User Context: Administrative access with Root organization privileges
Quick Actions
- Language toggle (EN flag icon)
- Full-screen mode toggle
- Dark/light theme switcher
- User profile and settings access
Data Displayed
Transaction Metrics
The "Successful Transactions Per Type" chart shows:
-
Peak Activity: Multiple transaction types reaching approximately 1,
600400 transactions during peak periods - Transaction Types: Color-coded lines representing different authentication flows with User capture (green), Auto-login (blue), Post-login trigger (orange), Authenticate (red), Login (gray), and Email validation (brown)
-
Time Range: Extended period from Jan 2
1:8:00ampm through Jan2411:6:00 pm spanning multiple days -
Volume Range: Approximately 0-1,
600400 transactions per time interval -
Notable Pattern: Activity shows
lowconsistenttransactionhigh-volumevolumestransactions around 1,200-1,400 levels during the initial period, followed by a significant decline to approximately 400-600 transactions during Jan 3 early morninghours,hours.followedThebypattern then shows steady recovery and growth throughouttheJanday3, reaching peak volumes again around 1,400-300-1,600400transactions during afternoon and evening hours,transactions, with all transaction types showing coordinated activity patterns before experiencing a sharp decline at the end of the monitoring period on Jan 4.
User Activity Patterns
The "New and Existing Users" chart displays:
-
Existing Users (light blue line): Higher volume, ranging 200-900 users with
growthpronouncedpatterndaily cycles - New Users (dark blue line): Lower volume, ranging 200-700 users following similar trends
-
Activity Trends: Both metrics show
lowclearactivitydailyaround 200 users during early morning hours (Jan 2 1:00 am), followed by steady growth throughout the daypatterns with existing users reaching peaks around 800-900 users during high-activity periods andnewdropping to approximately 200 users during low-activity periods. New users follow similar cyclical patterns, climbing to approximately 600-700 users during peakperiods,periods and declining to around 200 users during low-activity times, with both showing a sharpdeclinesdecline at the end of the monitoringperiodperiod.
Actions Available
Data Management
- Export Data: Download chart data in CSV format using the CSV button in each chart's header
- Refresh Controls: Toggle auto-refresh for real-time monitoring
- Time Range Adjustment: Modify viewing period to 24 hours or other intervals
Administrative Functions
- Edit Dashboard: Customize chart layouts and configurations
- Access Sub-modules: Navigate to detailed sections (Users, Portals, etc.)
- System Configuration: Access settings, tools, and protocols
Notes/Tips
Performance Monitoring
- Monitor transaction peaks to identify high-usage periods and capacity planning needs
- Track the ratio of new vs. existing users for growth analysis
- Use CSV exports for detailed offline analysis and reporting
- Observe daily
growthcyclical patterns indicating regular user behavior with consistentincreasesdailythroughoutpeakstheanddayvalleys
Best Practices
- Enable auto-refresh during active monitoring sessions
- Regularly check different time ranges to identify trends
- Cross-reference summary statistics with chart data for validation
- Monitor daily
growthcyclical patterns for understanding user behavior and capacity planning - Pay attention to coordinated increases across all transaction types which may indicate successful system performance
System Status
- The dashboard shows data for a development environment (gate-dev.zequenze.com)
- All metrics represent real-time or near-real-time data
- Color-coded legends help distinguish between different transaction types and user categories
- Current data shows healthy daily
growthcyclical patterns with consistent user activityincreasescyclesthroughoutacrossthemultiplemonitoring period,days, indicatingpositivestable system performance and predictable user engagement patterns