Dashboard: Main
Overview
The Zequenze ControlCONTROL Portal Dashboard provides a comprehensive monitoring and management interface for automation systems. This main dashboard view displays real-time automation logs, performance metrics, and system statistics over a 24-hour period, enabling administrators to monitor system health and automation execution status.
Key Features
Real-Time Automation Monitoring
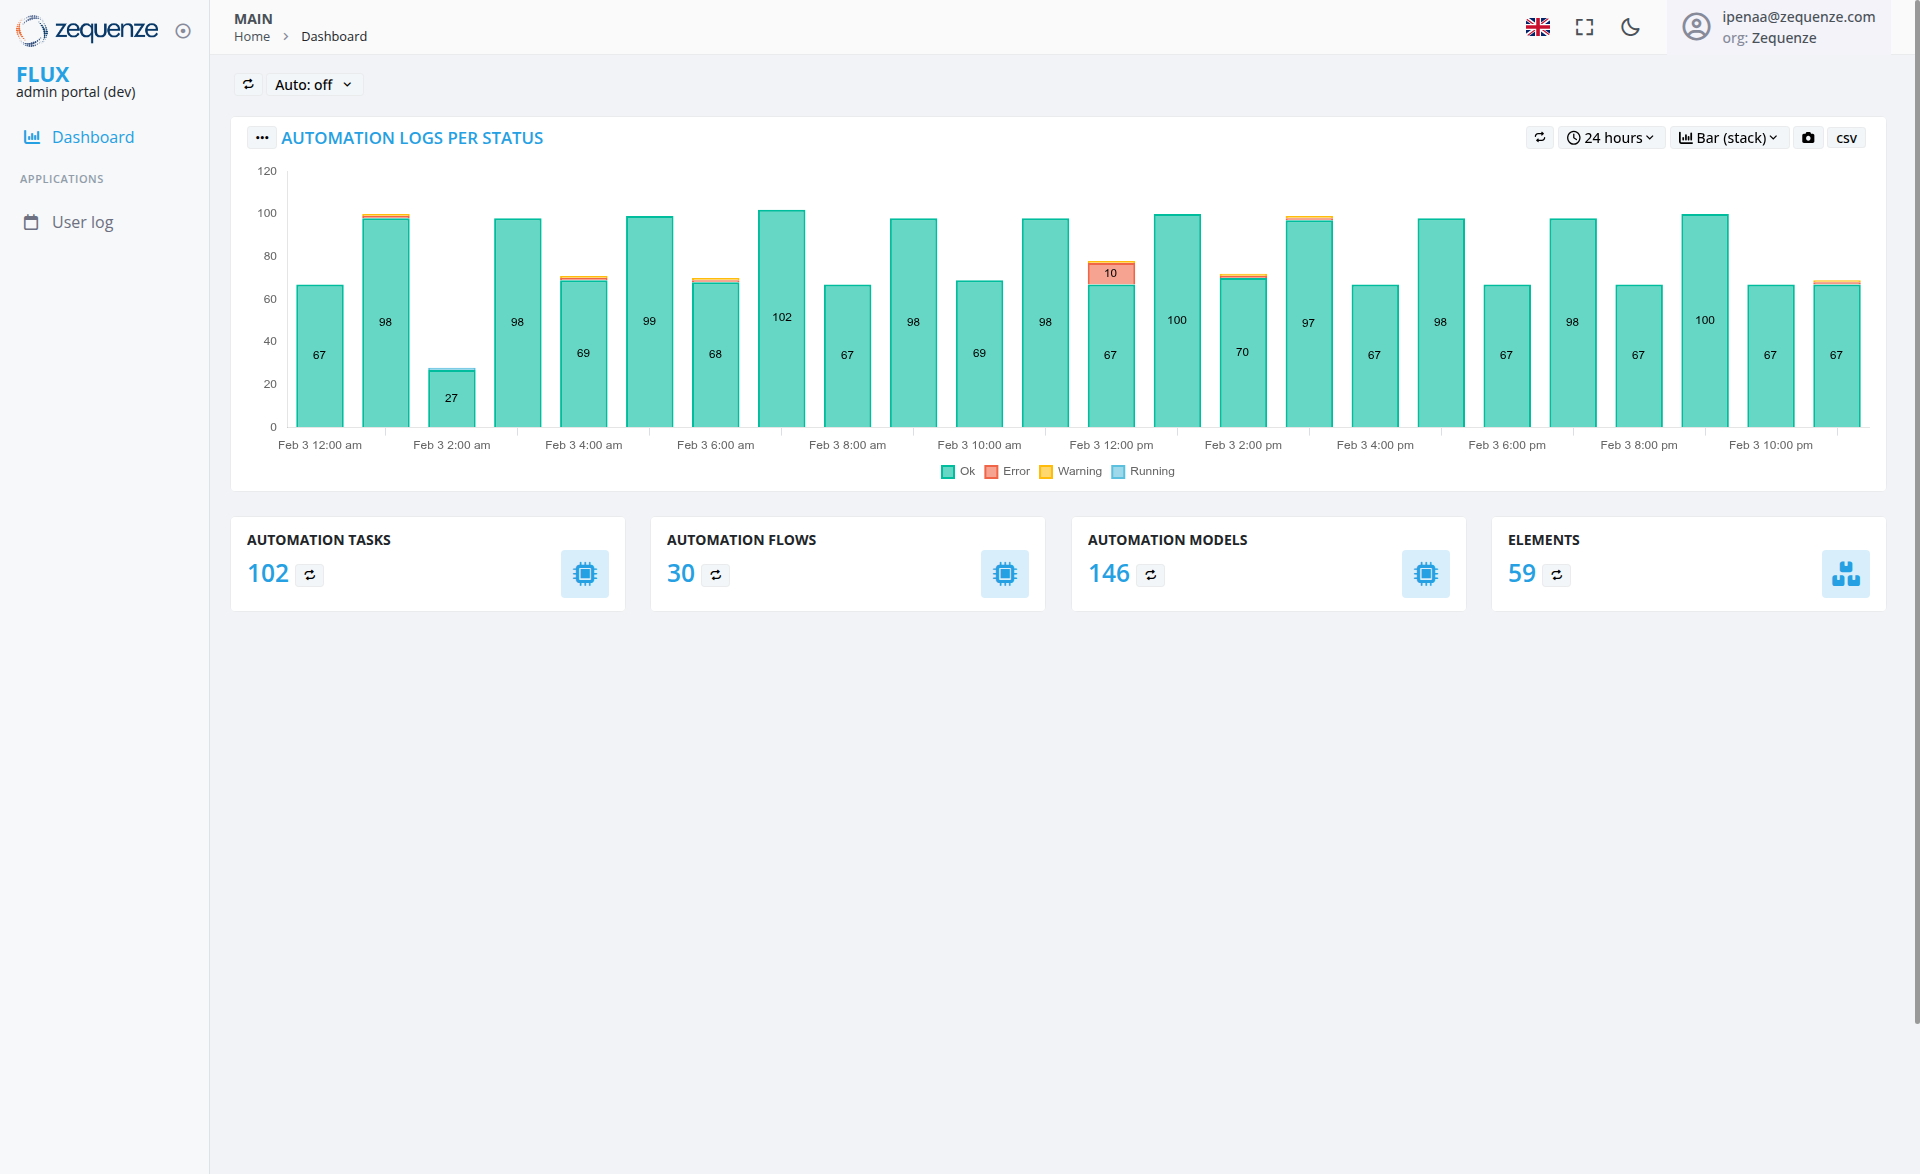
- Automation Logs Per Status Chart: Visual representation of automation execution logs displayed as stacked bar charts
-
24-Hour Time Period: Data visualization covering the last 24 hours with
hourlytwo-hour interval breakdowns - Status Color Coding: Teal/turquoise bars for "Ok" status, coral/red bars for "Error" status, with legend showing Red for Error, Yellow for Warning, Blue for Running, and Teal for Ok states
-
Numerical Data Labels: Each bar displays specific count values
(rangingforfromboth27Oktoand102Errorin the current view)statuses -
Status Distribution: Chart shows predominantly "Ok" status executions with
minimaloccasional error instances during the monitoring period
System Metrics Dashboard
Four key metric cards displaying:
-
Automation Tasks:
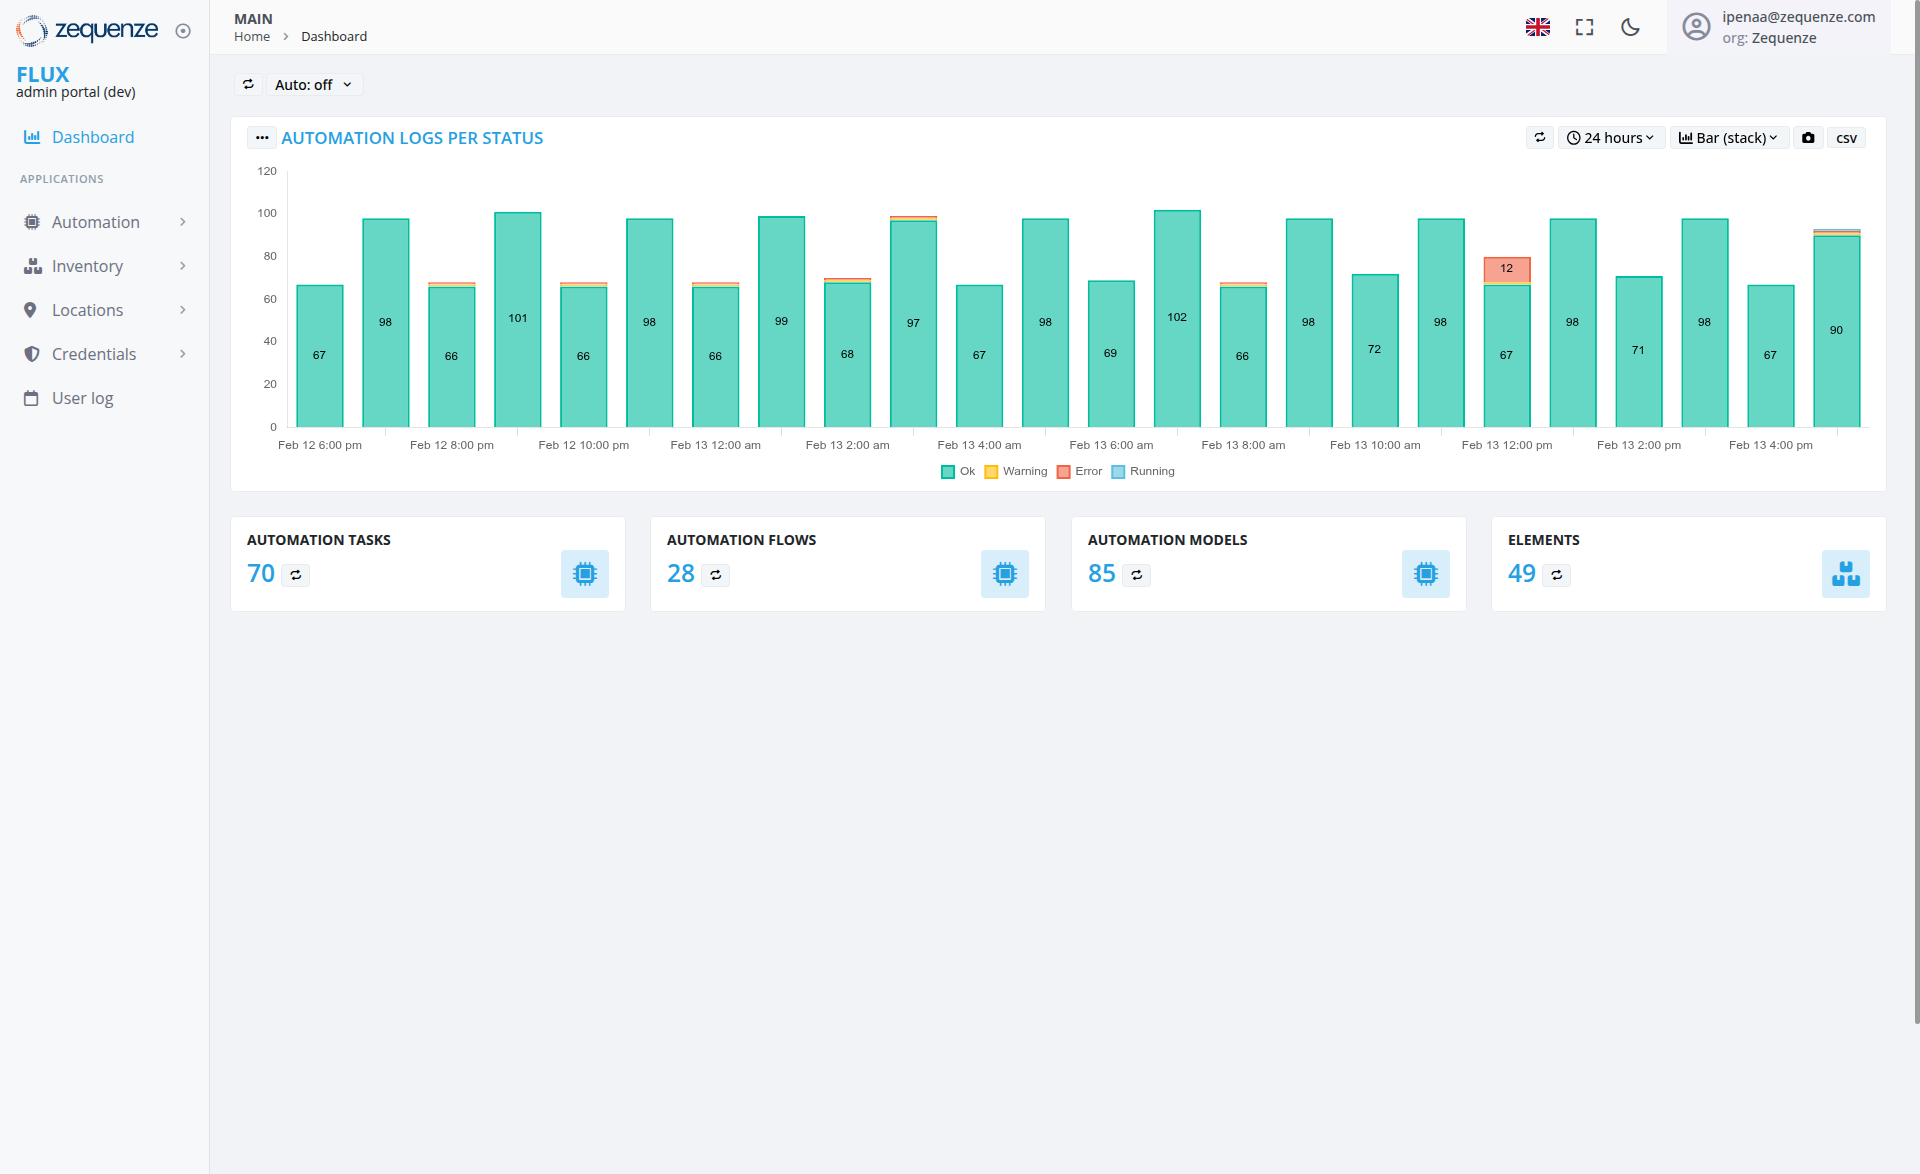
10270 total tasks -
Automation Flows:
3028 active flows -
Automation Models:
14685 configured models -
Elements:
5949 system elements
UI Elements
Navigation Sidebar
- FLUX admin portal (dev): Main system identifier
- Dashboard: Currently active section
-
Applications Section:
- Automation
- Inventory
Top Navigation Bar
Chart Controls
- Auto-refresh Toggle: Set to "Auto: off" with dropdown options
- Time Period Selector: "24 hours" with dropdown for different time ranges
- Data Export Options: "Bar (stack)" view selector and CSV export functionality
User Interactions
Dashboard Monitoring
- Real-time Data Viewing: Monitor automation execution patterns throughout the day
- Status Analysis: Identify peak automation periods and potential issues
- Time-based Filtering: Adjust time periods to view different data ranges
Navigation Options
Navigation
Access Path
-
URL:
https://flux-dev.zequenze.com/admin/ - Direct Access: Main landing page after login to the admin portal
- Breadcrumb: Home > Dashboard
Related Sections
- Automation management
Data Displayed
Automation Logs Chart
-
Time Range: February
2,12,12:6:00AMPM through February3,13,10:4:00 PM (continuous 24-hourperiod)period with two-hour intervals) -
Data Points:
HourlyTwo-hourly snapshots of automation execution throughout the full day -
Status Values: Numerical counts showing both Ok statuses (ranging from
2766 to 102executionsexecutions)perandhourError statuses (showing 12 errors at one interval) -
Activity Pattern: Generally stable automation activity with most
hoursintervals showing67-10066-102 successful executions,includingwith onesignificantintervaldipshowingto1227 executions at 2:00 AMerrors andone87warningsuccessfulinstance at 12:00 PMexecutions -
Status Indicators: Bars primarily show teal "Ok" status with one
yellowcoral/red "Warning"Error" indicatorandappearingoneasnotableadropstackedinbarvolumesegmentduringatearlyFebruarymorning13,hours12:00 PM -
Status Legend: Shows Ok (teal), Warning (yellow), Error (red)
, Warning (yellow), and Running (blue) status indicators
System Statistics
- Current Counts: Real-time metrics for all major system components
- Resource Overview: Quick assessment of system configuration and capacity
Actions Available
Dashboard Management
- Export Data: Download chart data in CSV format for external analysis
- Refresh Controls: Toggle auto-refresh or manually update data using the refresh button
- View Selection: Change between different chart visualization modes
System Navigation
- Deep Dive Analysis: Click on metric cards to access detailed management interfaces
-
UserApplicationLog AccessManagement: Navigate touserAutomation,activityInventory,loggingLocations, Credentials, or User log sections through the sidebar - Configuration Access: Navigate to settings and configuration sections
Notes/Tips
Best Practices
- Regular Monitoring: Check the automation logs chart regularly to identify patterns or anomalies
- Peak Hour Analysis: Use the two-hourly breakdown to optimize automation scheduling
- Status Monitoring: Watch for color changes in the chart bars that might indicate warnings or errors
-
Volume AnomalyError Detection: Pay attention tosignificantstackeddropsbarinsegmentsexecutionshowingvolumeerror counts thatmayindicate system issues requiring attention
Performance Insights
-
Activity Patterns: The chart shows generally stable automation execution with values between
67-66-102 successful executions perhour,two-hourwith one notable early morning dip to 27 executionsinterval -
System Health: Predominantly successful executions with
minimalonewarningerrorinstancesoccurrence (12 errors at 12:00 PM) indicating generally goodoverallsystem performance with isolated issues - Resource Planning: Use the metrics to plan for system capacity and resource allocation
- Trend Analysis: Monitor changes in automation volume over time to identify growth patterns and potential issues
System Health Indicators
-
Status Consistency: Chart shows predominantly successful executions (teal) with
onlyonewarningvisibleinstance,error cluster, indicatinggoodmostly stable system health with an isolated issue -
Volume Patterns:
LowerConsistent activityduringlevelsearlythroughoutmorningthehours24-hour(2:00periodAMwithdipvaluestoremaining27relativelyexecutions)stablefollowsbetweentypical automation scheduling patternsintervals -
MinimalErrorIssuesVisibility:SingleStackedwarningbarindicatorvisualizationshowsclearlythehighlightssystemwheniserrorsoperatingoccur,withenablingminimalquickdisruptionsidentification of problem periods - 24/7 Monitoring: Continuous data collection enables proactive system management and real-time issue identification