Dashboard: Main
Overview
The Zequenze Control Portal Dashboard provides a comprehensive monitoring and management interface for automation systems. This main dashboard view displays real-time automation logs, performance metrics, and system statistics over a 24-hour period, enabling administrators to monitor system health and automation execution status.
Key Features
Real-Time Automation Monitoring
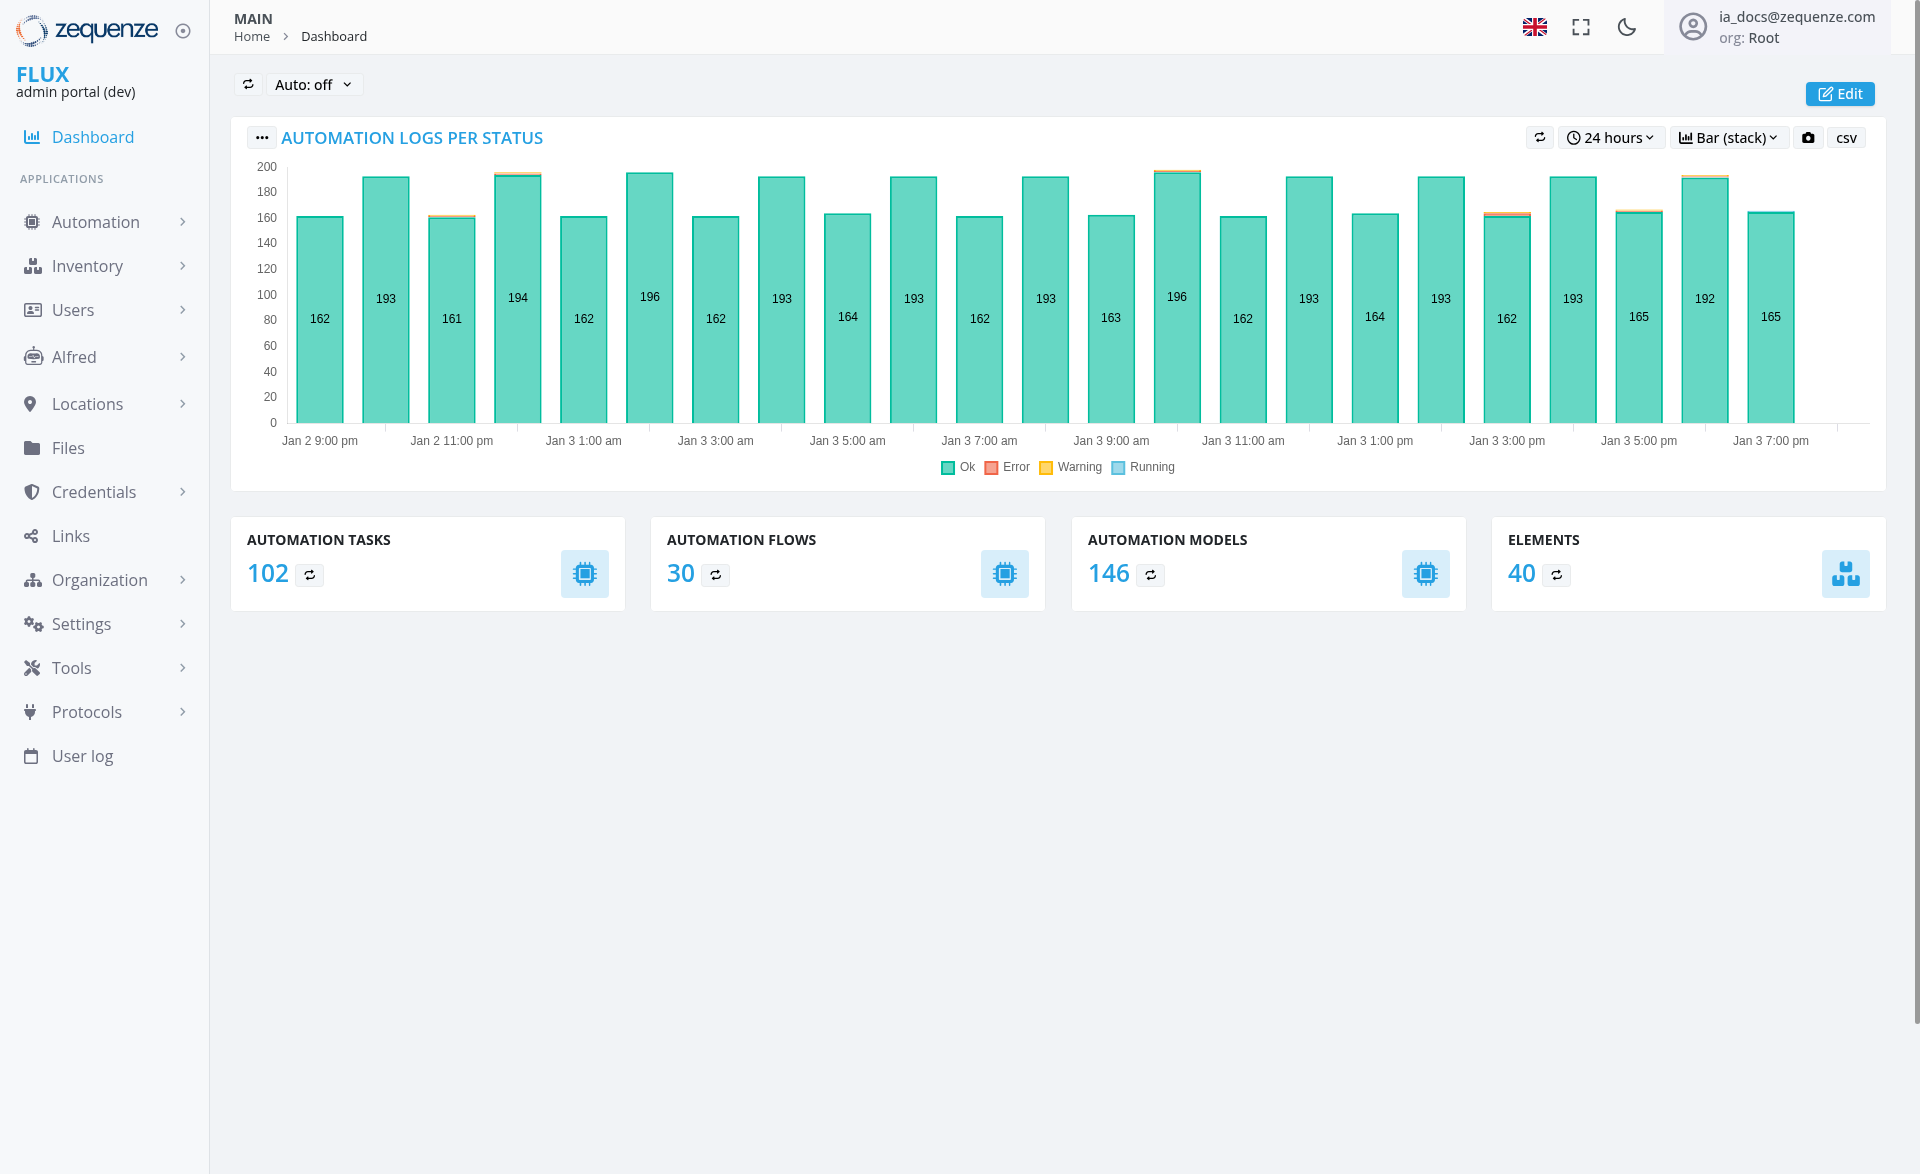
- Automation Logs Per Status Chart: Visual representation of automation execution logs displayed as stacked bar charts
- 24-Hour Time Period: Data visualization covering the last 24 hours with hourly breakdowns
- Status Color Coding: Teal/turquoise bars for "Ok" status, with legend showing Red for Error, Yellow for Warning, Blue for Running, and Teal for Ok states
-
Numerical Data Labels: Each bar displays specific count values (ranging from
16127 to196102 in the current view) -
Status Distribution: Chart shows predominantly "Ok" status executions with
consistentoneperformancenotablethroughoutdip and error instance during thetimemonitoring period
System Metrics Dashboard
Four key metric cards displaying:
- Automation Tasks: 102 total tasks
- Automation Flows: 30 active flows
- Automation Models: 146 configured models
-
Elements:
4059 system elements
UI Elements
Navigation Sidebar
- FLUX admin portal (dev): Main system identifier
Top Navigation Bar
Chart Controls
- Auto-refresh Toggle: Set to "Auto: off" with dropdown options
- Time Period Selector: "24 hours" with dropdown for different time ranges
- Data Export Options: "Bar (stack)" view selector and CSV export functionality
User Interactions
Dashboard Monitoring
- Real-time Data Viewing: Monitor automation execution patterns throughout the day
- Status Analysis: Identify peak automation periods and potential issues including system anomalies
- Time-based Filtering: Adjust time periods to view different data ranges
Navigation Options
Navigation
Access Path
-
URL:
https://flux-dev.zequenze.com/admin/ - Direct Access: Main landing page after login to the admin portal
- Breadcrumb: Home > Dashboard
Related Sections
AutomationUsermanagementlogtoolsfunctionality- System configuration settings
User and organizationAutomation managementFile and credential managementtools
Data Displayed
Automation Logs Chart
-
Time Range:
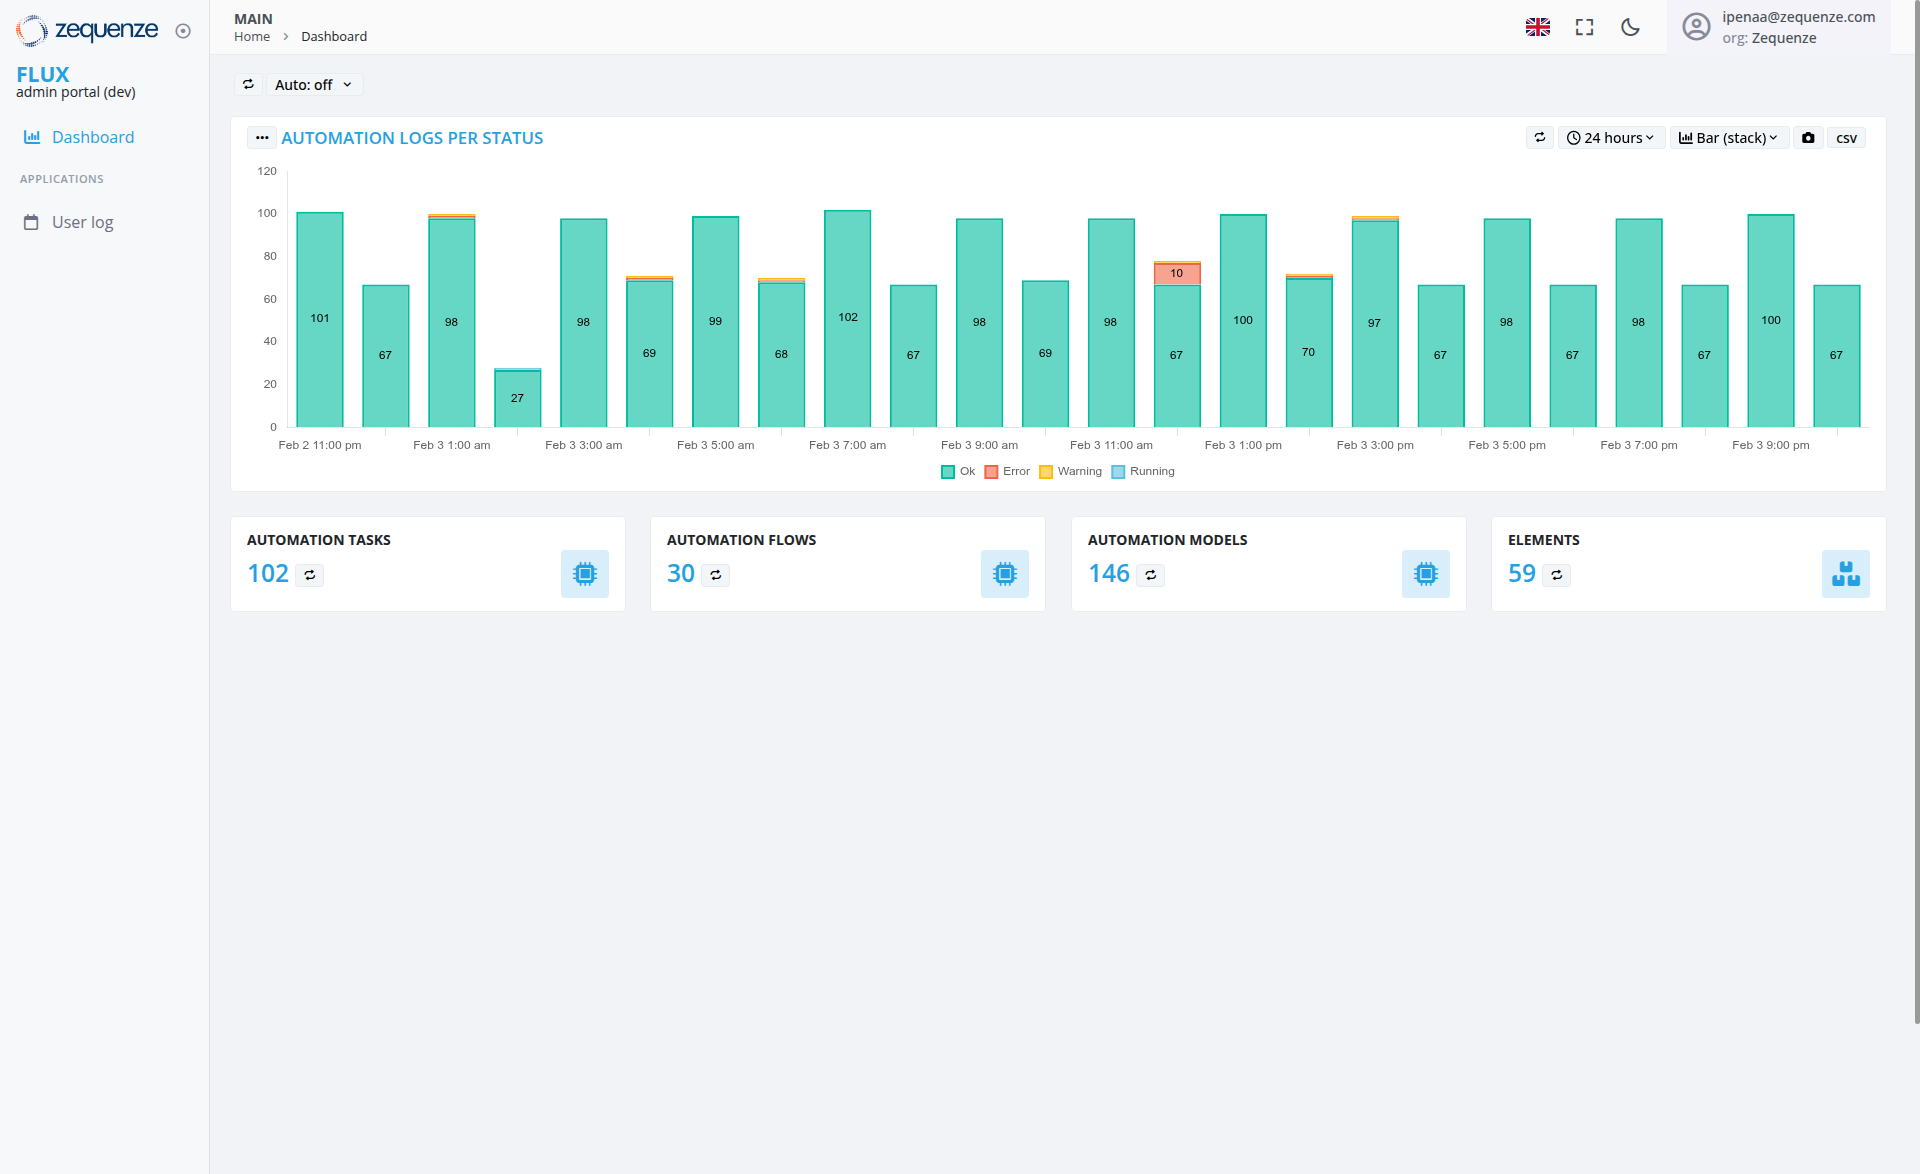
JanuaryFebruary 2,9:11:00 PM throughJanuaryFebruary 3,7:9:00 PM (24-hour period) - Data Points: Hourly snapshots of automation execution
-
Status Values: Numerical counts ranging from
16127 to196102 executions per hour -
Activity Pattern:
ConsistentVariable automation activity with most hours showing162-19667-102 executions, including one significant dip to 27 executions and one error instance -
Status Indicators: Bars
maintainprimarilythe standardshow teal "Ok" statusthroughoutwith one red "Error" bar and one yellow "Warning" indicator during the monitoring period - Status Legend: Shows Ok (teal), Error (red), Warning (yellow), and Running (blue) status indicators
System Statistics
- Current Counts: Real-time metrics for all major system components
- Resource Overview: Quick assessment of system configuration and capacity
Actions Available
Dashboard Management
-
Edit Dashboard: Customize dashboard layout and components using the Edit button
System Navigation
- Deep Dive Analysis: Click on metric cards to access detailed management interfaces
- User Log Access: Navigate to user activity logging through the sidebar
Notes/Tips
Best Practices
- Regular Monitoring: Check the automation logs chart regularly to identify patterns or anomalies
- Peak Hour Analysis: Use the hourly breakdown to optimize automation scheduling
- Status Monitoring: Watch for color changes in the chart bars that might indicate warnings or errors
- Volume Anomaly Detection: Pay attention to significant drops in execution volume that may indicate system issues
Performance Insights
-
Activity Patterns: The chart shows
consistentvariable automation execution with values between161-19627-102 per hour,demonstratingincludingstablenotablesystemanomaliesperformancethat require attention -
System
StabilityHealth:PredominantlyMix of successful executions withconsistentsometealerror"Ok"andstatuswarningdemonstrateinstanceshealthyindicatingsystemareasoperationneeding investigation - Resource Planning: Use the metrics to plan for system capacity and resource allocation
- Trend Analysis: Monitor changes in automation volume over time to identify growth patterns and potential issues
System Health Indicators
-
TealStatusBarsVariation:IndicateChart shows predominantly successfulautomationexecutionsexecutions(teal) with some error (red) and warning (yellow) instances requiring attention -
StatusVolumeLegendFluctuation: Significant variation in execution volumes indicating potential system performance issues during specific time periods