Dashboard: Main
Overview
The Zequenze Control Portal Dashboard provides a comprehensive monitoring and management interface for automation systems. This main dashboard view displays real-time automation logs, performance metrics, and system statistics over a 24-hour period, enabling administrators to monitor system health and automation execution status.
Key Features
Real-Time Automation Monitoring
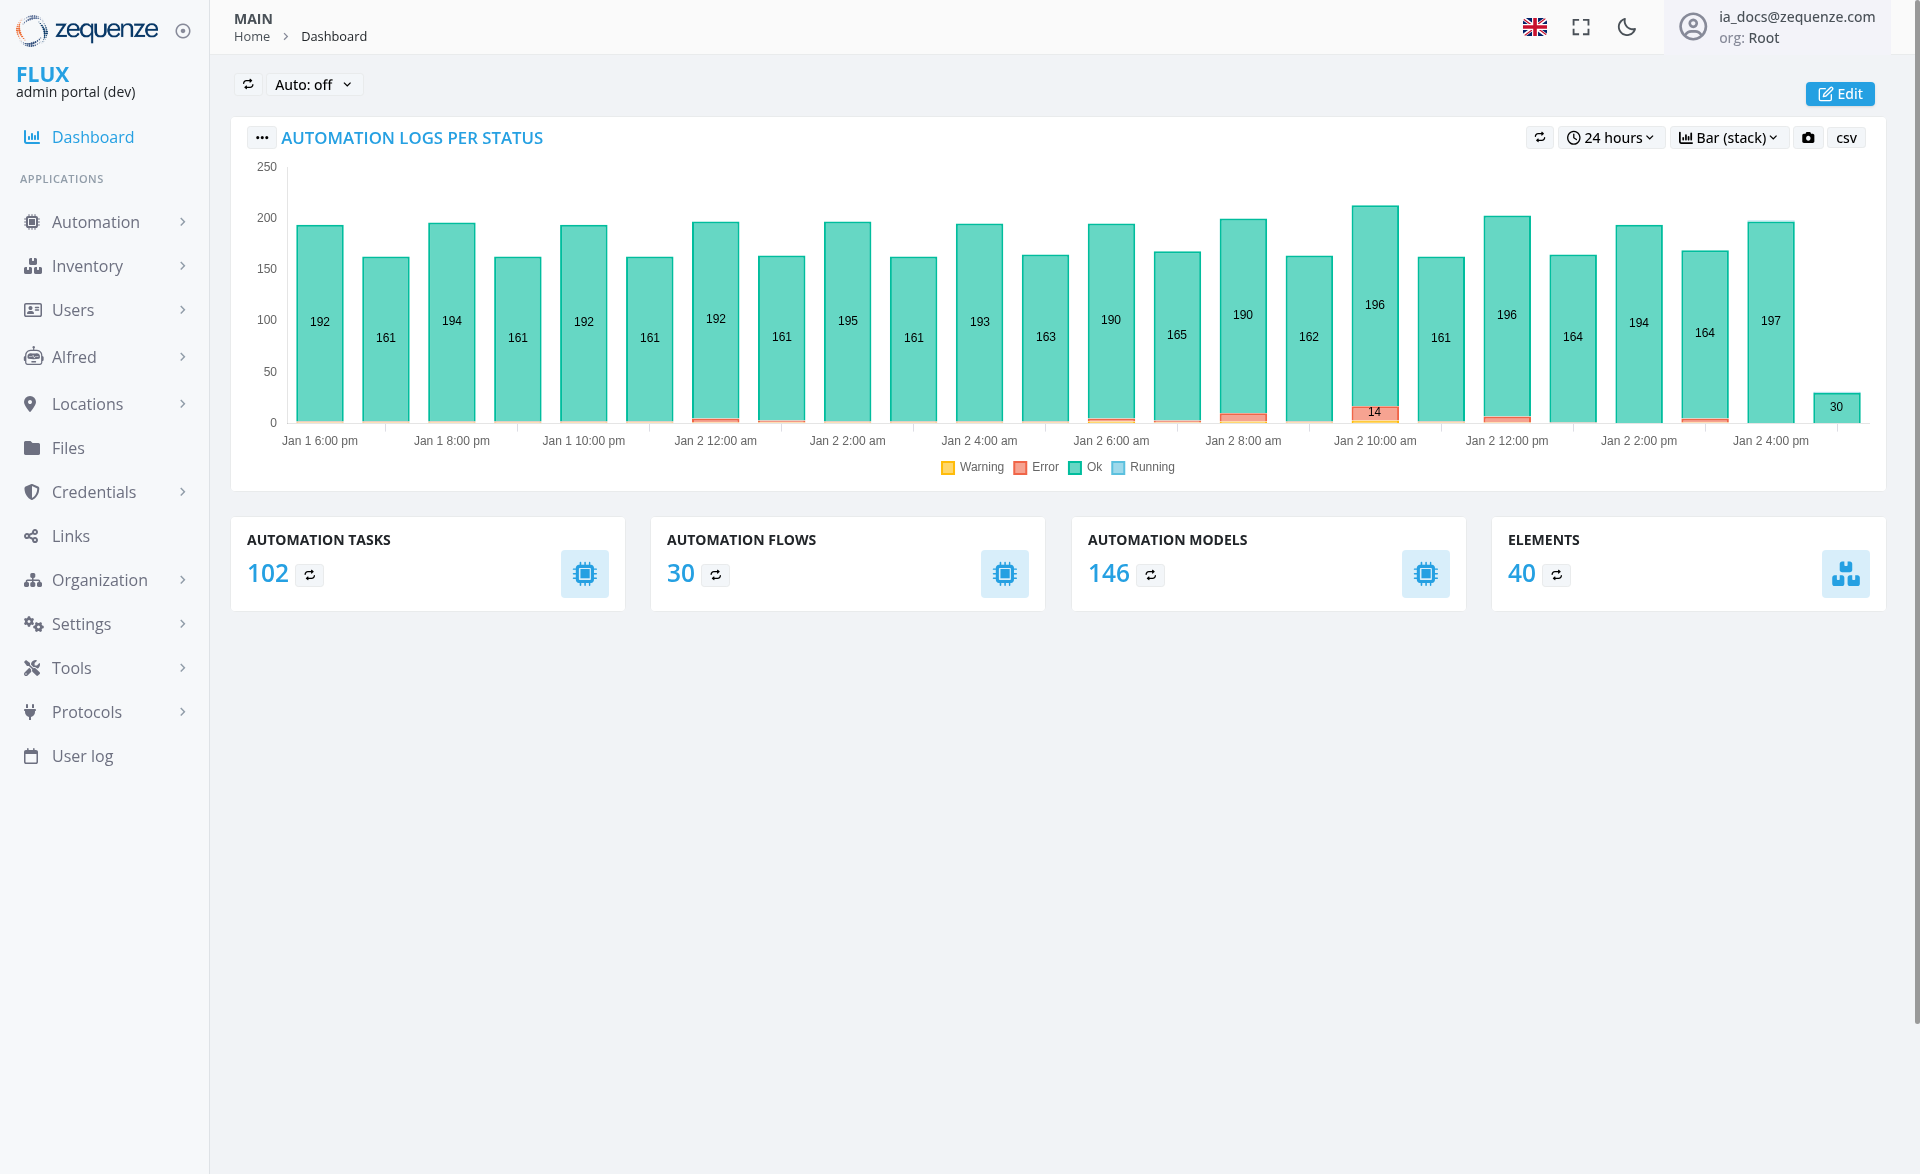
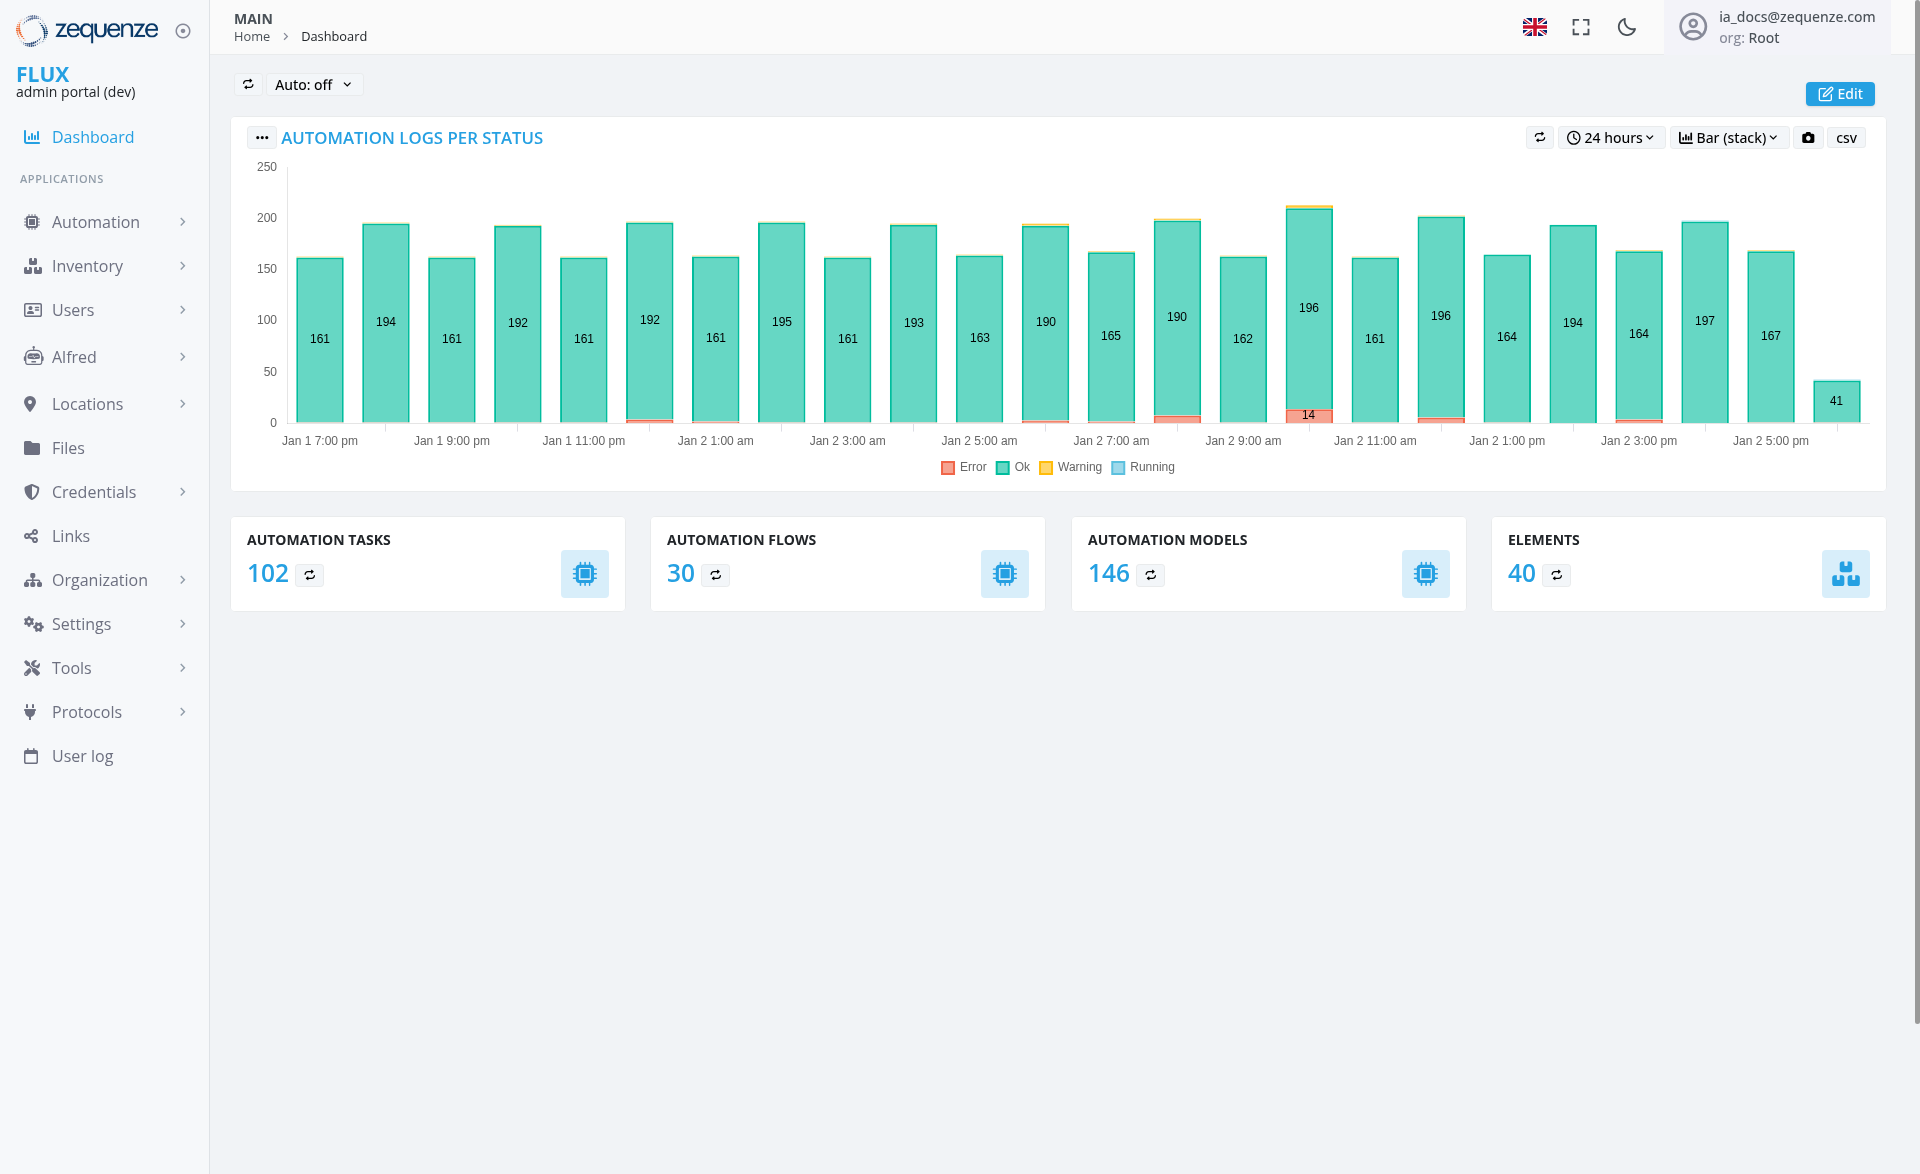
- Automation Logs Per Status Chart: Visual representation of automation execution logs displayed as stacked bar charts
- 24-Hour Time Period: Data visualization covering the last 24 hours with hourly breakdowns
- Status Color Coding: Teal/turquoise bars for "Ok" status, with legend showing Yellow for Warning, Red for Error, Teal for Ok, and Purple for Running states
- Numerical Data Labels: Each bar displays specific count values (ranging from 161 to 197 in the current view)
-
Status Distribution: Chart shows predominantly "Ok" status executions with one bar containing a small error segment and
runningmultiplesegmentsbars showing various status combinations
System Metrics Dashboard
Four key metric cards displaying:
- Automation Tasks: 102 total tasks
- Automation Flows: 30 active flows
- Automation Models: 146 configured models
- Elements: 40 system elements
UI Elements
Navigation Sidebar
-
Applications Section:
- Automation
- Inventory
- Users
- Alfred
- Locations
- Files
- Credentials
- Links
-
System Management:
- Organization
- Settings
- Tools
- Protocols
- User log
Top Navigation Bar
Chart Controls
- Auto-refresh Toggle: Set to "Auto: off" with dropdown options
- Time Period Selector: "24 hours" with dropdown for different time ranges
- Data Export Options: "Bar (stack)" view selector and CSV export functionality
User Interactions
Dashboard Monitoring
- Real-time Data Viewing: Monitor automation execution patterns throughout the day
- Status Analysis: Identify peak automation periods and potential issues
- Time-based Filtering: Adjust time periods to view different data ranges
Navigation Options
Navigation
Access Path
-
URL:
https://flux-dev.zequenze.com/admin/ - Direct Access: Main landing page after login to the admin portal
- Breadcrumb: Home > Dashboard
Related Sections
- Automation management tools
- System configuration settings
- User and organization management
- File and credential management
Data Displayed
Automation Logs Chart
-
Time Range: January 1,
6:7:00 PM through January 2,4:5:00 PM (24-hour period) - Data Points: Hourly snapshots of automation execution
- Status Values: Numerical counts ranging from 161 to 197 executions per hour
-
Activity Pattern: Consistent automation activity with a peak of 196 executions
at 10:00 AMshowing a small red error segment (marked with "14")and purple running segment (marked with "30") -
Status Indicators:
OneMultiplebarbarsdisplaysdisplay small colored segments includingared errorsegment and purple running segment,segments, whilealltheothersmajority maintain the standard teal "Ok" status -
Status Legend: Shows
Warning (yellow),Error (red), Ok (teal), Warning (yellow), and Running (purple) status indicators
System Statistics
- Current Counts: Real-time metrics for all major system components
- Resource Overview: Quick assessment of system configuration and capacity
Actions Available
Dashboard Management
- Edit Dashboard: Customize dashboard layout and components using the Edit button
- Export Data: Download chart data in CSV format for external analysis
- Refresh Controls: Toggle auto-refresh or manually update data
System Navigation
- Deep Dive Analysis: Click on metric cards to access detailed management interfaces
- Configuration Access: Navigate to settings and configuration sections
- User Management: Access user and organization management tools
Notes/Tips
Best Practices
- Regular Monitoring: Check the automation logs chart regularly to identify patterns or anomalies
- Peak Hour Analysis: Use the hourly breakdown to optimize automation scheduling
- Status Monitoring: Watch for color changes in the chart bars that might indicate warnings, errors, or running processes
- Error Detection: Pay attention to red segments in bars indicating automation failures or errors
- Running Process Monitoring: Pay attention to purple segments in bars indicating active automation processes
Performance Insights
-
Activity Patterns: The chart shows consistent automation execution with values between 161-197 per hour, with a peak of 196 executions at
10:9:00 AM -
Error Monitoring: Small red error
segmentsegments visible inoneselectbarbarsindicatesindicate minimal automation failures
System Health Indicators
- Teal Status Bars: Indicate successful automation executions
- Red Error Segments: Signal automation processes that encountered failures
- Purple Running Segments: Signal automation processes currently in execution
- Yellow Warning Segments: Indicate automation processes with warnings