Dashboard: Main
Overview
The Zequenze Control Portal Dashboard provides a comprehensive monitoring and management interface for automation systems. This main dashboard view displays real-time automation logs, performance metrics, and system statistics over a 24-hour period, enabling administrators to monitor system health and automation execution status.
Key Features
Real-Time Automation Monitoring
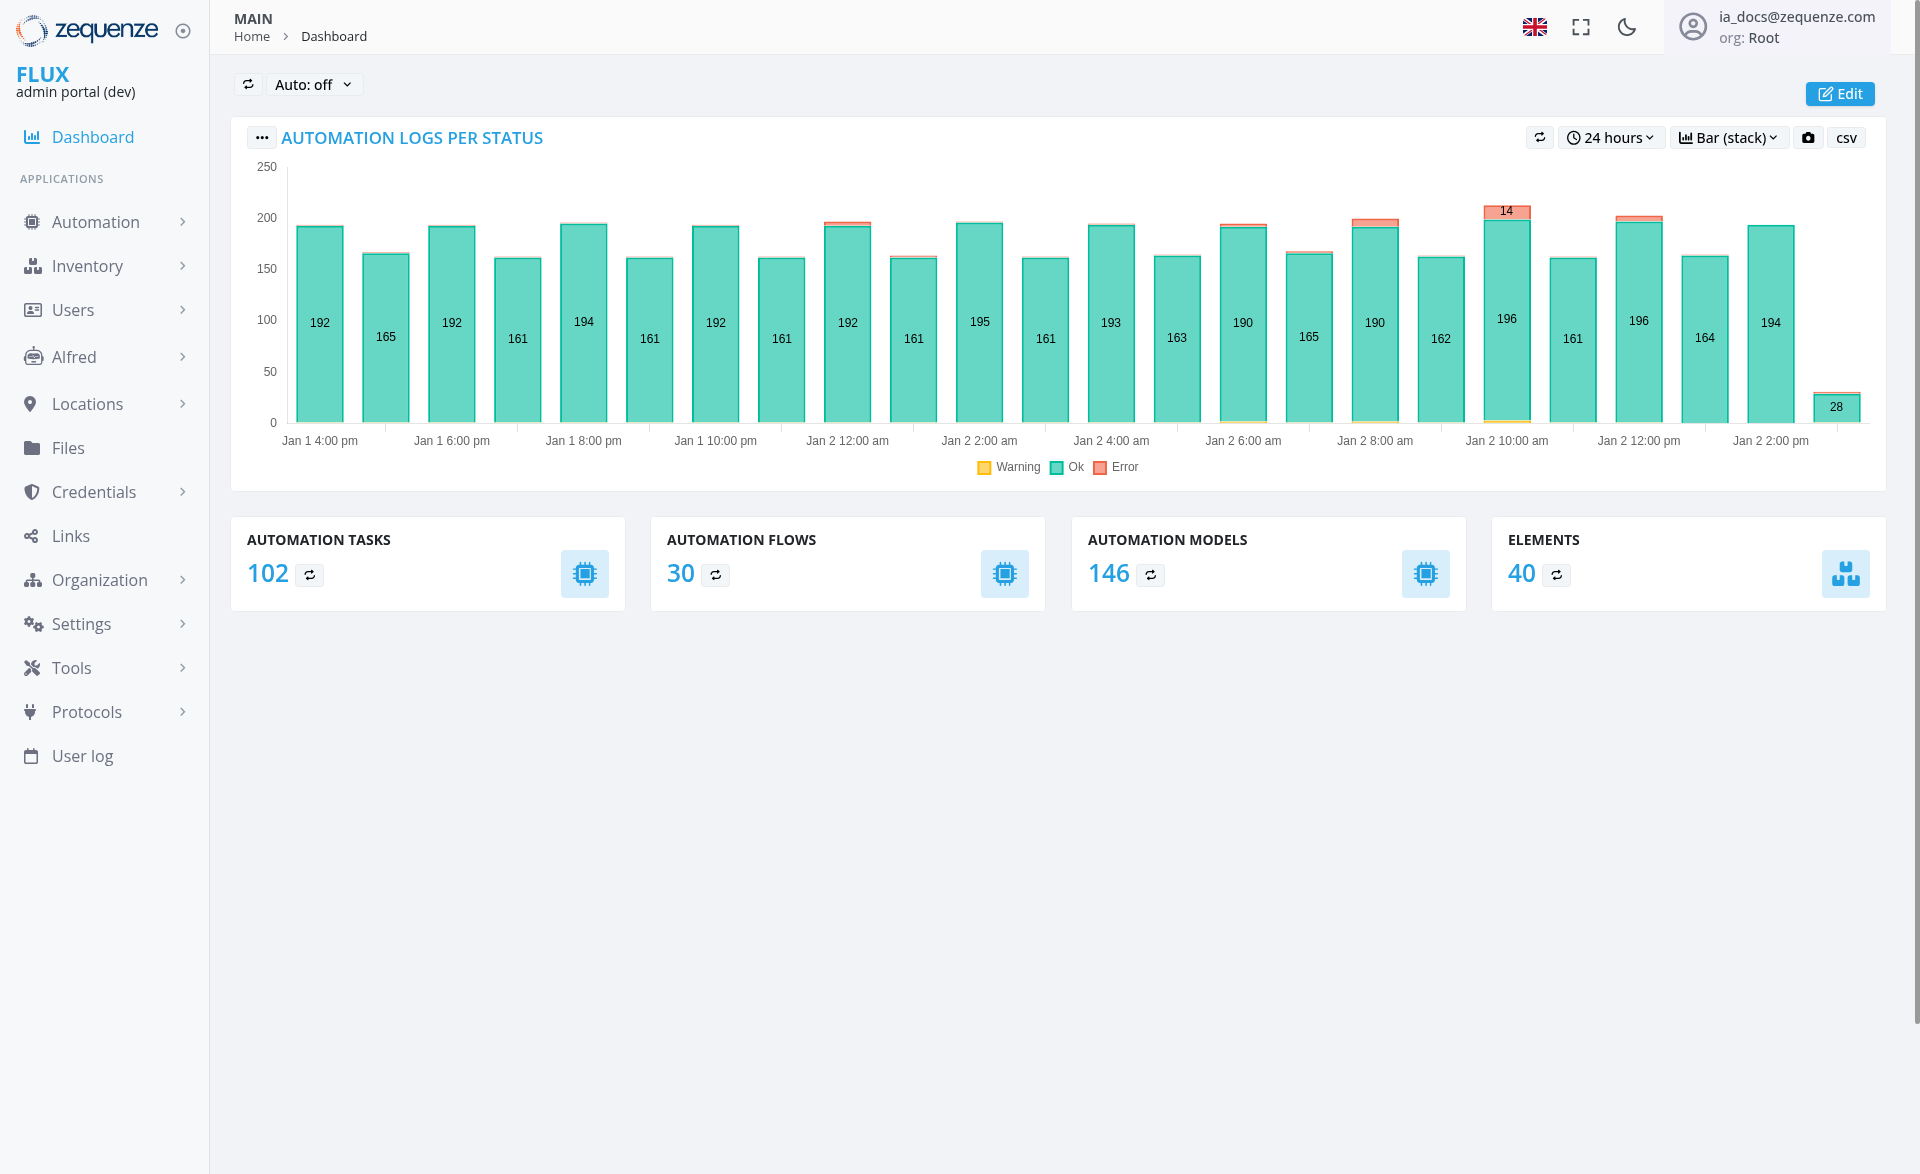
- Automation Logs Per Status Chart: Visual representation of automation execution logs displayed as stacked bar charts
- 24-Hour Time Period: Data visualization covering the last 24 hours with hourly breakdowns
- Status Color Coding: Teal/turquoise bars for "Ok" status, with legend showing Yellow for Warning, Teal for Ok, and Red for Error states
-
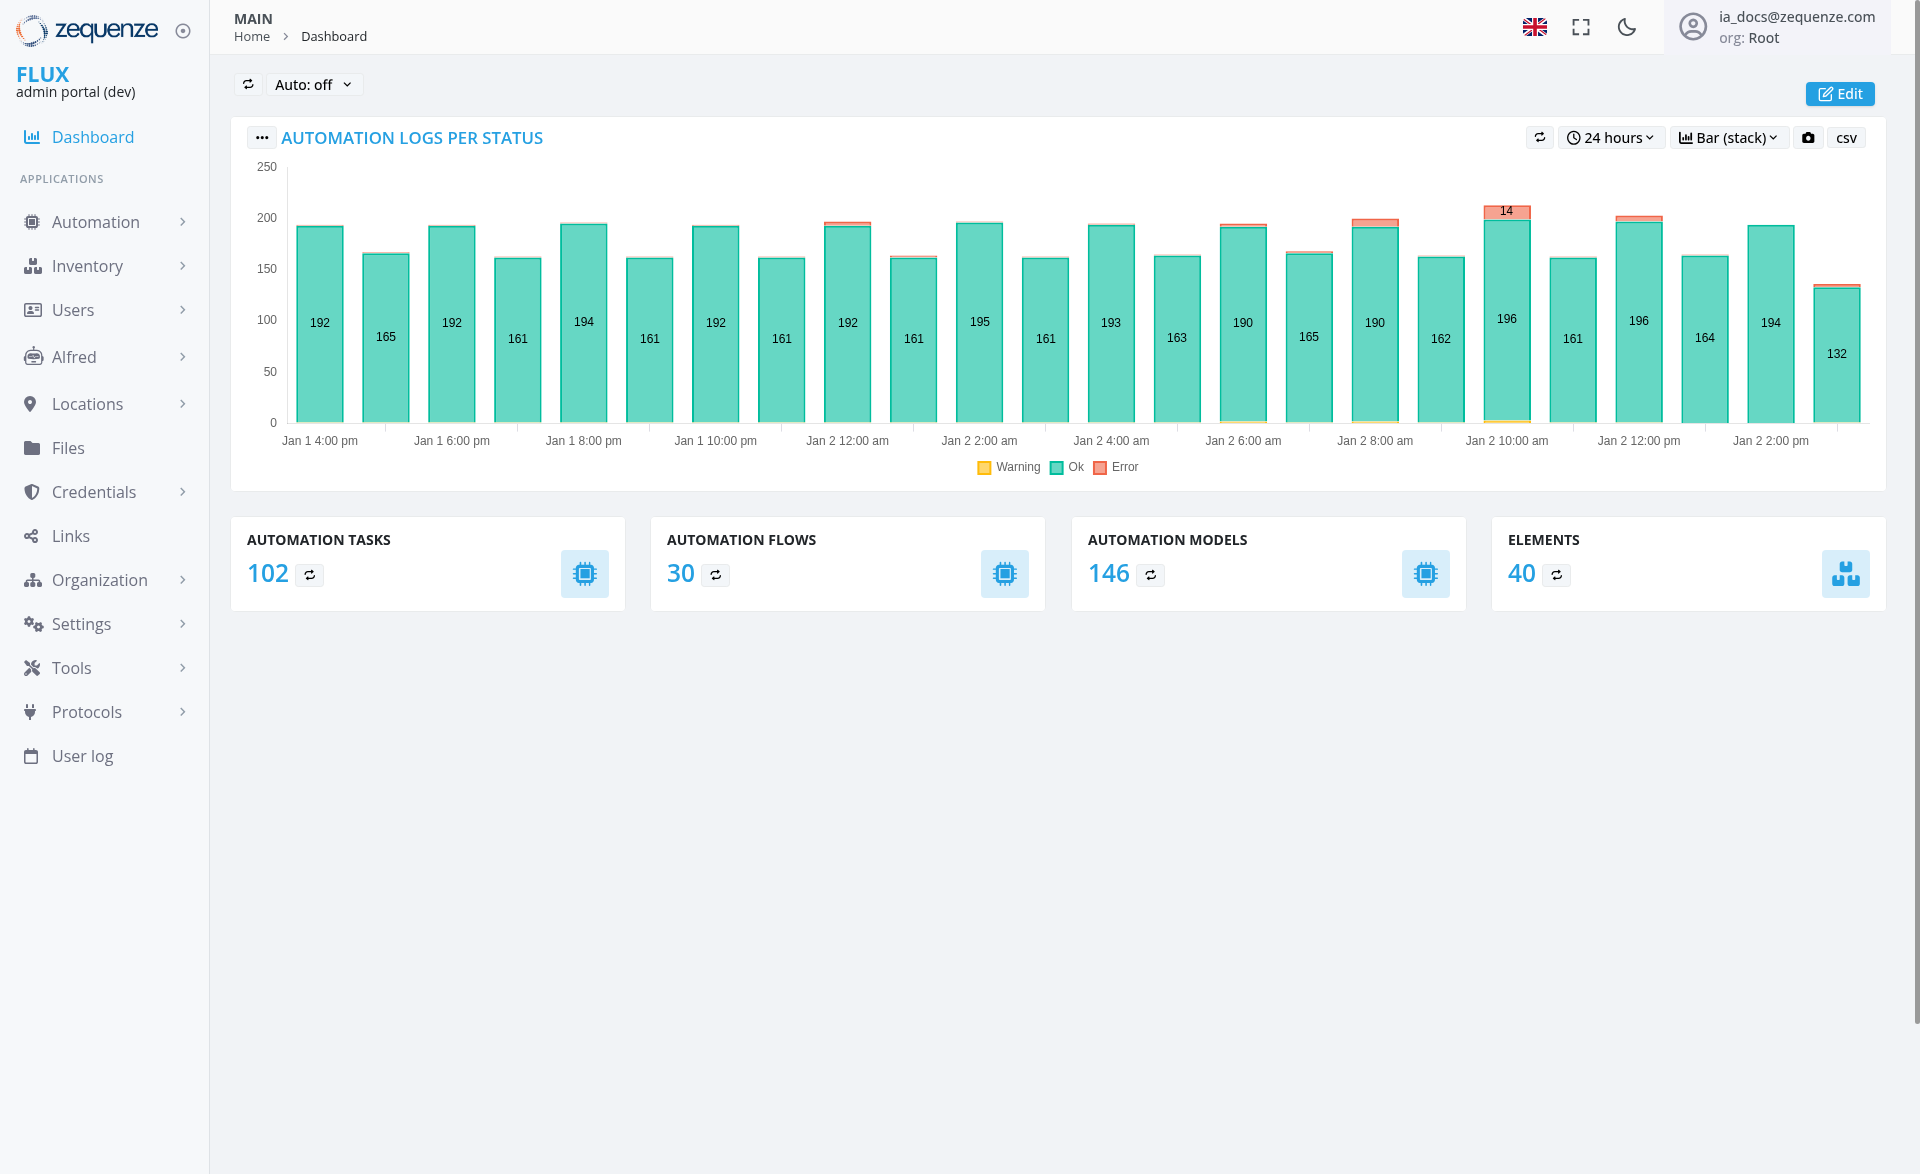
Numerical Data Labels: Each bar displays specific count values (ranging from
161132 to 196 in the current view) -
Status Distribution: Chart shows predominantly "Ok" status executions with
twoonebarsbar containing a small errorsegmentssegment
System Metrics Dashboard
Four key metric cards displaying:
- Automation Tasks: 102 total tasks
- Automation Flows: 30 active flows
- Automation Models: 146 configured models
- Elements: 40 system elements
UI Elements
Navigation Sidebar
-
Applications Section:
- Automation
- Inventory
- Users
- Alfred
- Locations
- Files
- Credentials
- Links
-
System Management:
- Organization
- Settings
- Tools
- Protocols
- User log
Top Navigation Bar
Chart Controls
- Auto-refresh Toggle: Set to "Auto: off" with dropdown options
- Time Period Selector: "24 hours" with dropdown for different time ranges
- Data Export Options: "Bar (stack)" view selector and CSV export functionality
User Interactions
Dashboard Monitoring
- Real-time Data Viewing: Monitor automation execution patterns throughout the day
- Status Analysis: Identify peak automation periods and potential issues
- Time-based Filtering: Adjust time periods to view different data ranges
Navigation Options
Navigation
Access Path
-
URL:
https://flux-dev.zequenze.com/admin/ - Direct Access: Main landing page after login to the admin portal
- Breadcrumb: Home > Dashboard
Related Sections
- Automation management tools
- System configuration settings
- User and organization management
- File and credential management
Data Displayed
Automation Logs Chart
- Time Range: January 1, 4:00 PM through January 2, 2:00 PM (24-hour period)
- Data Points: Hourly snapshots of automation execution
-
Status Values: Numerical counts ranging from
161132 to 196 executions per hour -
Activity Pattern: Consistent automation activity showing stable operations with values primarily between 161-196 executions per
hourhour, with one notable drop to 132 executions -
Status Indicators:
TwoOnebarsbardisplaydisplays a small red errorsegmentssegment (marked with "14"and "28"at the top), while all others maintain the standard teal "Ok" status - Status Legend: Shows Warning (yellow), Ok (teal), and Error (red) status indicators
System Statistics
- Current Counts: Real-time metrics for all major system components
- Resource Overview: Quick assessment of system configuration and capacity
Actions Available
Dashboard Management
- Edit Dashboard: Customize dashboard layout and components using the Edit button
- Export Data: Download chart data in CSV format for external analysis
- Refresh Controls: Toggle auto-refresh or manually update data
System Navigation
- Deep Dive Analysis: Click on metric cards to access detailed management interfaces
- Configuration Access: Navigate to settings and configuration sections
- User Management: Access user and organization management tools
Notes/Tips
Best Practices
- Regular Monitoring: Check the automation logs chart regularly to identify patterns or anomalies
- Peak Hour Analysis: Use the hourly breakdown to optimize automation scheduling
- Status Monitoring: Watch for color changes in the chart bars that might indicate warnings or errors
- Error Investigation: Pay attention to error segments in the bars for potential issues requiring investigation
Performance Insights
-
Activity Patterns: The chart shows consistent automation execution with values between
161-132-196 per hour indicating stable system performance with one period of reduced activity -
Error Detection:
TwoOne small red errorsegmentssegmentindicateindicates a minorissuesissue that should be investigated butdon'doesn't significantly impact overall system performance - Status Distribution: Predominantly successful executions with minimal error rates demonstrate healthy system operation
- Resource Planning: Use the metrics to plan for system capacity and resource allocation
- Trend Analysis: Monitor changes in automation volume over time to identify growth patterns and potential issues
System Health Indicators
- Teal Status Bars: Indicate successful automation executions
- Red Error Segments: Signal execution failures that require attention
- Status Legend: Clear visual indicators help identify different execution states (Warning, Error, Ok)
-
Volume Consistency:
StableGenerally stable execution volumesindicatewithreliableoccasional variations indicating normal systemperformanceoperation - 24/7 Monitoring: Continuous data collection enables proactive system management and issue detection