Dashboard: Main
Overview
The Zequenze Control Portal Dashboard provides a comprehensive monitoring and management interface for automation systems. This main dashboard view displays real-time automation logs, performance metrics, and system statistics over a 24-hour period, enabling administrators to monitor system health and automation execution status.
Key Features
Real-Time Automation Monitoring
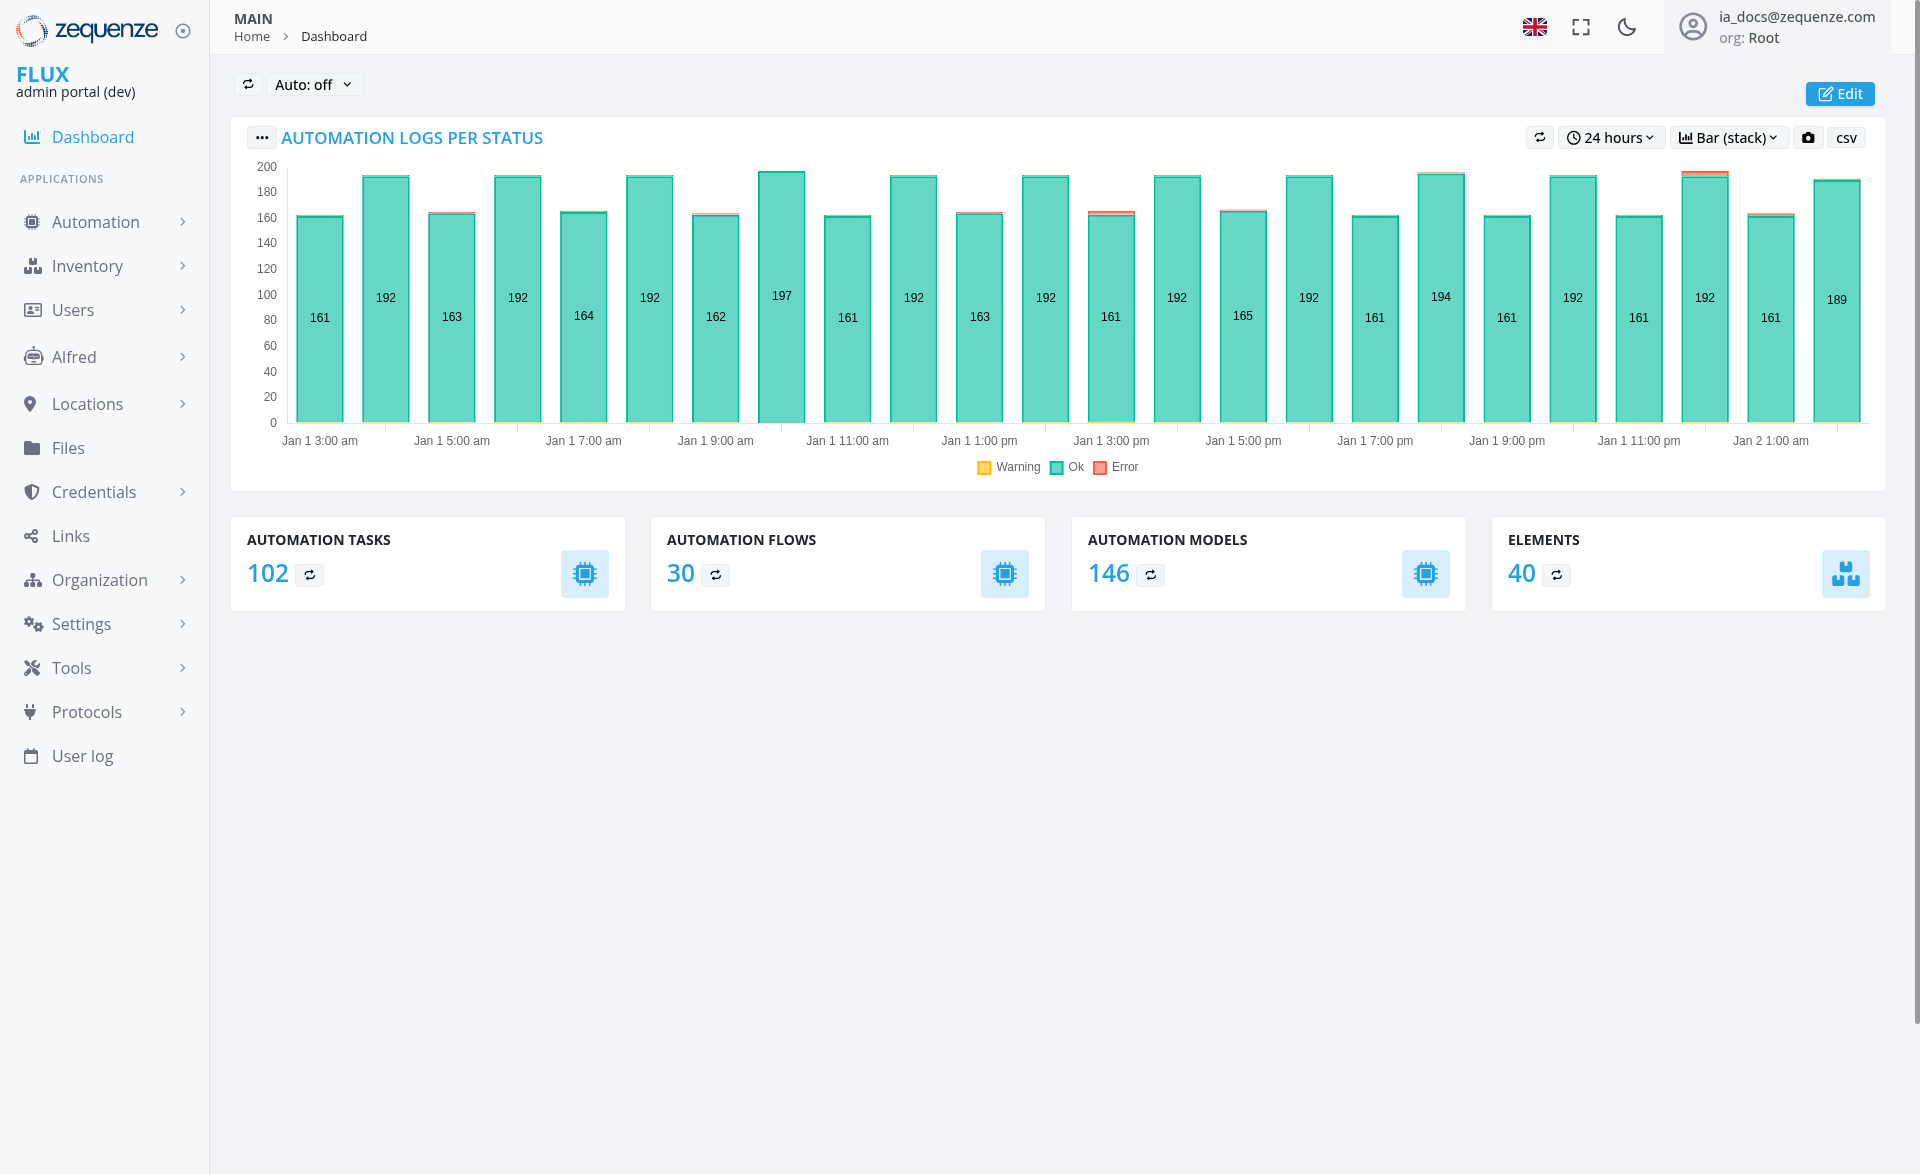
- Automation Logs Per Status Chart: Visual representation of automation execution logs displayed as stacked bar charts
- 24-Hour Time Period: Data visualization covering the last 24 hours with hourly breakdowns
- Status Color Coding: Teal/turquoise bars for "Ok" status, with legend showing Yellow for Warning, Teal for Ok, and Red for Error states
-
Numerical Data Labels: Each bar displays specific count values (ranging from
16142 to197196 in the current view)
System Metrics Dashboard
Four key metric cards displaying:
- Automation Tasks: 102 total tasks
- Automation Flows: 30 active flows
- Automation Models: 146 configured models
- Elements: 40 system elements
UI Elements
Navigation Sidebar
-
Applications Section:
- Automation
- Inventory
- Users
- Alfred
- Locations
- Files
- Credentials
- Links
-
System Management:
- Organization
- Settings
- Tools
- Protocols
- User log
Top Navigation Bar
Chart Controls
- Auto-refresh Toggle: Set to "Auto: off" with dropdown options
- Time Period Selector: "24 hours" with dropdown for different time ranges
- Data Export Options: "Bar (stack)" view selector and CSV export functionality
User Interactions
Dashboard Monitoring
- Real-time Data Viewing: Monitor automation execution patterns throughout the day
- Status Analysis: Identify peak automation periods and potential issues
- Time-based Filtering: Adjust time periods to view different data ranges
Navigation Options
Navigation
Access Path
-
URL:
https://flux-dev.zequenze.com/admin/ - Direct Access: Main landing page after login to the admin portal
- Breadcrumb: Home > Dashboard
Related Sections
- Automation management tools
- System configuration settings
- User and organization management
- File and credential management
Data Displayed
Automation Logs Chart
-
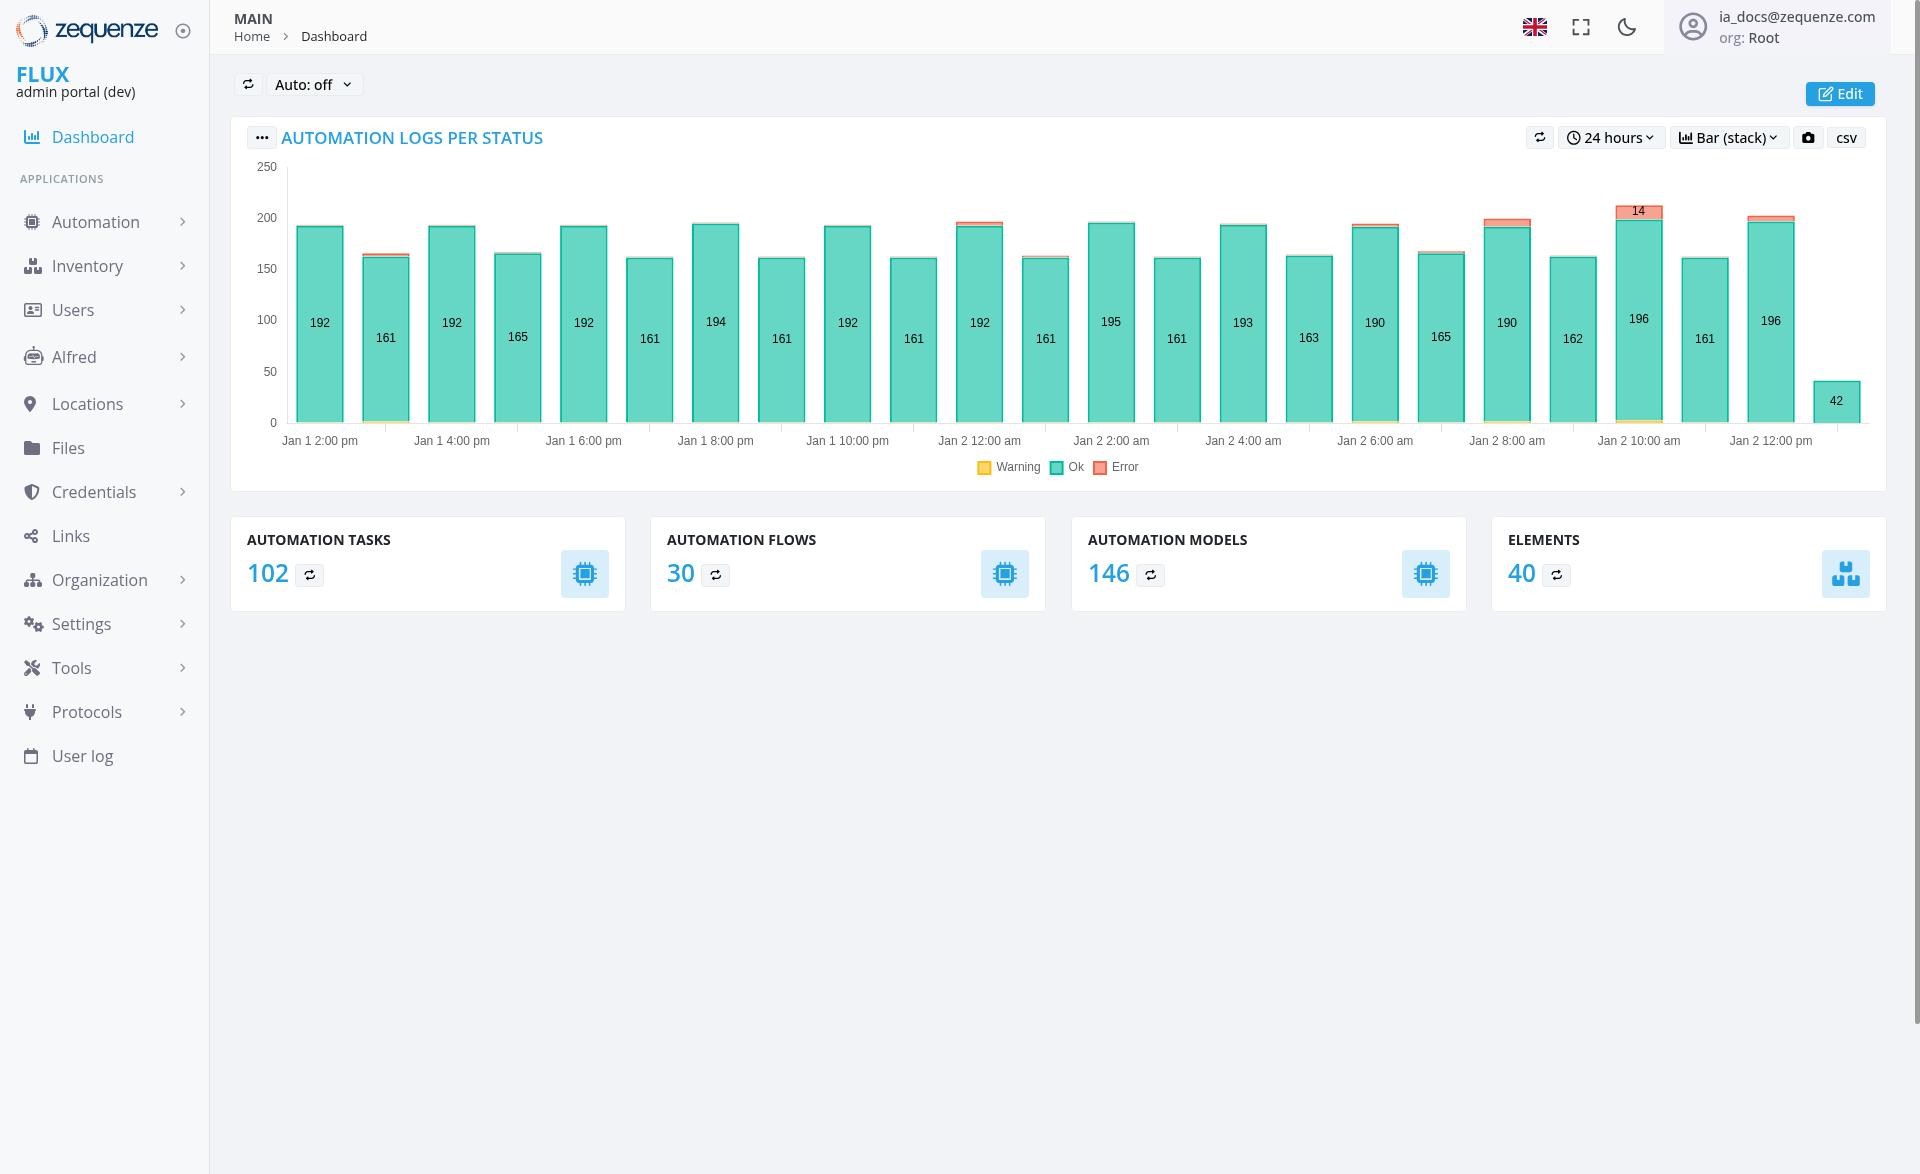
Time Range: January 1,
3:2:00AMPM through January 2,1:12:00AMPM (24-hour period) - Data Points: Hourly snapshots of automation execution
-
Status Values: Numerical counts ranging from
16142 to197196 executions per hour -
Activity Pattern:
ConsistentVariable automation activity showing normal operations (160-196 executions) withvaluesoneprimarilynotablebetweensignificant161-197drop to 42 executionsperathourthe end of the monitoring period
System Statistics
- Current Counts: Real-time metrics for all major system components
- Resource Overview: Quick assessment of system configuration and capacity
Actions Available
Dashboard Management
- Edit Dashboard: Customize dashboard layout and components using the Edit button
- Export Data: Download chart data in CSV format for external analysis
- Refresh Controls: Toggle auto-refresh or manually update data
System Navigation
- Deep Dive Analysis: Click on metric cards to access detailed management interfaces
- Configuration Access: Navigate to settings and configuration sections
- User Management: Access user and organization management tools
Notes/Tips
Best Practices
- Regular Monitoring: Check the automation logs chart regularly to identify patterns or anomalies
- Peak Hour Analysis: Use the hourly breakdown to optimize automation scheduling
- Status Monitoring: Watch for color changes in the chart bars that might indicate warnings or errors
- Alert Investigation: Pay attention to warning indicators and significant drops in execution volume for potential system issues
Performance Insights
-
HighActivityLevelsPatterns: The chart showsrobusttypical automation execution with valuesconsistentlyprimarilyabovebetween160160-196 per hour during normal operations -
ActivityAnomalyConsistencyDetection: Thecurrentdramaticviewdropshowstostable42automationexecutionsexecutionatlevelsJanwith2minimal12:00variationPMthroughoutindicatesthea24-hourpotentialperiodsystem issue requiring investigation
System Health Indicators
- Teal Status Bars: Indicate successful automation executions