Device Settings View
Overview
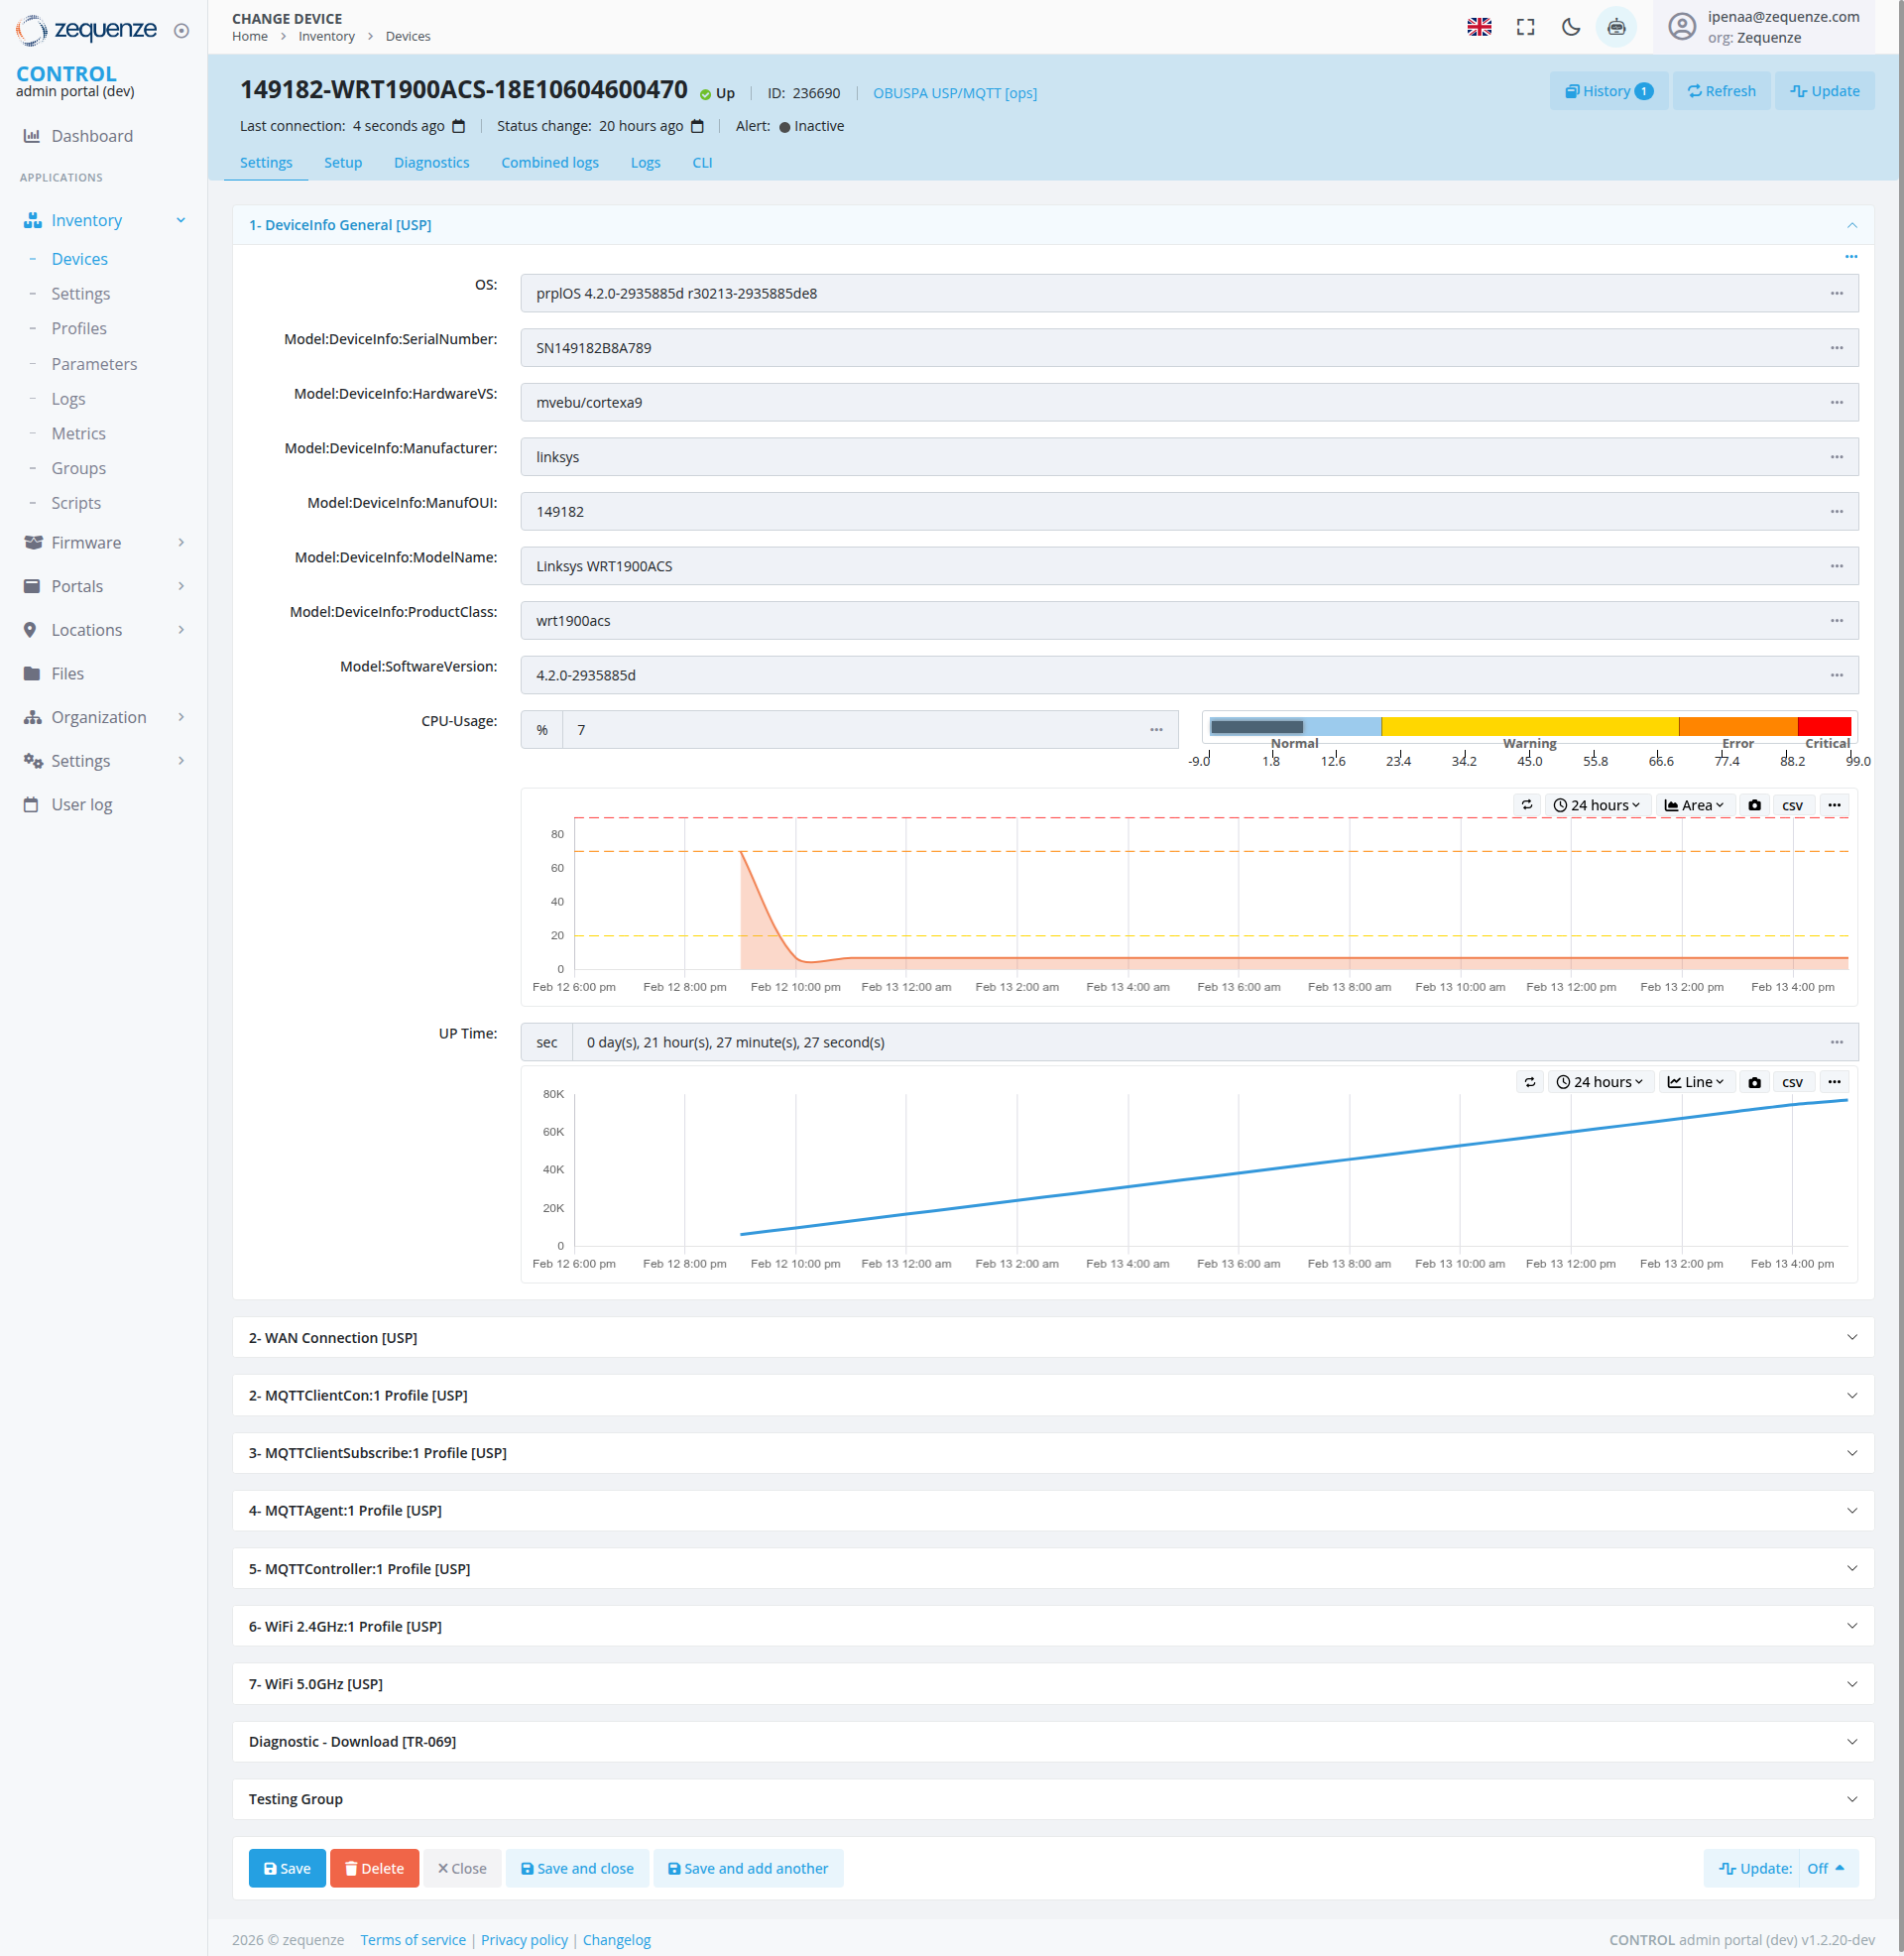
The Device Details page in the CONTROL admin portal provides comprehensive information and management capabilities for individual IoT devices. This page displays device identification, hardware specifications, system metrics, and various configuration profiles for the Linksys WRT1900ACS router (Device ID: 149182-WRT1900ACS-18E10604600470).
Key Features
- Real-time Device Monitoring: Track device connectivity status, CPU usage, and uptime metrics
- Device Information Management: View and edit detailed device specifications including OS version, hardware details, and model information
- Multi-Profile Configuration: Access and manage various connection and communication profiles (WAN, MQTT, WiFi)
- Historical Data Visualization: Interactive charts displaying CPU usage trends and uptime history over 24-hour periods
- Diagnostic Tools: Download diagnostic files and access device logs for troubleshooting
Navigation
Accessing the Device Details Page
Breadcrumb Navigation
- Home > Inventory > Devices > [Device ID]
- Device group indicator: OBU/SPA LISD/MQTT (pap)
Device Status Bar
Located at the top of the page, displaying critical status information:
- Last connection: 4 seconds ago (with timestamp indicator)
- Status change: 20 hours ago (with timestamp indicator)
- Alert: Inactive status indicator
-
Action Buttons:
- History (with notification badge)
- Refresh: Update device information
- Update: Apply configuration changes
Main Navigation Tabs
The page includes six primary tabs for device management:
- Settings: Device configuration and parameters
- Setup: Initial device setup and onboarding
- Diagnostics: Troubleshooting and system analysis
- Combined logs: Aggregated log viewing
- Logs: Individual log file access
- CLI: Command-line interface access
Device Information Section
1. DeviceInfo General [USP]
This expandable section displays core device specifications:
| Field | Value | Description |
|---|---|---|
| OS | prplOS 4.2.0-29358b5d r9021323585b54e8 | Operating system version and build |
| Model:DeviceInfo.SerialNumber | SN14918288A789 | Unique device serial number |
| Model:DeviceInfo.HardwareVersion | mvebu/cortexa9 | Hardware platform identifier |
| Model:DeviceInfo.Manufacturer | linksys | Device manufacturer name |
| Model:DeviceInfo.ManufacturerOUI | 149182 | Organizationally Unique Identifier |
| Model:DeviceInfo.ModelName | Linksys WRT1900ACS | Commercial product name |
| Model:DeviceInfo.ProductClass | wrt1900acs | Product classification code |
| Model:SoftwareVersion | 4.2.0-29358b5d | Current firmware version |
Each field includes an ellipsis menu (⋯) for additional actions.
Performance Metrics
CPU Usage Monitor
Visual Display:
- Real-time CPU usage percentage (currently showing 7%)
- Color-coded severity scale:
- Normal: 0-17.6% (Green/Blue)
- 17.6-34.2%: Light monitoring
- 34.2-51.8%: Elevated usage
- Warning: 68.6-85.4% (Yellow)
- Error: 77.4% (Orange)
- Critical: 86.2-99.0% (Red)
Chart Features:
- Time Range: 24-hour view (selectable)
- Area Visualization: Line chart with shaded area
- Interactive Timeline: Hover for specific data points
- Peak Analysis: Shows historical spike around Feb 12 8:00 pm
- Export Options: CSV download available
- View Controls: Area selector dropdown
Timeline Display:
- X-axis: Time stamps from Feb 12 6:00 pm through Feb 14 4:00 pm
- Y-axis: Percentage scale (0-100%)
- Current state: Low stable usage (~7%) after initial spike
Uptime Tracking
Visual Display:
- Current Uptime: 0 day(s), 21 hour(s), 27 minute(s), 27 second(s)
- Cumulative uptime graph showing device availability
Chart Features:
- Time Range: 24-hour view (selectable)
- Line Graph: Steadily increasing line representing continuous uptime
- Current Reading: Approximately 60K seconds (displayed on Y-axis)
- Timeline: Same period as CPU usage (Feb 12-14)
- Export Options: CSV download and additional options menu
- View Controls: Line visualization with customizable time range
Scale Information:
- Y-axis: Time in seconds (20K, 40K, 60K, 80K increments)
- X-axis: Synchronized with CPU usage timeline
Configuration Profiles
The page provides access to multiple expandable profile sections:
2. WAN Connection [USP]
Network connectivity configuration for Wide Area Network settings
2. MQTTClientCon:1 Profile [USP]
MQTT client connection profile for IoT messaging protocols
3. MQTTClientSubscribe:1 Profile [USP]
MQTT subscription topics and message handling configuration
4. MQTTAgent:1 Profile [USP]
MQTT agent settings for message broker communication
5. MQTTController:1 Profile [USP]
MQTT controller configuration for device management
6. WiFi 2.4GHz:1 Profile [USP]
2.4 GHz wireless network configuration settings
7. WiFi 5.0GHz [USP]
5.0 GHz wireless network configuration settings
Each profile section can be expanded by clicking the chevron icon (∨) to reveal detailed configuration parameters.
Diagnostic Tools
Diagnostic - Download [TR-069]
Expandable section providing access to TR-069 protocol diagnostic files for advanced troubleshooting and device analysis.
Testing Group
Dedicated section for device testing and validation procedures, accessible through the expandable panel at the bottom of the page.
Actions Available
Primary Actions (Bottom Action Bar)
- 💾 Save: Commit changes to device configuration
- 🗑️ Delete: Remove device from inventory
- ✕ Close: Exit without saving changes
- 💾 Save and close: Save changes and return to inventory
- 💾 Save and add another: Save current device and create new device entry
Secondary Actions
- 🔄 Update: Manual firmware or configuration update (top right)
- Off Toggle: Quick enable/disable switch (bottom right)
- Update Button: Additional update options (bottom right)
User Interactions
Viewing Device Information
- Scroll through the page to view different sections
- Click on any field's ellipsis menu (⋯) for field-specific actions
- Hover over chart elements to see detailed data points
Editing Device Parameters
- Click on editable fields to modify values
- Use the ellipsis menus for advanced field options
- Click Save or Save and close to commit changes
Monitoring Performance
- Review real-time metrics in the status bar
- Analyze CPU usage patterns in the graph
- Check uptime trends for connectivity issues
- Adjust time ranges using the 24-hour selector
Managing Profiles
- Click on any profile section to expand its configuration
- Modify profile-specific parameters
- Save changes using the action buttons
Downloading Diagnostics
- Expand the "Diagnostic - Download [TR-069]" section
- Select desired diagnostic data
- Download files for offline analysis
Navigation Tips
Notes & Best Practices
Device Status Monitoring
- Green indicators: Device is healthy and connected
- Last connection timestamp: Should update regularly (every few seconds)
- Alert status: Monitor for "Active" alerts requiring attention
CPU Usage Interpretation
- Normal operation typically shows usage below 20%
- Spikes may indicate firmware updates, configuration changes, or processing intensive tasks
- Sustained high usage (>70%) requires investigation
Uptime Considerations
- Recent uptime of 21+ hours indicates a device restart approximately one day ago
- Check Combined Logs if uptime resets unexpectedly
- Normal maintenance may require periodic restarts
Configuration Management
- Always review changes before saving
- Use "Save and close" for single device updates
- Use "Save and add another" for batch device provisioning
- Changes may require device reboot to take effect
Data Export
- Use CSV export for creating reports or importing into analysis tools
- 24-hour time window can be adjusted for longer historical views
- Consider downloading diagnostics before major configuration changes
Footer Information
- Copyright: 2026 © zequenze
- Links: Terms of service | Privacy policy | Changelog
- System: CONTROL admin portal (dev) v1.2.20-dev
- User: jerinab@zequenze.com (org: Zequenze)
This device details page serves as the central hub for managing and monitoring individual IoT devices within the CONTROL platform, providing administrators with comprehensive visibility and control over device operations, connectivity, and performance.