Dashboard: Main
Overview
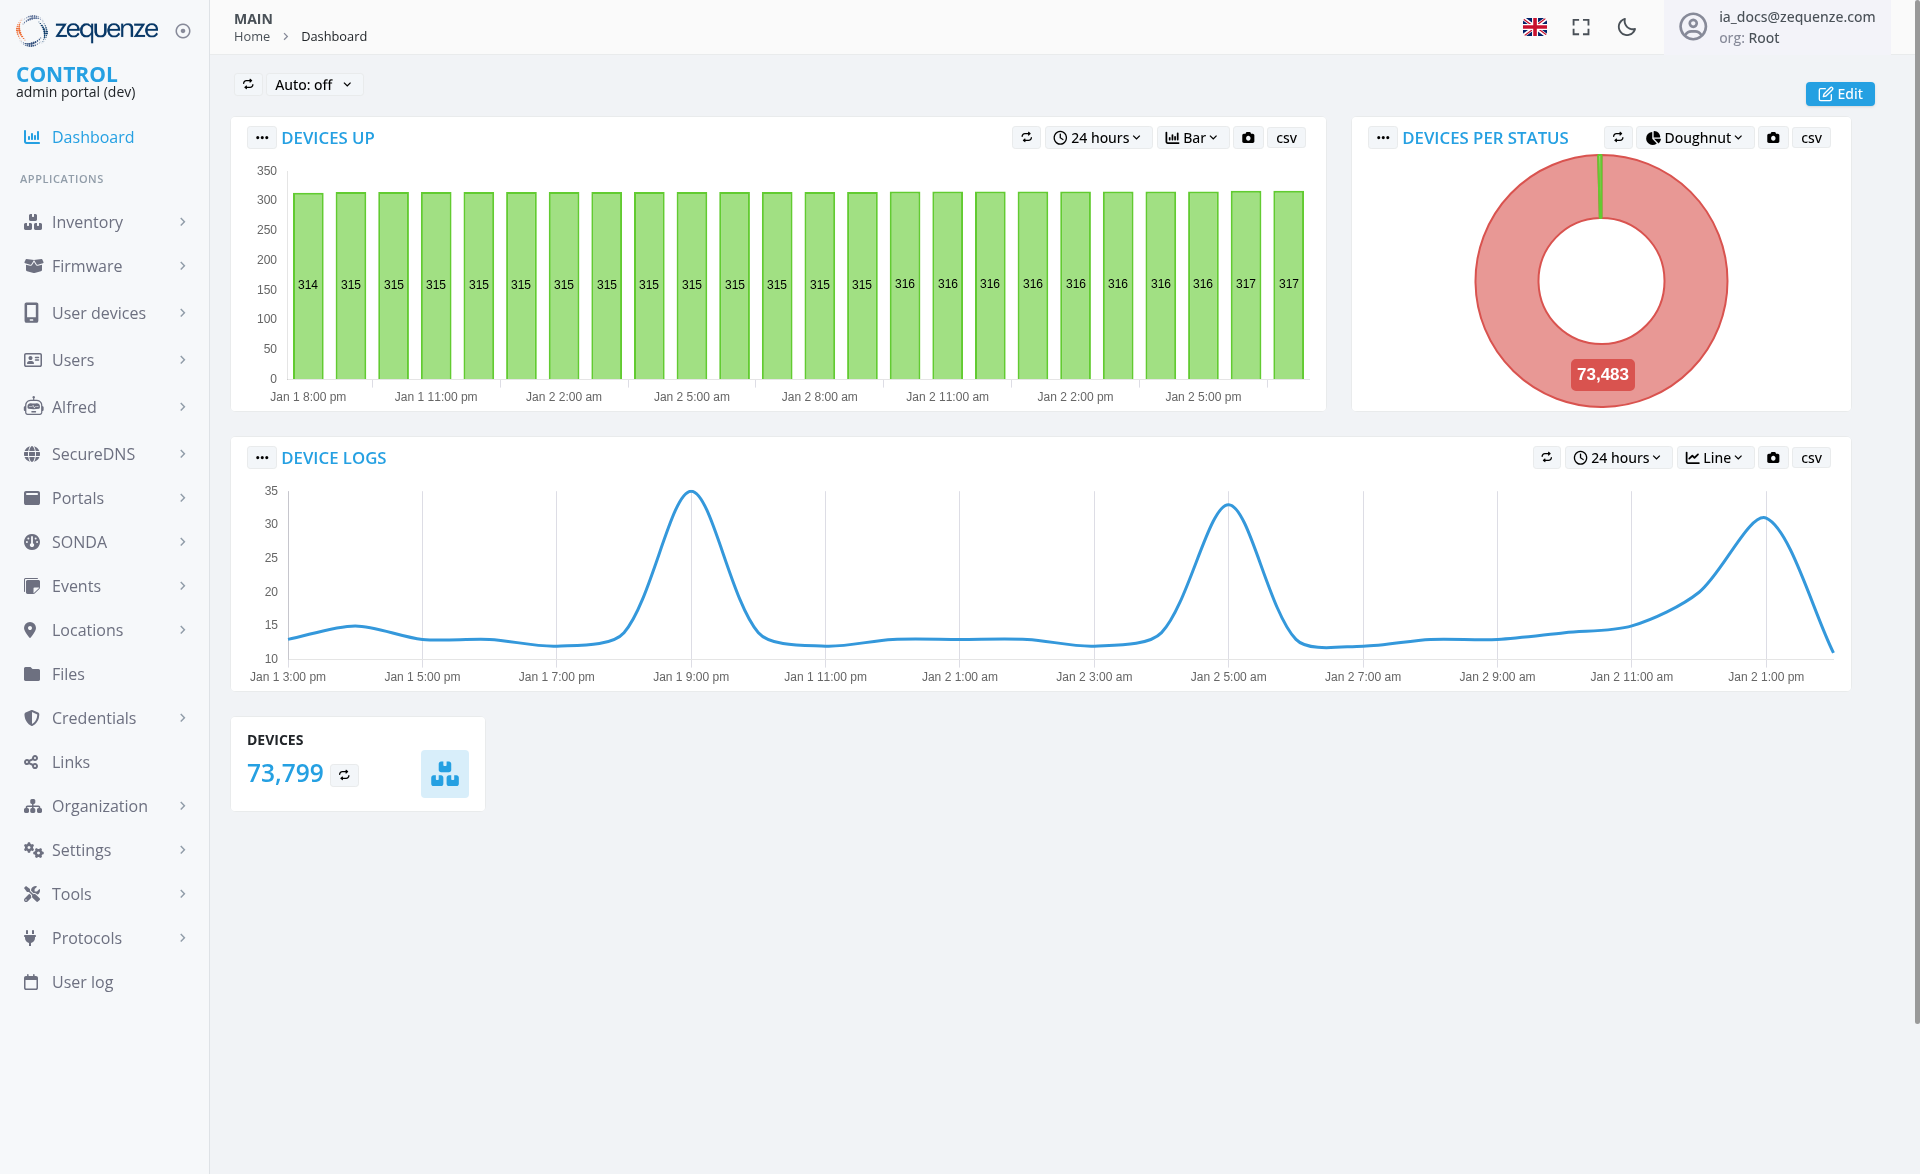
The Zequenze Control Portal Dashboard provides a comprehensive real-time overview of device management and monitoring capabilities. This main dashboard serves as the central hub for administrators to monitor device status, track performance metrics, and access various system management tools.
Key Features
Real-Time Device Monitoring
- Devices Up Chart: Visual bar chart showing device availability over a 24-hour period
- Device Logs Graph: Line chart displaying device activity and log patterns over time
- Devices Per Status: Pie chart visualization showing the distribution of device statuses
- Live Device Count: Real-time counter showing total devices (73,799)
Navigation & Access Control
UI Elements
Dashboard Widgets
- Devices Up Widget: Green bar chart with consistent values around 314-317 devices, displaying hourly data points from Jan 1 8:00 pm through Jan 2 5:00 pm
- Device Logs Widget: Blue line graph showing activity spikes and patterns over 24 hours, with notable peaks around Jan 1 7:00 pm, Jan 2 4:00 am, and Jan 2 1:00 pm reaching approximately 35 events
- Devices Per Status Widget: Donut chart with prominent red section showing 73,483 devices
- Device Counter: Large numeric display (73,799) with refresh icon
Navigation Sidebar
- Control Section: Dashboard (currently active)
-
Applications Menu:
- Inventory
- Firmware
- User devices
- Users
- Alfred
- SecureDNS
- Portals
- SONDA
- Events
- Locations
- Files
- Credentials
- Links
- Organization
- Settings
- Tools
- Protocols
- User log
Top Navigation
- Home and Dashboard breadcrumb navigation
- Auto-refresh toggle (currently set to "Auto: off")
- Edit button for dashboard customization (located in top-right corner)
User Interactions
Widget Controls
- Time Range Selection: 24-hour view with dropdown options
- Data Export: CSV export functionality available for all widgets
- Chart Type Toggle: Bar/Line view options for applicable charts (Line option visible for Device Logs widget)
- Chart View Options: Doughnut view selection available for Devices Per Status widget
- Refresh Controls: Manual refresh and auto-refresh settings
Navigation
Navigation
Access Path
-
URL:
https://control-dev.zequenze.com/admin/ - Primary Navigation: MAIN > Home > Dashboard
- User Level: Root organization access required
Related Sections
- Device management via Inventory and User devices
- System configuration through Settings and Organization
- Monitoring and logging via Events and User log sections
Data Displayed
Performance Metrics
- Device Uptime: Consistent high availability (314-317 devices up)
- Activity Patterns: Device logs show periodic activity spikes with peaks at Jan 1 7:00 pm, Jan 2 4:00 am, and Jan 2 1:00 pm
- Status Distribution: Large-scale device deployment (73,799 total devices)
- Time Series Data: 24-hour rolling window with hourly granularity
System Information
- Total Devices: 73,799 managed devices
- Active Monitoring: Real-time status tracking
- Historical Data: Time-based trend analysis
- Status Categories: Multiple device states tracked in pie chart
Actions Available
Dashboard Management
- Edit Dashboard: Customize widget layout and configuration via Edit button in top-right
- Export Data: Download CSV reports for all widgets
- Refresh Data: Manual or automatic data updates
- Time Range Adjustment: Modify monitoring time windows
- Chart View Customization: Toggle between different chart types (Bar/Line for Device Logs, Doughnut view for status charts)
System Navigation
- Quick Access: Direct links to all major system functions
- User Management: Access to user and device administration
- Configuration: System settings and organizational controls
- Monitoring: Real-time and historical data analysis
Notes/Tips
Best Practices
- Monitor the "Devices Up" chart for consistent availability patterns
- Use the Device Logs graph to identify unusual activity spikes
- Export data regularly for compliance and reporting purposes
- Enable auto-refresh for real-time monitoring scenarios
- Utilize chart view options (Line/Bar toggle, Doughnut view) for optimal data visualization
Performance Considerations
- The dashboard displays data for 73,799 devices, indicating enterprise-scale deployment
- Time-series data updates hourly for optimal performance
- CSV export functionality available for detailed analysis
- Dashboard widgets are optimized for real-time updates
Access Requirements
- Root organization privileges required for full dashboard access
- Development environment URL suggests testing/staging deployment
- User authentication via email-based accounts (ia_docs@zequenze.com shown)