Reports & Analytics
- AAA Services Reports
- Advertising reports
- Glosary
- Hotspots Reports
- Records, Transactions and Logs
- Report Name Reference
- Reports Page Reference
- Users Reports
AAA Services Reports
Overview
This section provides detailed information about all available AAA Services reports in GATE. Reports are organized into two main categories: Authentication reports for login activity analysis, and Accounting reports for session and bandwidth tracking.
Report Categories
Authentication Reports
Authentication reports focus on subscriber login requests, tracking accept/reject patterns, and access point activity analysis.
Accounting Reports
Accounting reports provide insights into active sessions, bandwidth usage, session duration, and traffic patterns across your network infrastructure.
Available Reports
| Report Name | Description | Category |
|---|---|---|
| AAA Access Point MAC distribution by organization (Accounting table) | Subscriber activity, by organization over time | Accounting |
| AAA Access Point MAC distribution by organization and type | Subscriber requests, by accept/reject over time | Authentication |
| AAA accounting sessions | Sessions trend | Accounting |
| AAA accounting sessions by Access Point | Sessions trend, by AP | Accounting |
| AAA accounting sessions by Location | Sessions trend, by location | Accounting |
| AAA accounting sessions by NAS Client | Sessions trend, by NAS client | Accounting |
| AAA accounting sessions by Realm | Sessions trend, by realm | Accounting |
| AAA accounting sessions by organization | Sessions trend, by organization | Accounting |
| AAA accounting traffic per Location and Organization (GBytes) | Bandwidth by location and organization over time, GBytes | Accounting |
| AAA accounting traffic per location (GBytes) | Bandwidth by location over time, GBytes | Accounting |
| AAA accounting traffic per user (GBytes) | Bandwidth detail by subscribers over time, GBytes | Accounting |
| AAA active Access Point MAC addresses (Accounting table) | Sessions trend, by AP address | Accounting |
| AAA active Access Point MAC addresses per NAS client (Accounting table) | Sessions trend, by AP address and NAS client | Accounting |
| AAA active Access Point MAC addresses per Organization (Accounting table) | Sessions trend, by AP address and organization | Accounting |
| AAA active Access Point MAC addresses per organization | Accepted Sessions trend, by AP address and organization | Authentication |
| AAA active sessions | Active sessions trend | Accounting |
| AAA active sessions per NAS Client | Active sessions trend, by NAS client | Accounting |
| AAA active sessions per Organization | Active sessions trend, by organization | Accounting |
| AAA active sessions per Realm | Active sessions trend, by realm | Accounting |
| AAA active sessions per called station | Active sessions detail, by called station | Accounting |
| AAA active sessions per user and realm | Active sessions detail, by user and realm | Accounting |
| AAA maximum sessions | Max sessions trend | Accounting |
| AAA multi-session time average (in minutes) | Average minutes, by session | Accounting |
| AAA number of active Access Point MAC addresses | Active AP address trend | Authentication |
| AAA requests by Access Point MAC address and type | Subscriber requests accept/reject trend, by AP address | Authentication |
| AAA requests by access point and type | Subscriber requests accept/reject trend, by AP address and location | Authentication |
| AAA requests by calledstation and type | Subscriber requests accept/reject trend, by calledstation and type | Authentication |
| AAA requests by calledstation, access point, and type | Subscriber requests accept/reject trend, by calledstation, AP and location | Authentication |
| AAA requests by type | Subscriber requests accept/reject trend | Authentication |
| AAA requests distribution by organization and type | Subscriber requests accept/reject trend by organization | Authentication |
| AAA session time average (in minutes) | Average minutes trend, by sessions | Accounting |
| AAA session time average (in seconds) | Average seconds trend, by sessions | Accounting |
| AAA session time average by Location (in minutes) | Average minutes trend, by location and sessions | Accounting |
| AAA session time average by Location and Organization (in minutes) | Average minutes trend, by location, organization and sessions | Accounting |
| AAA session time average by organization (in minutes) | Average minutes trend, by organization and sessions | Accounting |
| AAA session time average by terminate cause | Average minutes trend, by terminate cause | Accounting |
| AAA sessions by terminate cause | Sessions trend, by terminate cause | Accounting |
| Bottom AAA Access Point MAC address by number of requests and type | Bottom-ranked subscriber requests, by AP address and accept/reject over time | Authentication |
| Bottom AAA Access Points by number of requests and type | Bottom-ranked subscriber requests, by AP, location and accept/reject over time | Authentication |
| Bottom AAA Access Points by number of sessions (Accounting table) | Bottom-ranked sessions, by AP and location over time | Accounting |
| Bottom AAA Locations by number of requests and type | Bottom-ranked subscriber requests, by location and accept/reject over time | Authentication |
| Bottom AAA Locations by number of sessions (Accounting table) | Bottom-ranked sessions, by location over time | Accounting |
| List of active AAA Access Point MAC address | Total logins, by AP address over time | Authentication |
| List of active AAA Access Point MAC address (no transaction count) | Active AP address over time | Authentication |
| List of active AAA Access Point MAC addresses (Accounting table) | Total sessions, by AP address over time | Accounting |
| List of active AAA Access Point MAC addresses (Accounting table, no count) | Active AP address over time | Accounting |
| Number of accounting requests from unidentified Access Points by MAC address | Sessions trend for unidentified AP, by AP address | Accounting |
| Number of accounting requests from unidentified Access Points by MAC address and NAS client | Sessions trend for unidentified AP, by AP address and NAS client | Accounting |
| Number of accounting requests from unidentified Access Points by MAC address and NAS-ID | Sessions trend for unidentified AP, by AP address and NAS-ID | Accounting |
| Number of accounting requests with and without matching Access Point | Sessions trend for identified/unidentified AP | Accounting |
| Number of distinct user devices (Called-Station-Id) by organization (Accounting table) | Called Station Id trend, by organization | Accounting |
| Top AAA Access Point MAC address by number of requests and type | Top-ranked subscriber requests, by AP address and accept/reject over time | Authentication |
| Top AAA Access Point MAC address without matching Access Point | Top-ranked subscriber requests without AP, by AP address and accept/reject over time | Authentication |
| Top AAA Access Point MAC address without matching Access Point (Accounting table) | Top-ranked sessions without AP, by AP address and NAS client over time | Accounting |
| Top AAA Access Point MAC address without matching Location | Top-ranked subscriber requests without location, by AP address, accept/reject and NAS client over time | Authentication |
| Top AAA Access Point MAC address without matching Location (Accounting table) | Top-ranked sessions without location, by AP address and NAS client over time | Accounting |
| Top AAA Access Points by number of requests and type | Top-ranked subscriber requests, by AP, location and accept/reject over time | Authentication |
| Top AAA Access Points by number of sessions (Accounting table) | Top-ranked sessions, by AP and location over time | Accounting |
| Top AAA Locations by number of requests and type | Top-ranked subscriber requests, by location and accept/reject over time | Authentication |
| Top AAA Locations by number of sessions (Accounting table) | Top-ranked sessions, by location over time | Accounting |
Report Usage Notes
- Authentication Reports: Use these reports to analyze login patterns, identify authentication issues, and monitor access point performance
- Accounting Reports: These reports are essential for bandwidth monitoring, session analysis, and capacity planning
- Time-based Analysis: Most reports support time range selection for historical trend analysis
- Organization Filtering: Reports can be filtered by organization for multi-tenant environments
Advertising reports
Overview
The advertising reports provide comprehensive analytics for banner campaigns, user interactions, and performance metrics within GATE. These reports are categorized under the AD Events group and offer detailed insights into views, clicks, and user engagement patterns.
Report Categories
Campaign Performance Reports
These reports focus on campaign-level analytics and overall performance metrics:
| Report Name | Description |
|---|---|
| Transactions by campaign | Views/Clicks trend analysis by campaign |
| Transactions by campaign and banner | Views/Clicks trend analysis by campaign and banner |
| Transactions by campaign, type and action | Views/Clicks trend analysis by campaign and action |
| Transactions by campaign, type and page | Views/Clicks trend analysis by campaign and page |
| Transactions by campaign, type and user's device brand | Views/Clicks trend analysis by campaign and device brand |
| Transactions by campaign, banner, type and location | Views/Clicks trend analysis by campaign, banner and location |
| Transactions by campaign, type, action and location | Views/Clicks trend analysis by campaign, action and location |
| Transactions by campaign, type, action and location group | Views/Clicks trend analysis by campaign, action and location group |
| Transactions by campaign, type, location and user's device brand | Views/Clicks trend analysis by campaign, location and device brand |
Banner Performance Reports
These reports provide detailed analytics at the individual banner level:
| Report Name | Description |
|---|---|
| Active banners | Active banner tracking by campaign, page and organization over time |
| Active banners with Views and Clicks | Active banner Views/Clicks by campaign, page and organization over time |
| Transactions by banner | Views/Clicks trend analysis by banner |
| Transactions by banner, type and action | Views/Clicks trend analysis by banner and action |
| Transactions by banner, type and hour of day | Views/Clicks analysis by banner over time |
| Transactions by banner, type and page | Views/Clicks trend analysis by banner and page |
| Transactions by banner, type, action and location | Views/Clicks trend analysis by banner, action and location |
| Transactions by banner, type, action and location group | Views/Clicks trend analysis by banner, action and location group |
| Transactions by banner, type, location and user's device brand | Views/Clicks trend analysis by banner, location and device brand |
User Demographics and Device Reports
These reports analyze user behavior based on demographics and device characteristics:
| Report Name | Description |
|---|---|
| Transactions by banner, type and user's age (from birthday) | Views/Clicks analysis by banner and age (from birthday) over time |
| Transactions by banner, type and user's device brand | Views/Clicks trend analysis by banner and device brand |
| Transactions by banner, type and user's device type | Views/Clicks trend analysis by banner and device type |
| Transactions by banner, type and user's gender | Views/Clicks trend analysis by banner and user gender |
| Transactions by banner, type and user's telephone country code | Views/Clicks trend analysis by banner and telephone country code |
General Transaction Reports
These reports provide broad transaction analytics and detailed breakdowns:
| Report Name | Description |
|---|---|
| Detailed transactions report | Comprehensive Views/Clicks analysis over time |
| Transactions by type | General Views/Clicks trend analysis |
| Transactions by type and action | Views/Clicks trend analysis by action |
| Transactions by type, action and location | Views/Clicks trend analysis by action and location |
| Transactions by type, action and location group | Views/Clicks trend analysis by action and location group |
| Transactions by page, type and action | Views/Clicks trend analysis by page and action |
Heatmap Reports
These reports provide visual representations of user interaction patterns:
| Report Name | Description |
|---|---|
| Heatmap - Transactions by Banner and Access Point | Total Views/Clicks visualization by banner and AP |
| Heatmap - Transactions by Banner and Location | Total Views/Clicks visualization by banner and location |
| Heatmap - Transactions by Campaign and Access Point | Total Views/Clicks visualization by campaign and AP |
| Heatmap - Transactions by Campaign and Location | Total Views/Clicks visualization by campaign and location |
| Heatmap - Transactions by Location | Total Views/Clicks visualization by location |
Key Metrics
All advertising reports track the following primary metrics:
- Views: Number of times banners are displayed to users
- Clicks: Number of user interactions with banners
- Trends: Performance patterns over specified time periods
Report Group Classification
All advertising reports are classified under the AD Events group for easy identification and organization within the GATE reporting system.
Glosary
Report Glossary
This glossary defines key concepts and terminology used throughout GATE reporting features.
Network Infrastructure
| Term | Definition |
|---|---|
| AP | Access Point |
| AP address | Access Point MAC address |
| AP address ID | Access Point address identifier |
| AP locations | Name of the location where an Access Point is deployed |
| Hotspots | Menu for Hotspot management and configuration |
| Location | Name of the hotspot's physical location |
| Location group | Name of the location group registered by an organization |
| Unidentified AP | Unidentified Access Point |
User Management & Authentication
| Term | Definition |
|---|---|
| AAA services | Menu for Authentication, Authorization and Accounting |
| Session | Period between login and logout. In reports, refers to repeated subscriber sessions with username |
| Session classes | Subscriber email in the Klass field |
| Transaction | Exchange of messages between AAA server and subscriber device |
| User | User with access to network service. In reports, refers to unique user with User ID |
| User capture | User with captured information |
| User connections | User connections with status u200 and type ui,ai |
| User ID | Unique user identifier |
| User request | User authentication request (Accept/Reject) |
| Users | Menu for user profiles and AAA transactions |
Device & Network Analytics
| Term | Definition |
|---|---|
| Bandwidth | Consumed bandwidth by download, upload and total |
| Device | Type of subscriber device connected to the network (PC, Mobile, Tablet) |
| Group | Division of reports by source: Accounting, Authentication, Hotspots, Portal Events, AD Events |
Advertising & Marketing
| Term | Definition |
|---|---|
| Advertising | Menu for advertising management |
| Banner | Graphic advertising image displayed, also known as an ad |
| Campaign | A set of ads from an organization |
| Views/Clicks | Views (count of ads served to a user) and Clicks (count of user interactions with an ad) |
Data Analysis & Statistics
| Term | Definition |
|---|---|
| Average | Calculated by dividing the sum of the values in a set by their number |
| Trend | General movement over time of a statistically detectable change |
System & Localization
| Term | Definition |
|---|---|
| ES | Spanish translation |
Hotspots Reports
Overview
The Hotspots Reports section provides comprehensive analytics for Access Points (AP) and their locations across different geographical hierarchies. These reports enable you to monitor and analyze hotspot distribution and performance metrics over time.
Available Reports
Access Points Reports
Track Access Point distribution and trends across various geographical levels:
| Report Name | Description | Group |
|---|---|---|
| Access Points by country and state | AP by country and state over time | Hotspot |
| Access Points by country and city | AP by country and city over time | Hotspot |
| Access Points by country and municipality | AP by country and municipality over time | Hotspot |
| Access Points by country and region | AP by country and region over time | Hotspot |
Location Reports
Analyze Access Point locations and their geographical distribution:
| Report Name | Description | Group |
|---|---|---|
| Locations by country and state | AP locations by country and state over time | Hotspot |
| Locations by country and city | AP locations by country and city over time | Hotspot |
| Locations by country and municipality | AP locations by country and municipality over time | Hotspot |
| Locations by country and region | AP locations by country and region over time | Hotspot |
Report Categories
All hotspot reports are organized within the Hotspot group for easy navigation and management within the GATE portal interface.
Records, Transactions and Logs
User Records
Each user registered on the platform is stored in a database table with the following fields:
| Field | Description |
|---|---|
| ID | Incremental and unique ID (platform-wide) for the user |
| Username | Unique username registered, selected, or assigned by the user |
| First-name | First name of the user |
| Last-name | Last name of the user |
| Email address of the user | |
| Valid Email | Boolean field indicating if the email address was validated |
| Email Class | Regular, Catch-all, Disposable, or Unknown |
| Active | Boolean flag indicating if the user is active |
| Class | Class of service or class of user |
| Date-joined | Date and time when the user was registered or entered in the database |
| Organization | Used in multi-tier or multi-tenant applications to group requests for a specific organization or sub-organization |
| Source | Authorization service used to register and authenticate this user |
| Avatar | Binary field with an image used as an avatar |
| Avatar-URL | URL for an external avatar |
| Expiration | User's expiration date and time |
| Gender | Male, Female, or Other |
| Age range | Indication of the user's age range |
| Birthday | Birth date of the user |
| Locale | Detected locale for the user |
| Address | Address of the user |
| City | City of the user |
| State | State of the user |
| Country | Country of the user |
| Hometown | Hometown/birthplace of the user |
| Location | Current/last location of the user |
| Telephone | Telephone number of the user |
| Valid Telephone | Boolean field indicating if the telephone number was validated |
| Telephone Class | Landline, Mobile, or Unknown |
| Telephone Network Code | MCC-MNC telephone carrier code |
| Telephone Carrier Name | Name of the carrier that corresponds to the obtained telephone network code |
| Telephone Country | Country of origin for the telephone number |
| Company | Name of the user's company |
| Title | Job title of the user |
| Event | Name of the event during which the user information was captured |
| Optional fields | Optional fields that can be used to capture customized information |
Location Records
Each location registered on the platform is stored in a database table with the following fields:
| Field | Description |
|---|---|
| ID | Incremental and unique ID (platform-wide) for the location |
| Name | Name of the location as assigned by the administrator |
| Is Active | Boolean indication if the location is active |
| Short Name | Short name or code assigned to the location by the administrator |
| UUID | UUID identifier for the location (generated by the platform) |
| Timezone | Timezone for the location |
| Organization | Used in multi-tier or multi-tenant applications to group requests for a specific organization or sub-organization |
| Description | Description of the object or record |
| Address | Address of the location |
| Reference | Geographical reference for the location |
| City | City of the location |
| Postal Code | Postal code of the location |
| State | State of the location |
| Region | Region of the location |
| Country Code | ISO country code of the location |
| Latitude | Latitude coordinates of the location |
| Longitude | Longitude coordinates of the location |
| Last change | Date and time of the last change to the location's information |
| Created | Date and time when the location was created |
Access Point Records
Each access point registered on the platform is stored in a database table with the following fields:
| Field | Description |
|---|---|
| ID | Incremental and unique ID (platform-wide) for the access point |
| Name | Name of the access point as assigned by the administrator |
| Short Name | Short name or code assigned to the access point by the administrator |
| Is Active | Boolean indication if the access point is active |
| Organization | Used in multi-tier or multi-tenant applications to group requests for a specific organization or sub-organization |
| Description | Description of the object or record |
| Location ID | ID of the location that this access point belongs to |
| Zone | Zone reference of the access point within the location |
| IP Address | IP address of the access point |
| MAC address | MAC address of the access point |
| MAC address (secondary) | Secondary MAC address of the access point |
| Serial | Serial number of the access point |
| Version | Software version of the access point |
| Latitude | Latitude coordinates of the access point |
| Longitude | Longitude coordinates of the access point |
| Last change | Date and time of the last change to the access point's information |
| Created | Date and time when the access point was created |
Log Types
User Portal Event Logs
To be completed
AAA Logs
To be completed
Advertisement Logs
To be completed
Report Name Reference
Overview
The GATE portal has implemented a comprehensive report naming update to improve clarity and organization. All reports are now grouped by function and feature standardized naming conventions for better usability.
This reference list provides the equivalent name for each report and includes a glossary of terms to help you understand the new naming structure.
Report Categories
Reports are organized into the following functional groups:
- Portal Events - User authentication, transactions, and portal activity
- Hotspot - Access Point location and geographic data
- Authentication - AAA authentication requests and responses
- Accounting - AAA session tracking and bandwidth usage
- AD Events - Advertising campaign performance and user interactions
USERS Reports
| Previous Report Name | New Report Name | Group |
|---|---|---|
| Active Access Point MAC addresses | Active AP address trend | Portal Events |
| Active Access Point MAC addresses from successful login transactions | AP address trend with Log in | Portal Events |
| Active Access Point MAC addresses per Organization | Active AP address trend, by organization | Portal Events |
| Active Access Point MAC addresses without matching Access Point | Active AP address trend without AP | Portal Events |
| Detailed user login transactions report ES: Reporte detallado de transacciones de login de usuario |
User Log in detail over time | Portal Events |
| Detailed user transactions report ES: Reporte detallado de transacciones de usuario |
User transactions detail over time | Portal Events |
| Error user transactions by status and error message ES: Transacciones de usuario con error por estado y mensaje de error |
Transaction error message trend, by status | Portal Events |
| Error user transactions by status, error message and page ES: Transacciones de usuario con error por estado, mensaje de error y página |
Transaction error message trend, by status and page | Portal Events |
| Error user transactions by type ES: Transacciones de usuario con error por tipo |
Transaction error type trend | Portal Events |
| Error user transactions by type and location ES: Transacciones de usuario con error por tipo y localidad |
Transaction error type trend, by location | Portal Events |
| Error user transactions by type and location group ES: Transacciones de usuario con error por tipo y grupo de localidades |
Transaction error type trend, by location group | Portal Events |
| Error user transactions by type and page ES: Transacciones de usuario con error por tipo y página |
Transaction error type trend, by page | Portal Events |
| Error user transactions by type and service ES: Transacciones de usuario con error por tipo y servicio |
Transaction error type trend, by service | Portal Events |
| Error user transactions by type, service and page ES: Transacciones de usuario con error por tipo, servicio y página |
Transaction error type trend, by service and page | Portal Events |
| List of active Access Point MAC addresses | Transactions by AP address over time | Portal Events |
| Number of distinct MAC addresses with connections ES: Usuario Top con conexiones |
AP address ID connections trend | Portal Events |
| Number of distinct MAC addresses with connections average by organization | AP address ID connections, by organization over time | Portal Events |
| Number of distinct MAC addresses with connections by organization | AP address ID connections trend, by organization | Portal Events |
| Number of distinct user classes with connections | User classes with connections trend | Portal Events |
| Number of distinct user external IDs with connections | External user ID with connections trend | Portal Events |
| Number of distinct usernames with connections ES: Número de usuarios distintos con conexiones |
User connections trend | Portal Events |
| Number of distinct usernames with connections by page ES: Número de usuarios distintos con conexiones por página |
User connections trend, by page | Portal Events |
| Number of distinct usernames with connections per device type | User device trend | Portal Events |
| Number of new, existing and total users with connections ES: Número de usuarios nuevos, existentes y totales con conexiones |
User trend, by new/existing | Portal Events |
| Number of new, existing and total users with connections by AAA profile ES: Número de usuarios nuevos, existentes y totales con con conexiones por perfil AAA |
User trend, by new/existing and AAA profile | Portal Events |
| Number of new, existing and total users with connections by Access Point group | User trend, by new/existing and AP group | Portal Events |
| Number of new, existing and total users with connections by Location ES: Número de usuarios nuevos, existentes y totales con conexiones por localidad |
User trend, by new/existing and Location | Portal Events |
| Number of new, existing and total users with connections by Location group ES: Número de usuarios nuevos, existentes y totales con conexiones por grupo de localidades |
User trend, by new/existing and Location group | Portal Events |
| Number of users with connections ES: Número de usuarios con conexiones |
Session trend | Portal Events |
| Number of users with connections by AAA profile ES: Número de usuarios con conexiones por perfil AAA |
Session trend, by AAA profile | Portal Events |
| Number of users with connections by Location ES: Número de usuarios con conexiones por localidad |
Session trend, by Location | Portal Events |
| Number of users with connections by Location group ES: Número de usuarios con conexiones por grupo de localidades |
Session trend, by Location group | Portal Events |
| Number of users with connections per device type | Session trend, by device type | Portal Events |
| Successful user captures by service ES: Capturas de usuario exitosas por servicio |
User capture trend, by service | Portal Events |
| Successful user login transaction rate per Access Point group and number of Access Points | Average log in trend, by Access Point group | Portal Events |
| Successful user login transactions ES: Inicio de sesión de usuario exitosa |
Log in trend | Portal Events |
| Successful user login transactions average by organization | Average log in by organization over time | Portal Events |
| Successful user login transactions by Access Point ES: Inicio de sesión de usuario exitoso por access point |
Log in trend, by Access Point | Portal Events |
| Successful user login transactions by Access Point installation type | Log in trend, by Indoor/Outdoor AP | Portal Events |
| Successful user login transactions by Access Point installation type and page | Log in trend, by Indoor/Outdoor AP and page | Portal Events |
| Successful user login transactions by Location ES: Inicio de sesión de usuario exitoso por localidad |
Log in trend, by location | Portal Events |
| Successful user login transactions by Location group ES: Inicio de sesión de usuario exitoso por grupo de localidades |
Log in trend, by location group | Portal Events |
| Successful user login transactions by Location group and state | Log in trend, by location group and state | Portal Events |
| Successful user login transactions by device type | Log in trend, by device type | Portal Events |
| Successful user login transactions by organization ES: Inicio de sesión de usuario exitoso por organization |
Log in trend, by organization | Portal Events |
| Successful user login transactions by page ES: Inicio de sesión de usuario exitoso por página |
Log in trend, by page | Portal Events |
| Successful user login transactions by service ES: Inicio sesión de usuario exitoso por servicio |
Log in trend, by service | Portal Events |
| Successful user login transactions by service and page ES: Inicio de sesión de usuario exitoso por servicio y página |
Log in trend, by service and page | Portal Events |
| Successful user login transactions by service, page and location ES: Inicio de sesión de usuario exitoso por servicio, página y localidad |
Log in trend, by service, page and location | Portal Events |
| Successful user login transactions by service, page and location group ES: Inicio de sesión de usuario exitoso por servicio, página y grupo de localidades |
Log in trend, by service, page and location group | Portal Events |
| Successful user logins by OS family ES: Cantidad de inicios de sesión de usuario por familia del SO |
Log in by OS family over time | Portal Events |
| Successful user transactions by Access Point group | Log in trend, by AP group | Portal Events |
| Successful user transactions by Access Point with Location | Log in trend, by AP and Location | Portal Events |
| Successful user transactions by Access Point with No Location | Log in with no location trend, by AP | Portal Events |
| Successful user transactions by Location ES: Transacciones de usuario exitosas por localidad |
User transactions trend, by location | Portal Events |
| Successful user transactions by Location group ES: Transacciones de usuario exitosas por grupo de localidades |
User transactions trend, by location group | Portal Events |
| Successful user transactions by organization ES: Transacciones exitosas de usuario exitosas por organization |
User transactions trend, by organization | Portal Events |
| Successful user transactions by organization and type ES: Transacciones exitosas de usuario por oranization y tipo |
User transactions trend, by organization and type | Portal Events |
| Successful user transactions by type | User transactions trend, by type | Portal Events |
| Successful user transactions by type and location ES: Transacciones de usuario exitosas por tipo y localidad |
User transactions trend, by type and location | Portal Events |
| Successful user transactions by type and location group ES: Transacciones de usuario exitosas por tipo y grupo de localidades |
User transactions trend, by type and location group | Portal Events |
| Successful user transactions by type and page ES:Transacciones de usuario exitosas por tipo y página |
User transactions trend, by type and page | Portal Events |
| Successful user transactions by type and service ES: Transacciones de usuario exitosas por tipo y servicio |
User transactions trend, by type and service | Portal Events |
| Successful user transactions by type, service and page ES: Transacciones de usuario exitosas por tipo, servicio y página |
User transactions trend, by type, service and page | Portal Events |
| Successful user transactions by type, service, page and location ES: Transacciones de usuario exitosas por tipo, servicio, página y localidad |
User transactions trend, by type, service, page and location | Portal Events |
| Successful user transactions by type, service, page and location group ES: Transacciones de usuario exitosas por tipo, servicio, página y grupo de localidades |
User transactions trend, by type, service, page and location group | Portal Events |
| Top users with connections ES: Usuario Top con conexiones |
Top-ranked users Log in over time | Portal Events |
| User transactions by OS family ES: Transacciones de usuario por familia de SO |
User OS family over time | Portal Events |
| User transactions by browser family ES: Transacciones de usuario por familia del navegador |
User browser family over time | Portal Events |
| User transactions by device brand ES: Transacciones de usuario por marca del dispositivo |
User device brand over time | Portal Events |
| User transactions by device brand and location | User device brand by location over time | Portal Events |
| User transactions by service ES: Transacciones de usuario por service |
User transactions trend, by service | Portal Events |
| User transactions by status ES: Transacciones de usuario por estado |
User transactions trend, by status | Portal Events |
| User transactions by type and user's age ES: Transacciones de usuario por tipo y edad del usuario |
User transactions by type and age over time | Portal Events |
| User transactions by type and user's age (from birthday) ES: Transacciones por tipo y edad del usuario (fecha de cumpleaños) |
User transactions by type and age (from birthday) over time | Portal Events |
| User transactions by type and user's age range ES: Transacciones de usuario por tipo y rango de edad del usuario |
User transactions by type and age range over time | Portal Events |
| User transactions by type and user's country ES: Transacciones de usuario por tipo y pais del usuario |
User transactions by type and country over time | Portal Events |
| User transactions by type and user's country and state ES: Transacciones de usuario por tipo, país y estado del usuario |
User transactions by type, country and state over time | Portal Events |
| User transactions by type and user's gender ES: Transacciones de usuario por tipo y género del usuario |
User transactions by type and gender over time | Portal Events |
| User transactions by type and user's telephone country ES: Transacciones de usuario por tipo y país del teléfono del usuario |
User transactions by type and phone country code over time | Portal Events |
| User transactions by type, service, page and status ES: Transacciones de usuario por tipo, servicio, página y estado |
User trend, by type, service, page and status | Portal Events |
| Heatmap - Successful user transactions by Access Point | Total successful user transactions by Access Point | Portal Events |
| Heatmap - Successful user transactions by Location | Total successful user transactions by Location | Portal Events |
HOTSPOTS Reports
Geographic and location-based Access Point reports are categorized under Hotspot.
| Previous Report Name | New Report Name | Group |
|---|---|---|
| Access Points by country and state | AP by country and state over time | Hotspot |
| Access Points by country and city | AP by country and city over time | Hotspot |
| Access Points by country and municipality | AP by country and municipality over time | Hotspot |
| Access Points by country and region | AP by country and region over time | Hotspot |
| Locations by country and state | AP locations by country and state over time | Hotspot |
| Locations by country and city | AP locations by country and city over time | Hotspot |
| Locations by country and municipality | AP locations by country and municipality over time | Hotspot |
| Locations by country and region | AP locations by country and region over time | Hotspot |
AAA SERVICES Reports
Authentication, Authorization, and Accounting reports are split into Authentication and Accounting groups.
| Previous Report Name | New Report Name | Group |
|---|---|---|
| AAA Access Point MAC distribution by organization (Accounting table) | User activity, by organization over time | Accounting |
| AAA Access Point MAC distribution by organization and type | User requests, by accept/reject over time | Authentication |
| AAA accounting sessions | Sessions trend | Accounting |
| AAA accounting sessions by Access Point | Sessions trend, by AP | Accounting |
| AAA accounting sessions by Location | Sessions trend, by location | Accounting |
| AAA accounting sessions by NAS Client | Sessions trend, by NAS client | Accounting |
| AAA accounting sessions by Realm | Sessions trend, by realm | Accounting |
| AAA accounting sessions by organization | Sessions trend, by organization | Accounting |
| AAA accounting traffic per Location and Organization (GBytes) | Bandwidth by location and organization over time, GBytes | Accounting |
| AAA accounting traffic per location (GBytes) | Bandwidth by location over time, GBytes | Accounting |
| AAA accounting traffic per user (GBytes) ES: Trafico (accounting AAA) de por usuario (Gbytes) |
Bandwidth detail by users over time, GBytes | Accounting |
| AAA active Access Point MAC addresses (Accounting table) | Sessions trend, by AP address | Accounting |
| AAA active Access Point MAC addresses per NAS client (Accounting table) | Sessions trend, by AP address and NAS client | Accounting |
| AAA active Access Point MAC addresses per Organization (Accounting table) | Sessions trend, by AP address and organization | Accounting |
| AAA active Access Point MAC addresses per organization | Accepted Sessions trend, by AP address and organization | Authentication |
| AAA active sessions | Active sessions trend | Accounting |
| AAA active sessions per NAS Client ES: Número de sesiones AAA activas por NAS Client |
Active sessions trend, by NAS client | Accounting |
| AAA active sessions per Organization | Active sessions trend, by organization | Accounting |
| AAA active sessions per Realm ES: Número de sesiones AAA activas por realm |
Active sessions trend, by realm | Accounting |
Reports Page Reference
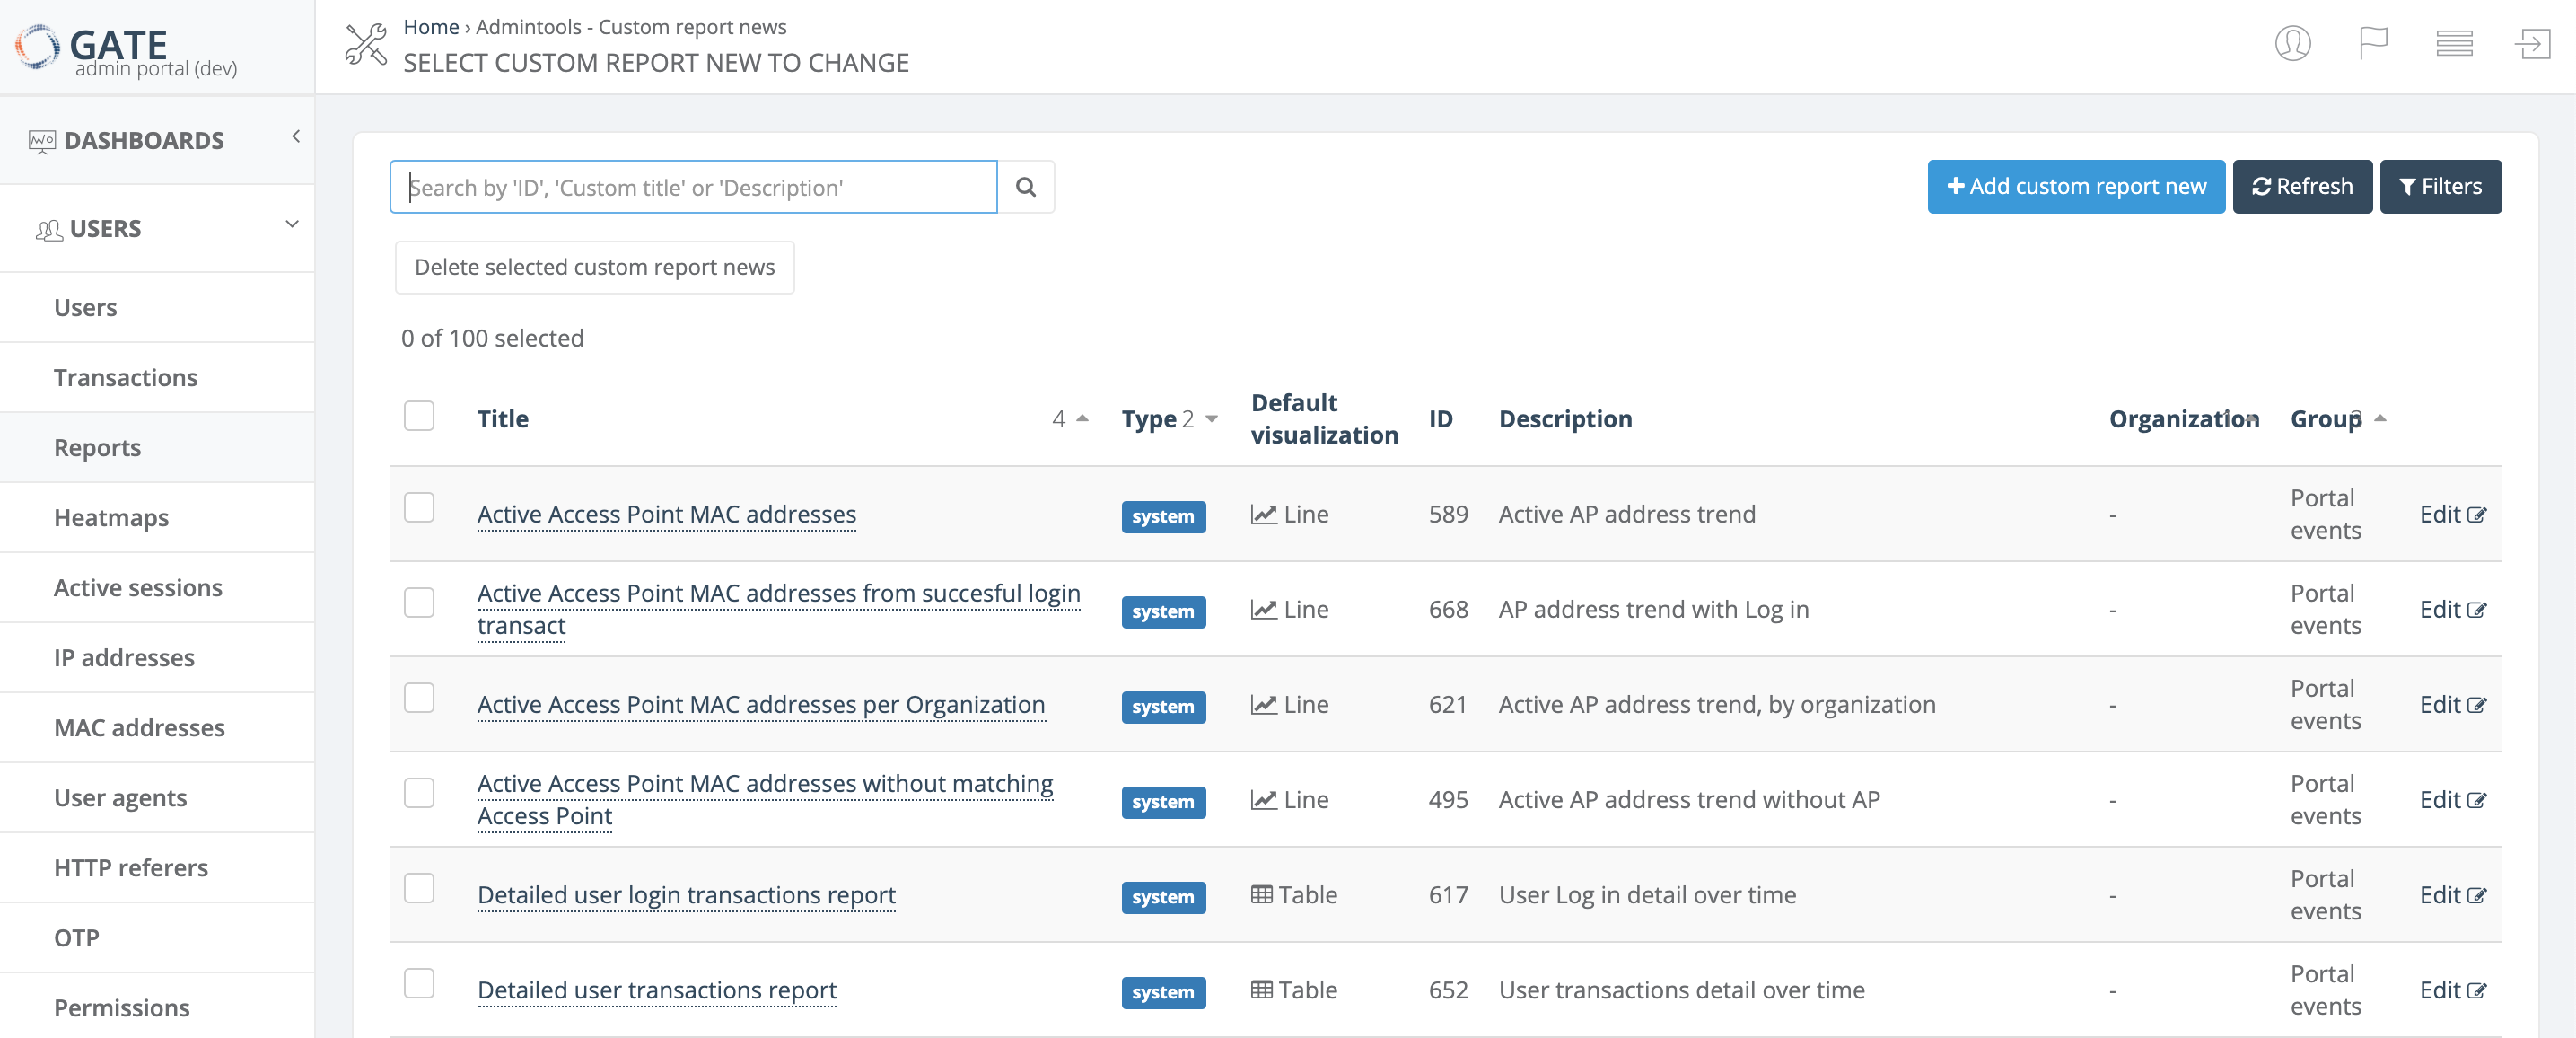
The Reports page in GATE provides a comprehensive view of all available reports with powerful search, filtering, and management capabilities. This page serves as your central hub for accessing both system reports and custom reports.
Report List Columns
The reports list displays the following information for each report:
| Column | Description |
|---|---|
| Title | The report name. See detailed reference for naming conventions |
| Type | Indicates whether the report is a system report or custom report |
| Default visualization | The default chart type used when displaying the report: Table, Line, Bar, Pie, or Heatmap |
| ID | Unique report identifier |
| Description | Brief description of the report's purpose and content. See detailed reference |
| Organization | The organization associated with the report |
| Group | Report category grouping. See detailed reference |
Available Actions
Search and Navigation
- Search - Find reports by Title, Description, Group, or ID. You can search using partial text matches or by a single word included in any of these fields
- Refresh - Update the current list to display the latest reports
-
Filters - Narrow down the report list using multiple criteria:
- Group
- Report type (system or custom)
- Default visualization type
- Organization
Report Management
- Add new custom report - Create a new custom report from scratch
- Edit - Modify an existing custom report (only available for custom reports)
- Delete selected custom report - Remove a custom report by selecting it using the checkbox on the left side of the row
Note: System reports cannot be edited or deleted, only custom reports can be modified or removed.
Users Reports
Overview
This section provides a comprehensive list of user-related reports available in GATE. These reports help administrators monitor user activity, track login patterns, analyze connection trends, and troubleshoot authentication issues across the portal system.
All reports are categorized under the Portal Events group and provide various filtering and segmentation options to help you analyze user behavior and system performance.
Available Reports
Access Point Monitoring
| Report Name | Description | Group |
|---|---|---|
| Active Access Point MAC addresses | Active AP address trend | Portal Events |
| Active Access Point MAC addresses from successful login transactions | AP address trend with login | Portal Events |
| Active Access Point MAC addresses per Organization | Active AP address trend, by organization | Portal Events |
| Active Access Point MAC addresses without matching Access Point | Active AP address trend without AP | Portal Events |
| List of active Access Point MAC addresses | Transactions by AP address over time | Portal Events |
User Login Analytics
| Report Name | Description | Group |
|---|---|---|
| Detailed user login transactions report | Subscriber login detail over time | Portal Events |
| Successful user login transactions | Login trend | Portal Events |
| Successful user login transactions average by organization | Average login by organization over time | Portal Events |
| Successful user login transactions by Access Point | Login trend, by Access Point | Portal Events |
| Successful user login transactions by Access Point installation type | Login trend, by Indoor/Outdoor AP | Portal Events |
| Successful user login transactions by Access Point installation type and page | Login trend, by Indoor/Outdoor AP and page | Portal Events |
| Successful user login transactions by Location | Login trend, by location | Portal Events |
| Successful user login transactions by Location group | Login trend, by location group | Portal Events |
| Successful user login transactions by Location group and state | Login trend, by location group and state | Portal Events |
| Successful user login transactions by device type | Login trend, by device type | Portal Events |
| Successful user login transactions by organization | Login trend, by organization | Portal Events |
| Successful user login transactions by page | Login trend, by page | Portal Events |
| Successful user login transactions by service | Login trend, by service | Portal Events |
| Successful user login transactions by service and page | Login trend, by service and page | Portal Events |
| Successful user login transactions by service, page and location | Login trend, by service, page and location | Portal Events |
| Successful user login transactions by service, page and location group | Login trend, by service, page and location group | Portal Events |
| Successful user login transaction rate per Access Point group and number of Access Points | Average login trend, by Access Point group | Portal Events |
| Successful user logins by OS family | Login by OS family over time | Portal Events |
Connection Statistics
| Report Name | Description | Group |
|---|---|---|
| Number of distinct MAC addresses with connections | AP address ID connections trend | Portal Events |
| Number of distinct MAC addresses with connections average by organization | AP address ID connections, by organization over time | Portal Events |
| Number of distinct MAC addresses with connections by organization | AP address ID connections trend, by organization | Portal Events |
| Number of distinct user classes with connections | Subscriber classes with connections trend | Portal Events |
| Number of distinct user external IDs with connections | External subscriber ID with connections trend | Portal Events |
| Number of distinct usernames with connections | Subscriber connections trend | Portal Events |
| Number of distinct usernames with connections by page | Subscriber connections trend, by page | Portal Events |
| Number of distinct usernames with connections per device type | Subscriber device trend | Portal Events |
| Number of users with connections | Session trend | Portal Events |
| Number of users with connections by AAA profile | Session trend, by AAA profile | Portal Events |
| Number of users with connections by Location | Session trend, by Location | Portal Events |
| Number of users with connections by Location group | Session trend, by Location group | Portal Events |
| Number of users with connections per device type | Session trend, by device type | Portal Events |
User Segmentation
| Report Name | Description | Group |
|---|---|---|
| Number of new, existing and total users with connections | Subscriber trend, by new/existing | Portal Events |
| Number of new, existing and total users with connections by AAA profile | Subscriber trend, by new/existing and AAA profile | Portal Events |
| Number of new, existing and total users with connections by Access Point group | Subscriber trend, by new/existing and AP group | Portal Events |
| Number of new, existing and total users with connections by Location | Subscriber trend, by new/existing and Location | Portal Events |
| Number of new, existing and total users with connections by Location group | Subscriber trend, by new/existing and Location group | Portal Events |
| Top users with connections | Top-ranked subscribers login over time | Portal Events |
Transaction Analysis
| Report Name | Description | Group |
|---|---|---|
| Detailed user transactions report | Subscriber transactions detail over time | Portal Events |
| Successful user captures by service | Subscriber capture trend, by service | Portal Events |
| Successful user transactions by Access Point group | Login trend, by AP group | Portal Events |
| Successful user transactions by Access Point with Location | Login trend, by AP and Location | Portal Events |
| Successful user transactions by Access Point with No Location | Login with no location trend, by AP | Portal Events |
| Successful user transactions by Location | Subscriber transactions trend, by location | Portal Events |
| Successful user transactions by Location group | Subscriber transactions trend, by location group | Portal Events |
| Successful user transactions by organization | Subscriber transactions trend, by organization | Portal Events |
| Successful user transactions by organization and type | Subscriber transactions trend, by organization and type | Portal Events |
| Successful user transactions by type | Subscriber transactions trend, by type | Portal Events |
| Successful user transactions by type and location | Subscriber transactions trend, by type and location | Portal Events |
| Successful user transactions by type and location group | Subscriber transactions trend, by type and location group | Portal Events |
| Successful user transactions by type and page | Subscriber transactions trend, by type and page | Portal Events |
| Successful user transactions by type and service | Subscriber transactions trend, by type and service | Portal Events |
| Successful user transactions by type, service and page | Subscriber transactions trend, by type, service and page | Portal Events |
| Successful user transactions by type, service, page and location | Subscriber transactions trend, by type, service, page and location | Portal Events |
| Successful user transactions by type, service, page and location group | Subscriber transactions trend, by type, service, page and location group | Portal Events |
| User transactions by service | Subscriber transactions trend, by service | Portal Events |
| User transactions by status | Subscriber transactions trend, by status | Portal Events |
| User transactions by type, service, page and status | Subscriber trend, by type, service, page and status | Portal Events |
Error Reporting
| Report Name | Description | Group |
|---|---|---|
| Error user transactions by status and error message | Transaction error message trend, by status | Portal Events |
| Error user transactions by status, error message and page | Transaction error message trend, by status and page | Portal Events |
| Error user transactions by type | Transaction error type trend | Portal Events |
| Error user transactions by type and location | Transaction error type trend, by location | Portal Events |
| Error user transactions by type and location group | Transaction error type trend, by location group | Portal Events |
| Error user transactions by type and page | Transaction error type trend, by page | Portal Events |
| Error user transactions by type and service | Transaction error type trend, by service | Portal Events |
| Error user transactions by type, service and page | Transaction error type trend, by service and page | Portal Events |
Device and Browser Analytics
| Report Name | Description | Group |
|---|---|---|
| User transactions by OS family | Subscriber OS family over time | Portal Events |
| User transactions by browser family | Subscriber browser family over time | Portal Events |
| User transactions by device brand | Subscriber device brand over time | Portal Events |
| User transactions by device brand and location | Subscriber device brand by location over time | Portal Events |
Demographic Analysis
| Report Name | Description | Group |
|---|---|---|
| User transactions by type and user's age | Subscriber transactions by type and age over time | Portal Events |
| User transactions by type and user's age (from birthday) | Subscriber transactions by type and age (from birthday) over time | Portal Events |
| User transactions by type and user's age range | Subscriber transactions by type and age range over time | Portal Events |
| User transactions by type and user's country | Subscriber transactions by type and country over time | Portal Events |
| User transactions by type and user's country and state | Subscriber transactions by type, country and state over time | Portal Events |
| User transactions by type and user's gender | Subscriber transactions by type and gender over time | Portal Events |
| User transactions by type and user's telephone country | Subscriber transactions by type and phone country code over time | Portal Events |
Usage Notes
- All reports are real-time and can be filtered by date range
- Reports support multiple export formats for further analysis
- Demographic data is only available when users provide this information during registration
- Error reports help identify common authentication and connectivity issues
- Location-based reports require proper Access Point configuration with location assignments