FLUX Users Guide
Documentation for FLUX Users Guide
- OpenAI Integration
- Models
- PublicElementConfig
- Element Configurations
- Notifications
- Scripts with visualization feature
- Sequential flow designer basics
- Available steps for management scripts in task elements
- Available steps table
- Task
- Flow
- Dashboard: Main
- Elements
- Automation models
- Automation tasks
- Automation flows
- Automation schedules
- Services
- Metric logs
- Automation Contexts
OpenAI Integration
Introduction
FLUX provides integration with the OpenAI API, enabling you to create elements that leverage artificial intelligence capabilities within your workflows.
Overview
The OpenAI integration is implemented through two key components:
- OpenAI API Profile – Provides the configuration and credentials needed to connect with OpenAI services
- OpenAI Element Group – Contains specialized elements that interact with the OpenAI API to send questions and receive AI-generated responses
You can view the profile configuration here: OpenAI API Profile Example
Available OpenAI Elements
FLUX includes several pre-built elements that demonstrate OpenAI integration capabilities:
Python Helper
- Purpose: Generates Python code to extract variables from files
- Use Case: Used by other models to automatically create Python code that extracts variables from test data into a dictionary format
- Link: View Element
TTP Helper
- Purpose: Generates TTP (Template Text Parser) models from test data
- Use Case: Used by other models to create TTP templates capable of extracting variables from test data into a dictionary format
- Link: View Element
JSON Query
- Purpose: Performs complex queries on JSON data structures
- Use Case: Used by PublicElementConfig to execute advanced JSON queries
- Link: View Element
Using OpenAI Elements in Your Code
To integrate OpenAI elements into your code, follow these steps:
- Locate the Element – Search for the Element that contains your desired OpenAI model
-
Invoke the Function – Call
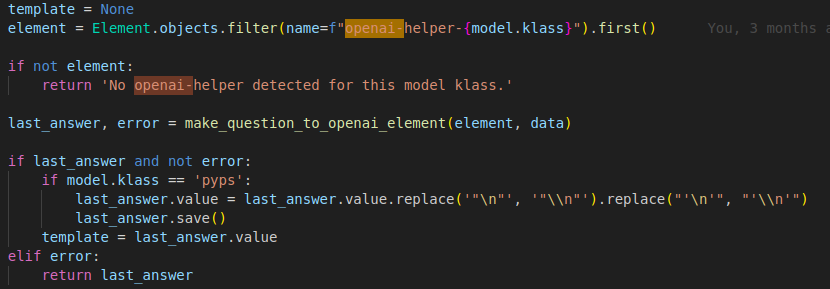
make_question_to_openai_element()with your question as the second parameter - Receive the Response – The function returns the OpenAI-generated answer
How It Works
The make_question_to_openai_element() function executes an OpenAI API call using:
- The base model context
- Previous conversation history (if any)
- Your current question
The function then returns the AI-generated response for use in your application.
Example Implementation
Additional Resources
For detailed information on creating custom models with OpenAI integration capabilities, refer to the Models documentation page.
Models
Overview
Models in FLUX enable you to perform data transformations using different processing classes. Each model class requires specific formatting in the Model data field to define how data should be parsed and transformed.
You can validate your model's behavior by entering sample input in the Test data field and running a test to preview the output results.
Model Classes
CLI
Execute command-line instructions on a device.
Model data format: A command string that will be executed.
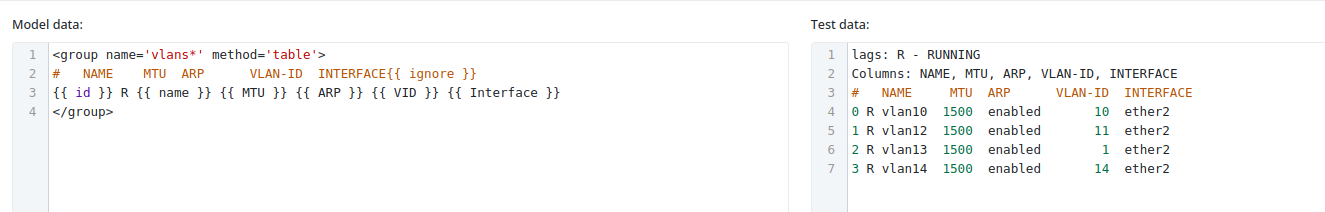
Structured Text
Process text containing variables in a structured format.
Model data format: Structured text with embedded variables.
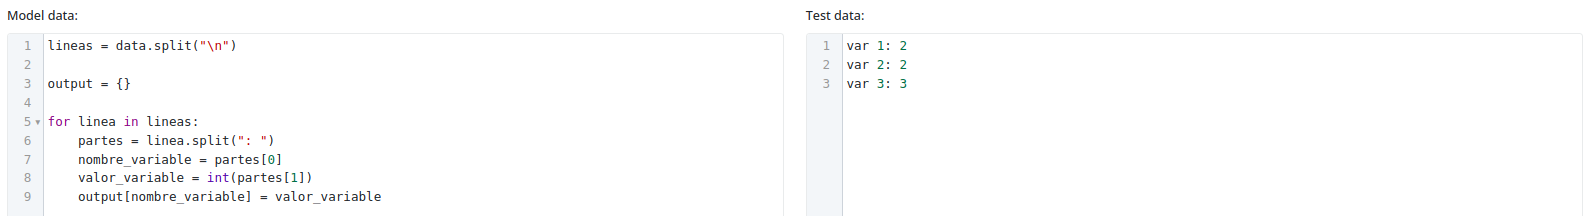
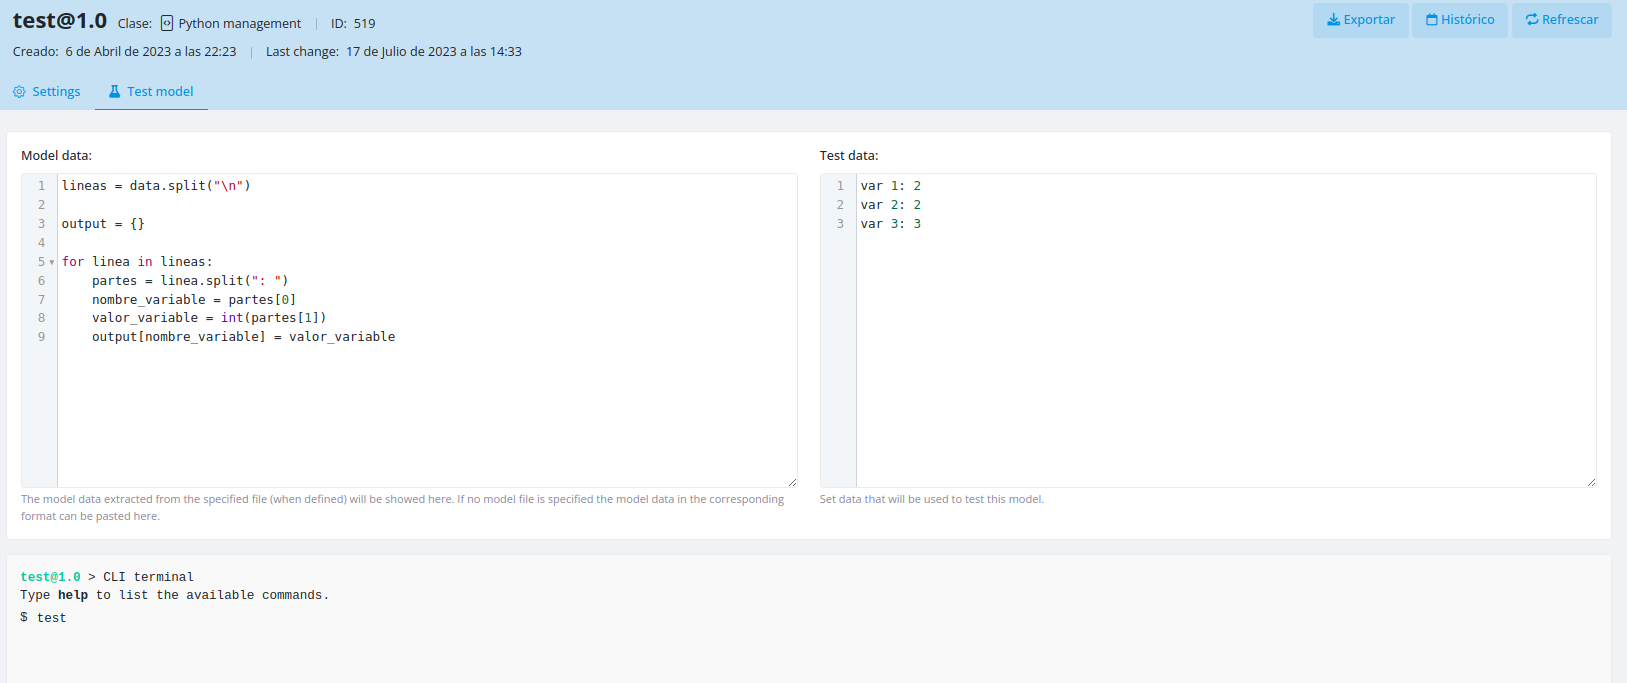
Python
Execute Python code to transform data.
Model data format: Python code that uses a data variable, which will be populated with the content from the Test data input.
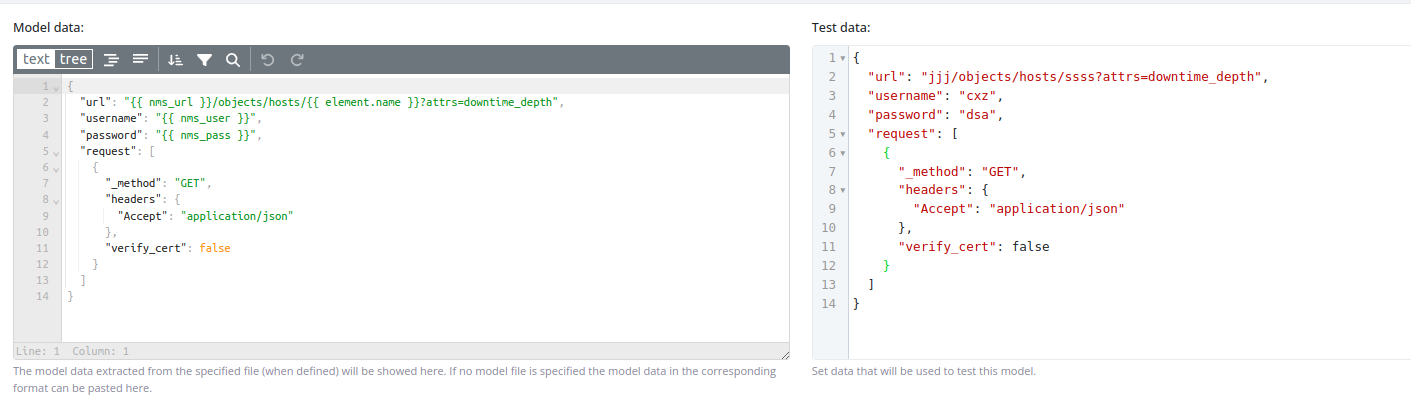
JSON & XML
Parse and transform JSON or XML data structures.
Model data format: JSON structure with variables.
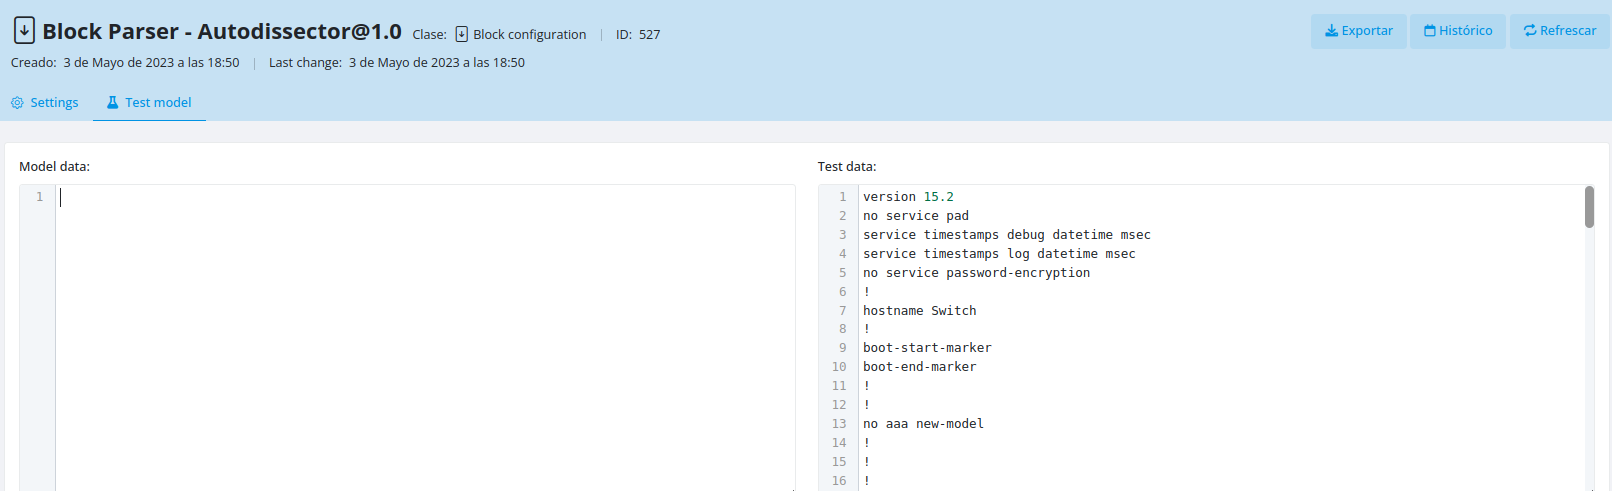
Block
Parse block-formatted files using custom or predefined rules.
Model data format: YAML parser configuration with multiple parsing rules.
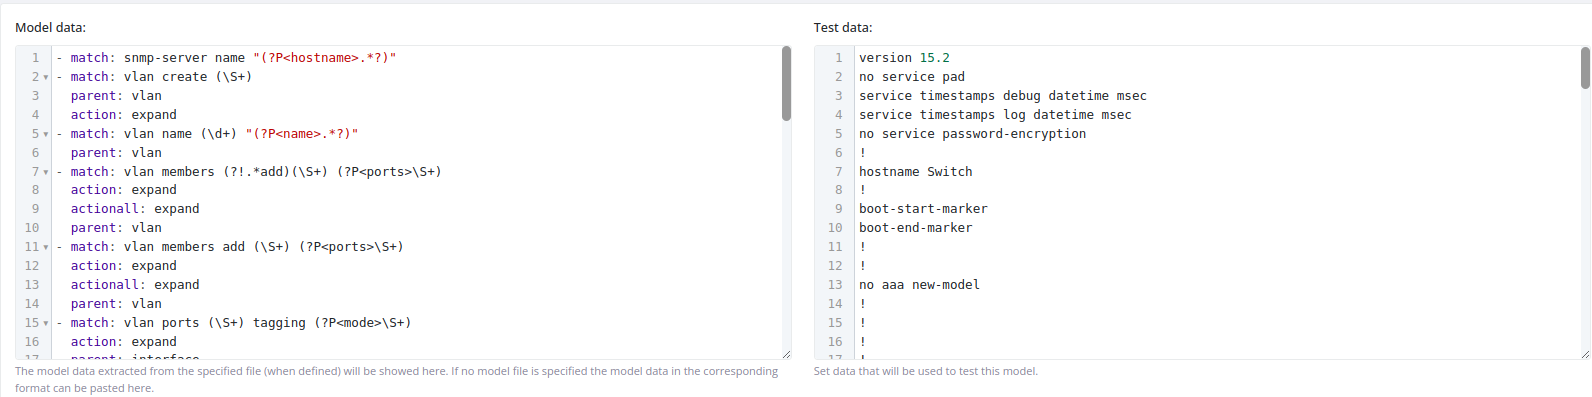
Using predefined rules: Leave the Model data field empty to automatically detect the block type and parse it using FLUX's built-in rules.
Testing Models
Basic Model Testing
Example:
Testing Against Element Context
You can test a model using the context of a specific element by entering the following in the Test data input:
id={x}
Replace {x} with the ID of the element whose context you want to use for testing.
Creating Model Templates with OpenAI
FLUX can generate model templates automatically using OpenAI based on your test data.
Prerequisites
- Create an empty model with your desired class
- Create an OpenAI helper element with the naming pattern:
openai-helper-{class}(where{class}matches your model class)
Steps
The system will call the openai-helper-{class} element, query the OpenAI API, print the generated template, and automatically evaluate it against your test data.
Dynamic Parameters
Models support dynamic variable substitution using element context data. Variables can be loaded in steps prior to model execution, allowing the model to replace them during transformation.
Example configuration:

Example usage:
PublicElementConfig
Overview
The PublicElementConfig class is used within FLUX task processing scripts to manage and validate element configurations. It provides methods for retrieving, comparing, and auditing configuration values across multiple formats.
Configuration Object
Attributes
The config object provides the following attributes:
| Attribute | Type | Description |
|---|---|---|
klass |
string | Format class of the current configuration. Supported values: txt, py, xml, json, yaml |
section |
string | Section identifier of the current configuration |
version |
string | Version identifier of the current configuration |
required_approvement_percentage |
integer | Minimum percentage of audit tests that must pass for the configuration to be considered approved |
audit_value |
integer | Final calculated result of the audit |
Methods
get_last_config()
Returns the most recent configuration for the current element.
Parameters: None
Returns: Configuration object
to_json()
Converts the current configuration to JSON format.
Parameters: None
Returns: JSON string representation of the configuration
get(key)
Retrieves a specific value from the configuration by key.
Parameters:
-
key(string) – The configuration key to retrieve
Returns: Value associated with the specified key
Example:
domain_value = config.get('domain_value')
compare_numeric_value(key, compare_operator, value, required_for_audit)
Compares a numeric configuration value against a specified value using a comparison operator.
Parameters:
-
key(string) – Configuration key to compare -
compare_operator(string) – Comparison operator:'>','>=','<','<=','==' -
value(integer) – Value to compare against -
required_for_audit(bool) – Whether this comparison is required for audit approval
Returns: Boolean result of the comparison
Example:
settings['audit.valid_domain'] = config.compare_numeric_value('size', '>=', 4, required_for_audit=True)
compare_string_value(key, compare_operator, value, required_for_audit)
Compares a string configuration value against a specified value using a comparison operator.
Parameters:
-
key(string) – Configuration key to compare -
compare_operator(string) – Comparison operator:'startswith','endswith','contains','==' -
value(string) – Value to compare against -
required_for_audit(bool) – Whether this comparison is required for audit approval
Returns: Boolean result of the comparison
Example:
settings['audit.valid_domain'] = config.compare_string_value('domain', 'startswith', 'https', required_for_audit=True)
check_key_matches(key_pattern, required_for_audit)
Checks whether any configuration key matches the specified pattern.
Parameters:
-
key_pattern(string) – Pattern to match against configuration keys (supports wildcards) -
required_for_audit(bool) – Whether this check is required for audit approval
Returns: Boolean indicating if a match was found
Example:
config.check_key_matches("interface.GigabitEthernet1.*", required_for_audit=True)
check_key_occurrences(key_pattern, compare_occurrences_operator, value, required_for_audit)
Counts the number of configuration keys matching a pattern and compares the count against a specified value.
Parameters:
-
key_pattern(string) – Pattern to match against configuration keys (supports wildcards) -
compare_occurrences_operator(string) – Comparison operator:'>','>=','<','<=','==' -
value(integer) – Number to compare the occurrence count against -
required_for_audit(bool) – Whether this check is required for audit approval
Returns: Boolean result of the comparison
Example:
config.check_key_occurrences("interface.*", ">=", 90, required_for_audit=True)
complex_compare(key_pattern, compare_str, required_for_audit)
Executes a complex comparison using OpenAI natural language processing to evaluate configuration values.
Parameters:
-
key_pattern(string) – Pattern to match against configuration keys -
compare_str(string) – Natural language description of the comparison criteria -
required_for_audit(bool) – Whether this comparison is required for audit approval
Returns: Boolean result of the comparison
Example:
config.complex_compare('interface.x', 'comienza con Virtual', required_for_audit=True)
Complete Example
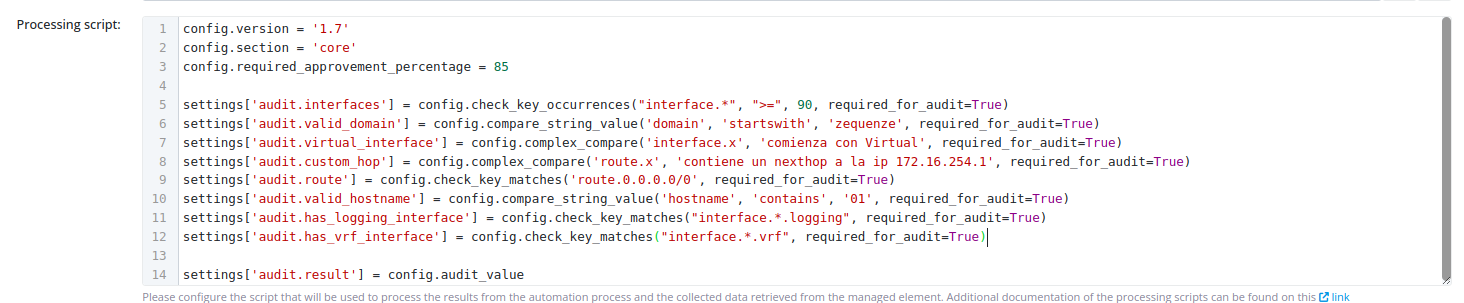
The following example demonstrates a comprehensive configuration audit script using multiple validation methods:
# Set configuration metadata
config.version = '1.7'
config.section = 'core'
config.required_approvement_percentage = 85
# Validate interface count
settings['audit.interfaces'] = config.check_key_occurrences("interface.*", ">=", 90, required_for_audit=True)
# Validate domain configuration
settings['audit.valid_domain'] = config.compare_string_value('domain', 'startswith', 'zequenze', required_for_audit=True)
# Complex validations using natural language
settings['audit.virtual_interface'] = config.complex_compare('interface.x', 'comienza con Virtual', required_for_audit=True)
settings['audit.custom_hop'] = config.complex_compare('route.x', 'contiene un nexthop a la ip 172.16.254.1', required_for_audit=True)
# Validate specific routing configuration
settings['audit.route'] = config.check_key_matches('route.0.0.0.0/0', required_for_audit=True)
# Validate hostname format
settings['audit.valid_hostname'] = config.compare_string_value('hostname', 'contains', '01', required_for_audit=True)
# Check for specific interface features
settings['audit.has_logging_interface'] = config.check_key_matches("interface.*.logging", required_for_audit=True)
settings['audit.has_vrf_interface'] = config.check_key_matches("interface.*.vrf", required_for_audit=True)
settings['audit.has_gigabit_interface'] = config.check_key_matches("interface.GigabitEthernet1.*", required_for_audit=True)
settings['audit.has_gigabit_two_interface'] = config.check_key_matches("interface.GigabitEthernet2.*", required_for_audit=True)
# Store final audit result
settings['audit.result'] = config.audit_value
Element Configurations
Overview
This guide explains how to use FLUX to create task flows that extract device configurations and perform automated audits. You'll learn how to configure audit parameters, set up automated extraction tasks, and review audit results.
Prerequisites
Before beginning, ensure you have:
- Access to FLUX with appropriate permissions
- Device profiles configured in your system
- Understanding of automation and processing models in FLUX
Step 1: Configure Element Parameters
Create a Parameter Group
First, add a parameter group to your element's profile to store configuration audit settings.
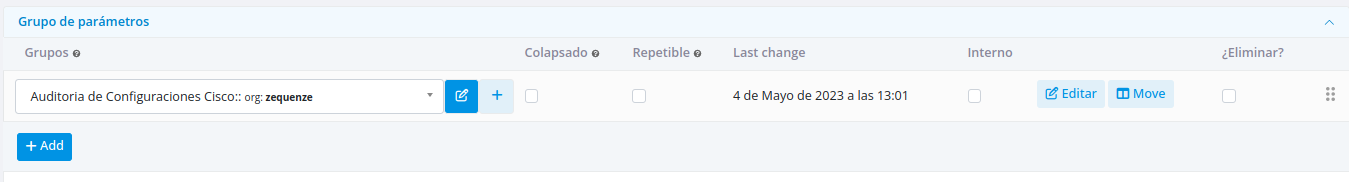
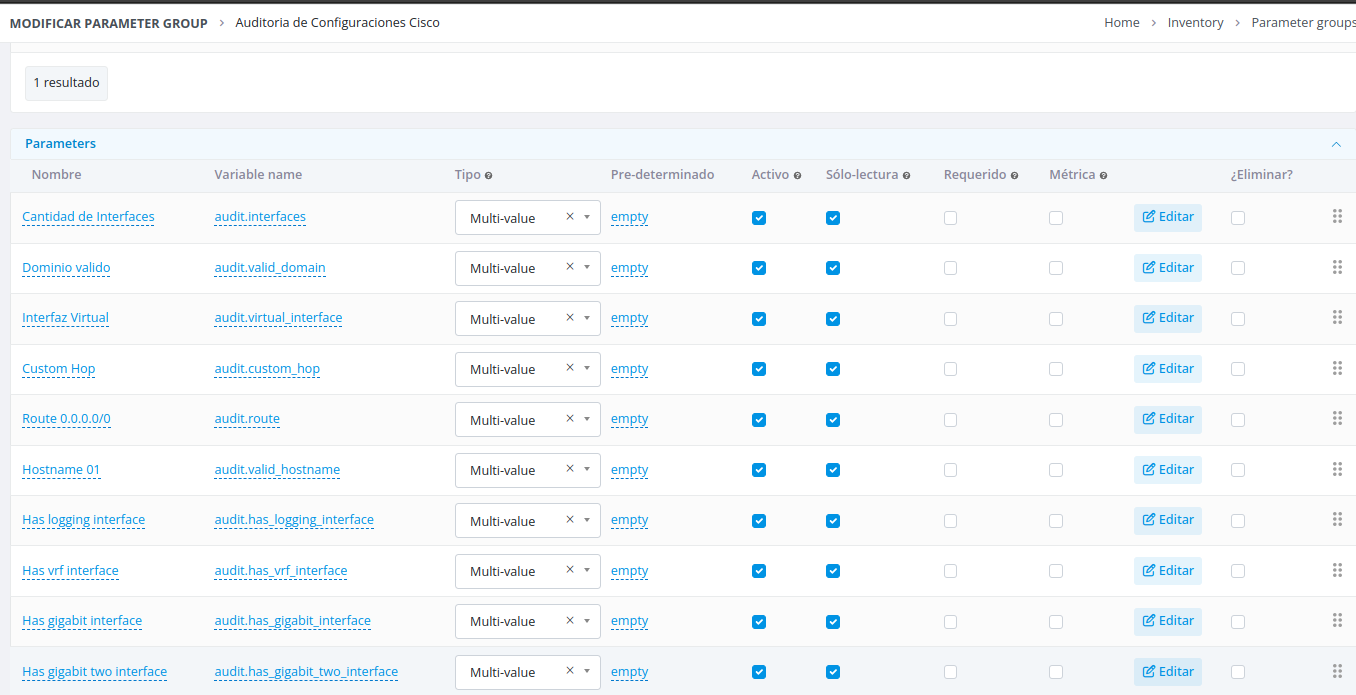
Define Audit Parameters
Create individual parameters for each configuration aspect you want to evaluate during the audit process.
Step 2: Create the Audit Task
Your audit task must perform three key functions:
- Extract the device configuration
- Parse the configuration into a manageable format
- Apply audit conditions using the parameters defined in Step 1
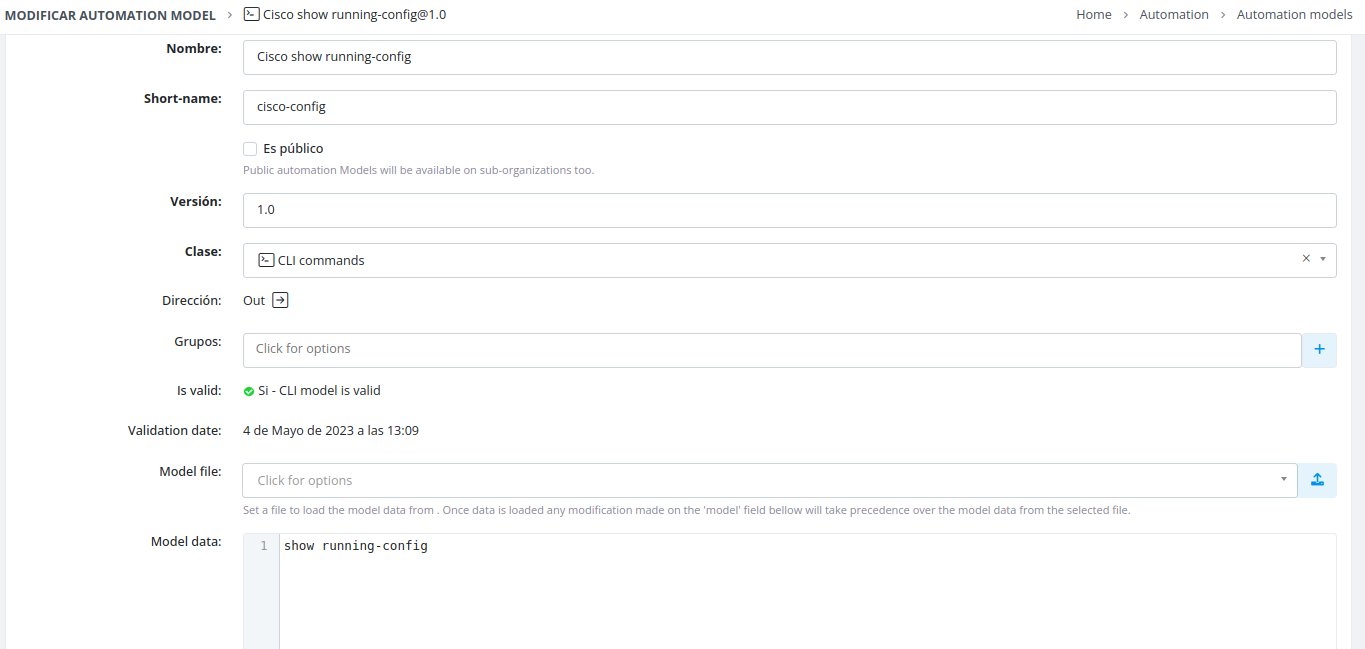
Extract Device Configuration
Create an automation model that executes a command on the target device to retrieve its configuration output.
Example: The following automation model extracts device configuration data.
Parse the Configuration
Create a processing model to parse the extracted configuration data into a structured format.
Example: The following processing model is configured to parse block text files (such as YAML files).
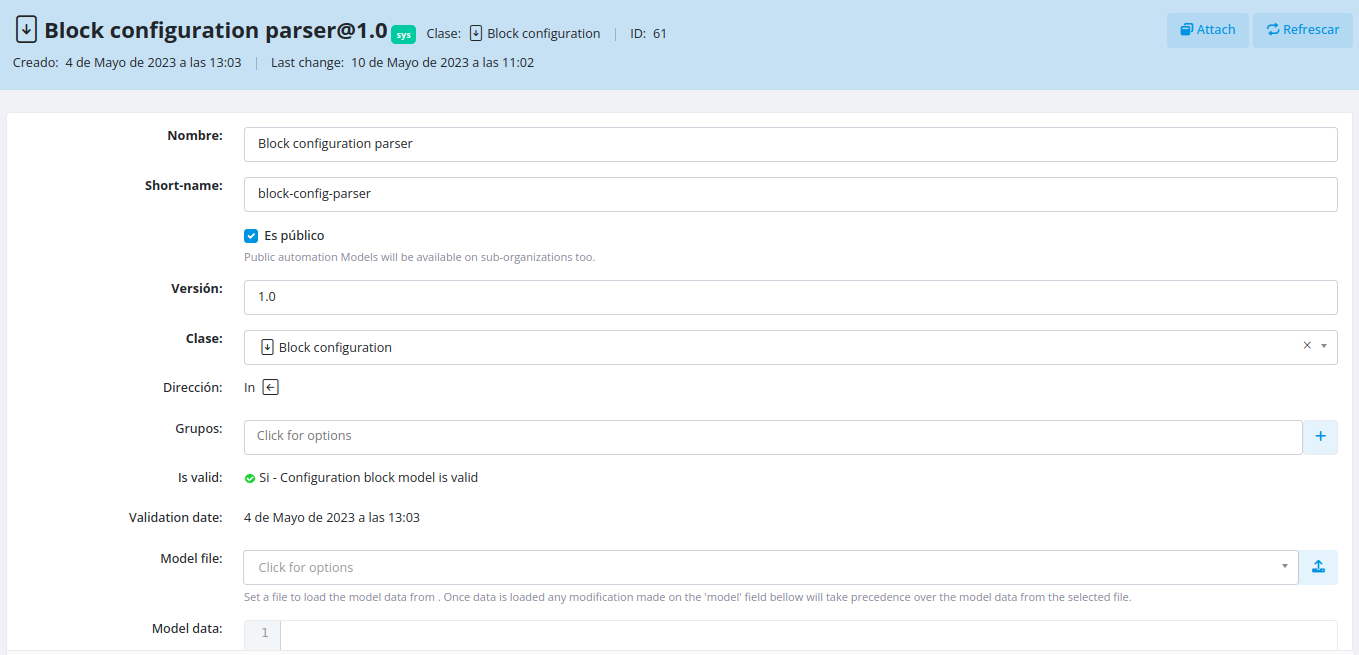
For more information about processing models, see the Models documentation.
Configure Audit Conditions
In your task processing script, define the configuration data and audit conditions using the element's parameters.
For detailed implementation guidance, refer to the PublicElementConfig documentation.
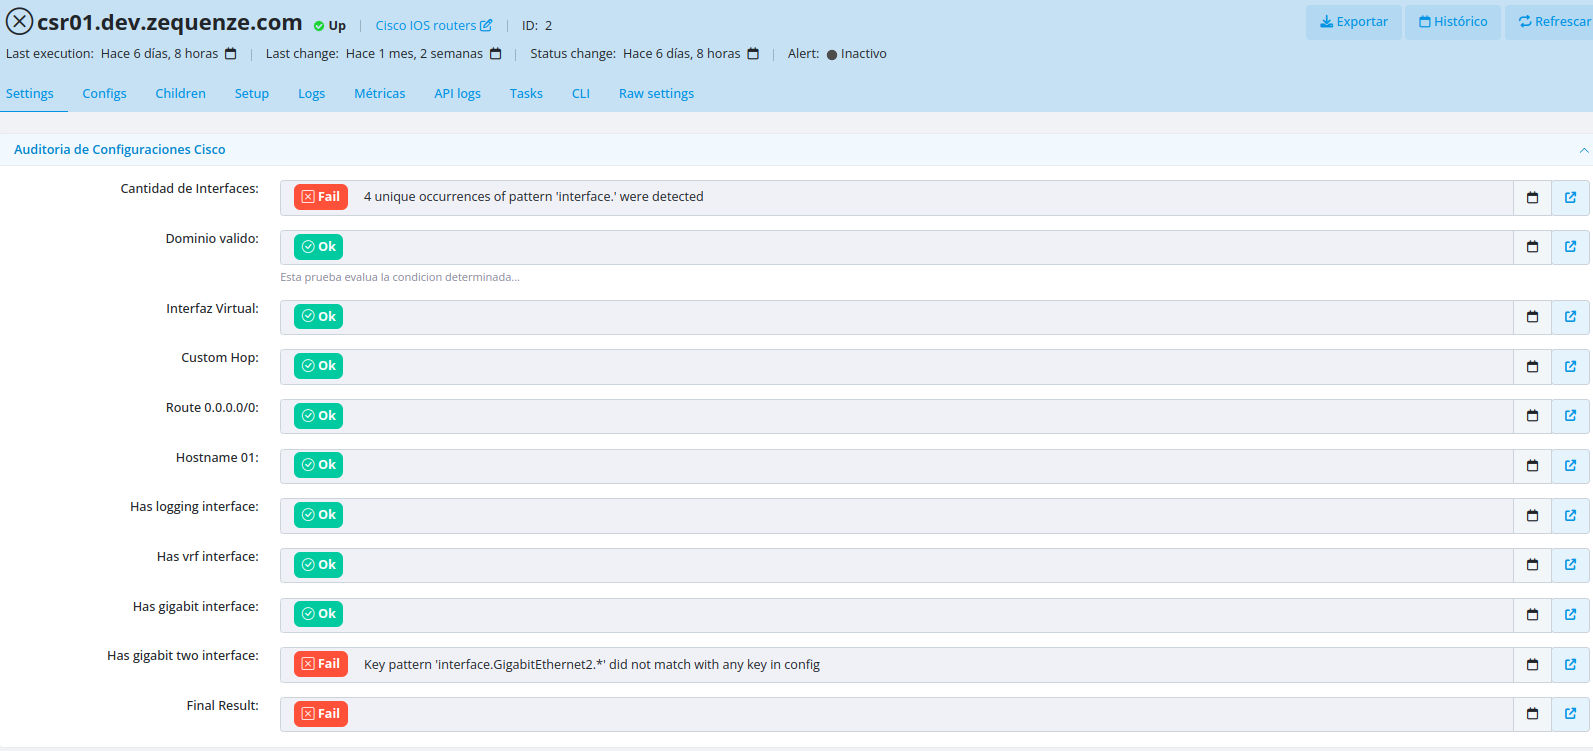
Step 3: Review Audit Results
Once the audit task has executed, you can view the results in the Element settings interface.
Running Audits on Historical Configurations
You can configure tasks to run audits against previously stored device configurations instead of extracting a new configuration each time.
Implementation
To audit a historical configuration:
- In the task's management script, set the
automation_custom_outputvariable - Populate this variable with the stored configuration data using the
last_configmethod from the PublicElementConfig class
This approach simulates the output of the automation model using previously extracted data.
Example: Configuration for auditing historical data.

Related Documentation
- Models - Comprehensive guide to automation and processing models
- PublicElementConfig - API reference for configuration management
Notifications
Introduction
FLUX allows you to configure flows that send notifications containing data from previous tasks. By creating specialized notification tasks, you can automatically deliver email notifications to any recipient with customized content.
Overview
Notification functionality in FLUX enables you to:
- Build multi-task flows with integrated notification capabilities
- Send email notifications with data from any previous task in the flow
- Customize recipients, subjects, and email body content
- Access context variables and task results dynamically
Configuration
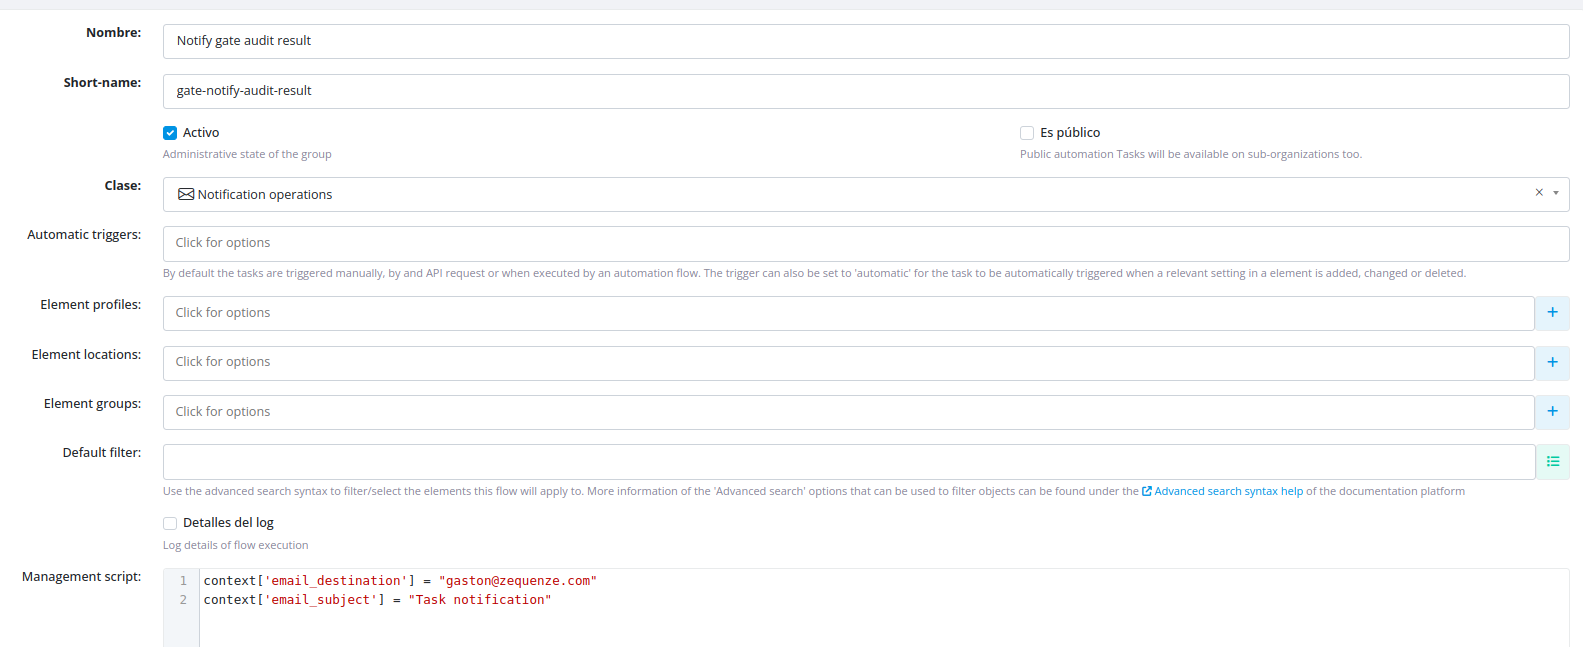
Setting Up a Notification Task
- Create a task with the "Notification operations" class within your flow
- Configure the notification parameters in the management script:
- Recipient: Specify the email address(es) to receive the notification
- Subject: Define the email subject line
Creating the Email Template
Create a dedicated model for your email that defines the body content. Within this model, you can reference:
- Variables from any task in the flow
- Task execution results
- Context variables available at the time of notification execution
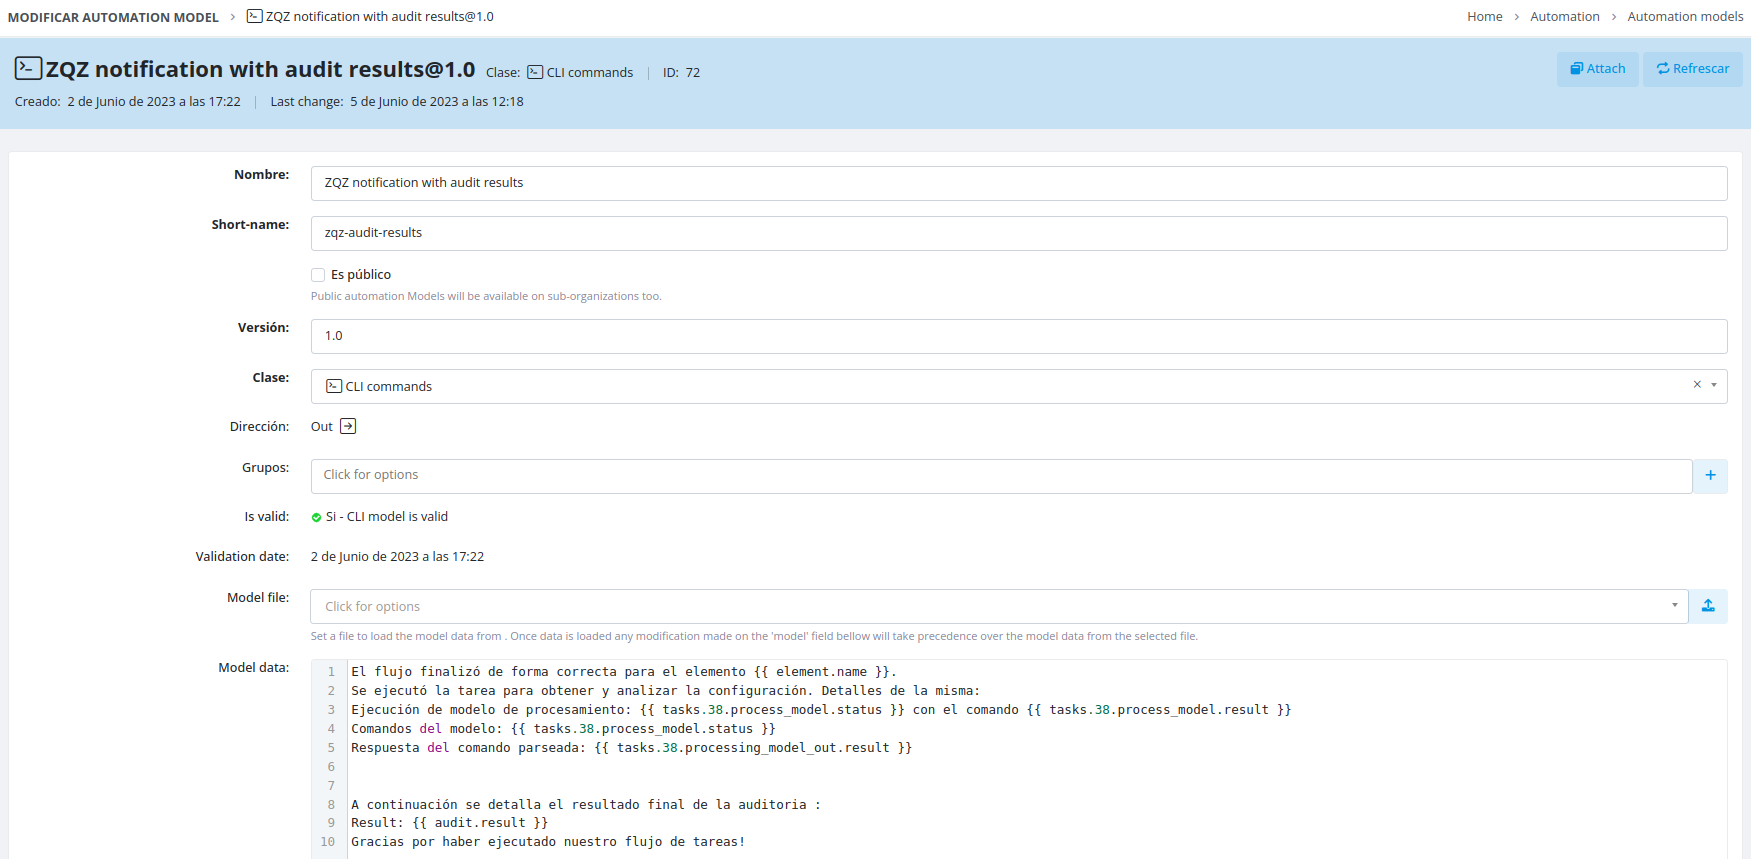
Accessing Task Variables
Variable Syntax
To reference variables from other tasks in your flow, use the following syntax:
tasks.{id}.{method}.{result|status}
Available Methods
You can access data from these task methods:
-
management_script -
process_model -
model_commands -
processing_model_out -
processing_script_out -
element_data_mapped
Context Variables
Context variables are accessible at the moment the notification task executes, allowing you to include real-time flow information in your notifications.
Example
View a live flow example demonstrating notification configuration:
Scripts with visualization feature
Sequential flow designer basics
The Scripts configuration allows you to execute Python code with the option of using a visual representation, as shown in the screenshot below:
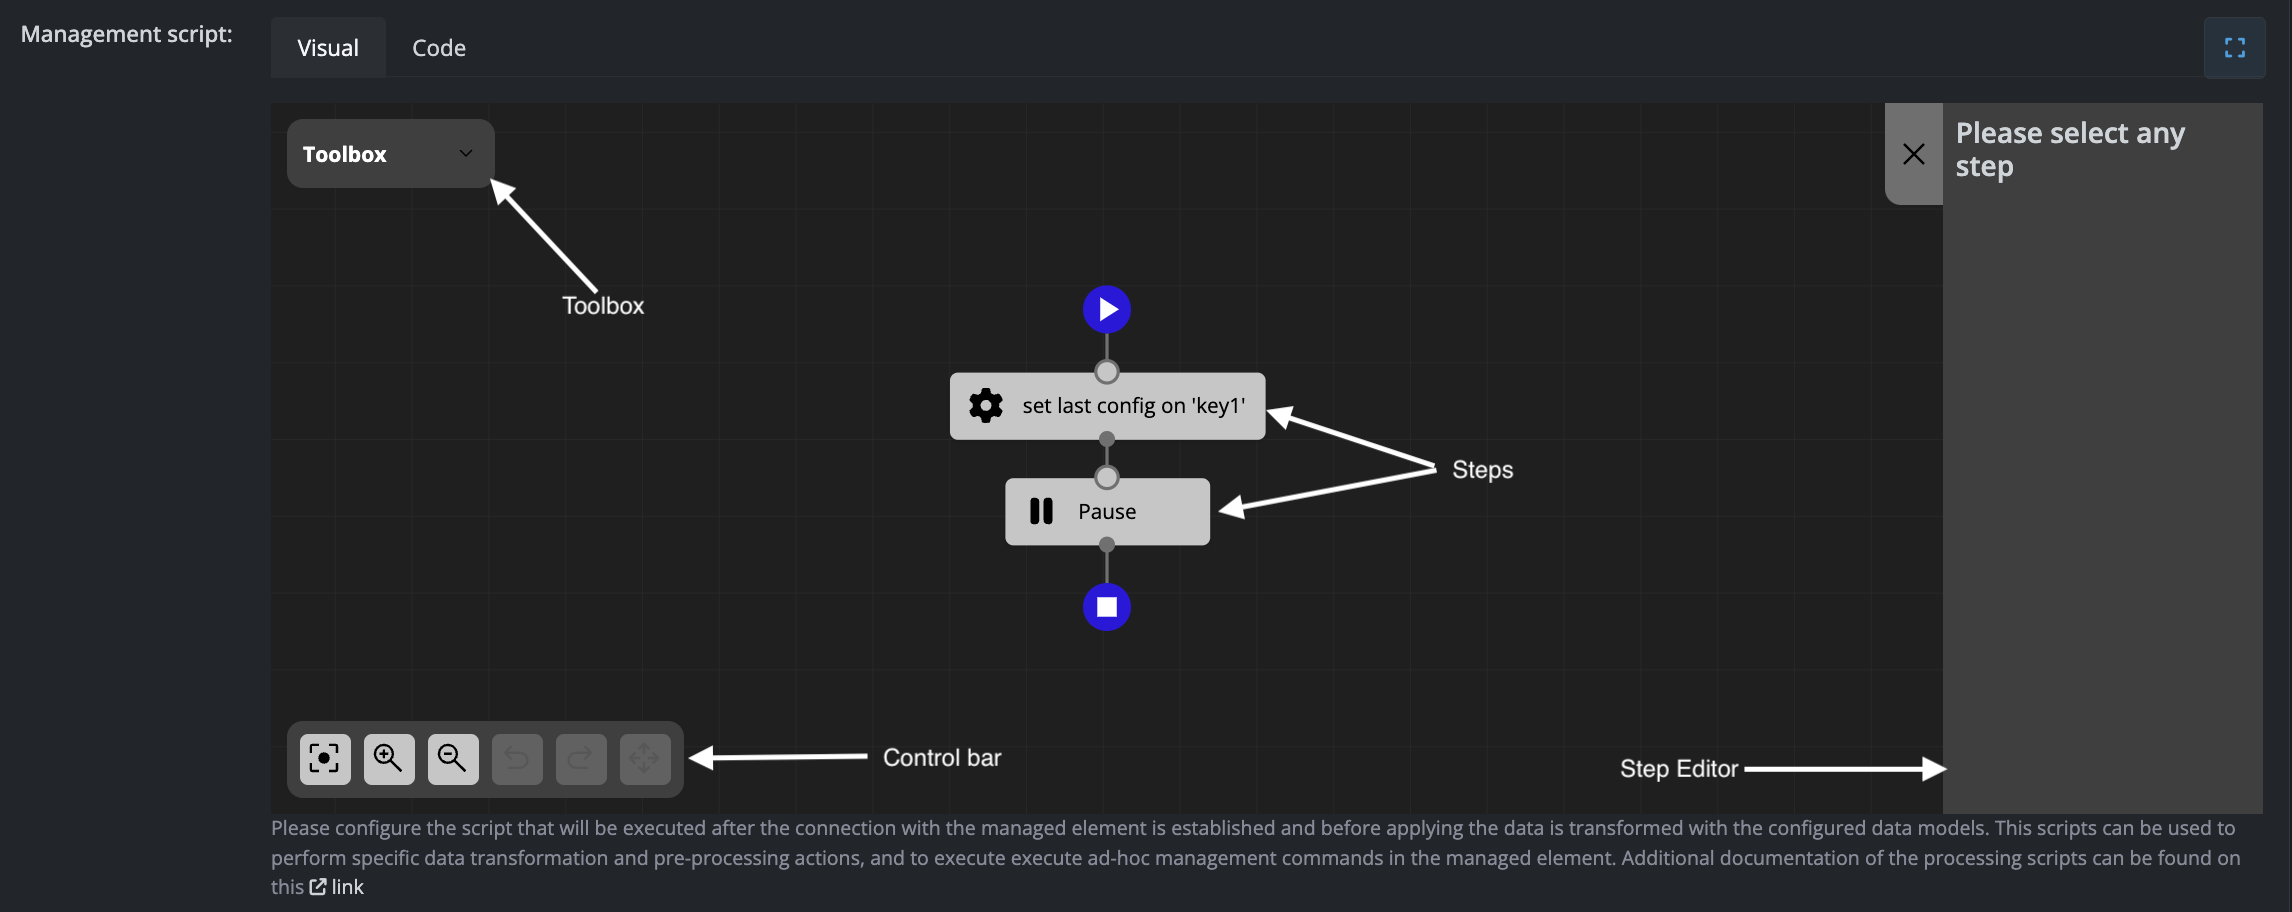
Interface Components
The sequential flow designer consists of four main components:
Toolbox
Contains all available steps that can be added to your flow. Simply drag and drop steps from the toolbox into the steps diagram to build your sequence.
Control Bar
Provides viewport and editing controls:
- Reset viewport
- Zoom in or zoom out
- Undo or redo changes
- Delete the selected step
Steps Diagram
Displays the flow of steps to be executed in sequence. Click on any step to view and modify its settings in the Step Editor panel.
Step Editor
Shows the configuration settings for the currently selected step. This panel updates dynamically based on which step you have selected in the diagram.
Available steps for management scripts in task elements
Set Value in Objects
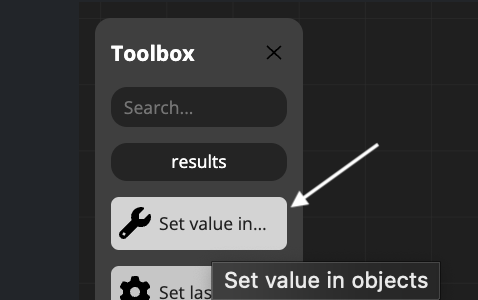
This step allows you to assign different types of values to three available object types within your management scripts.
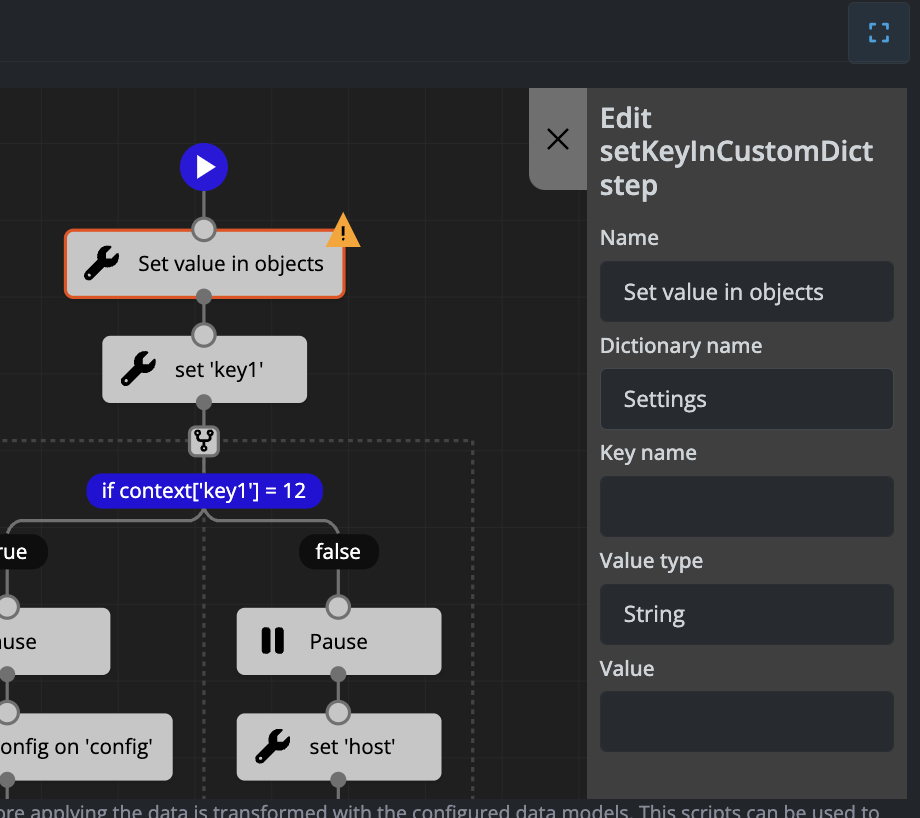
Available Objects
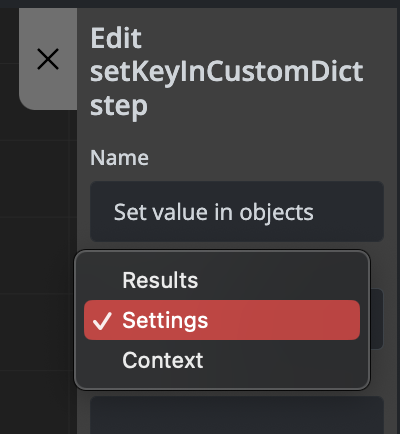
The three available objects where you can set values are:
- data - For storing and manipulating data values
- settings - For configuration and settings parameters
- context - For contextual information and workflow variables
Value Types
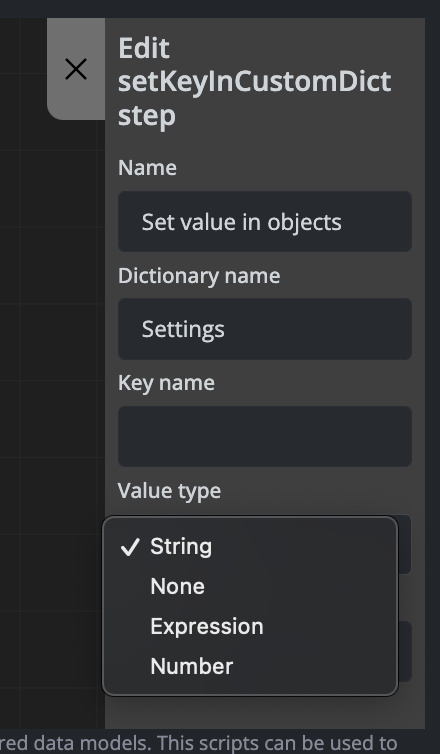
You can set values using different data types and sources depending on your requirements.
Examples
Example 1: Setting a Value in the Settings Object
Setting the uplink_rx_bytes parameter in the settings object using information stored in the data object:
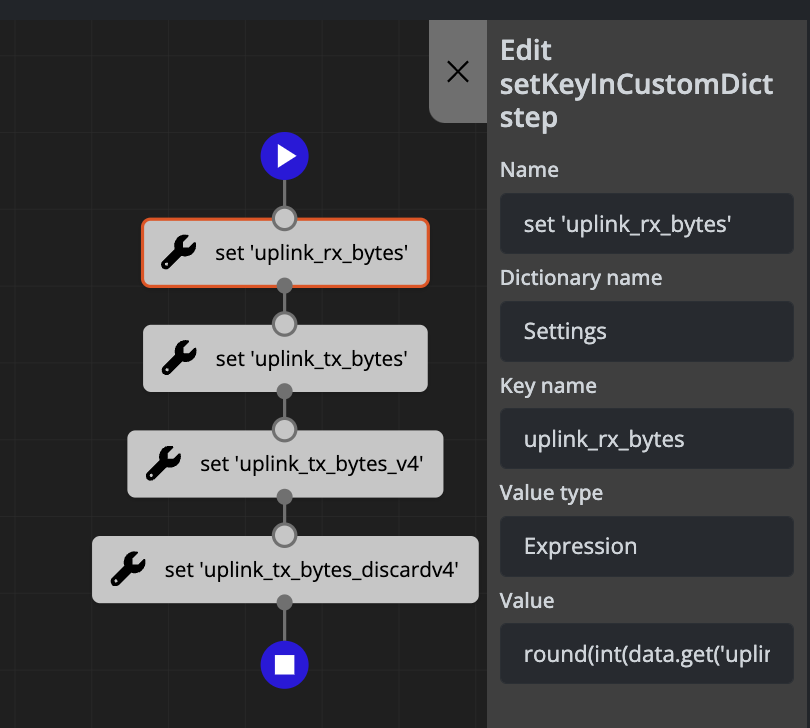
The above configuration generates the following code:
settings['uplink_rx_bytes'] = round(int(data.get('uplink_rx_bytes_val', '0')) * 0.000000001, 3)
Example 2: Adding an Email Destination to the Context Object
Adding an email destination to the context object:
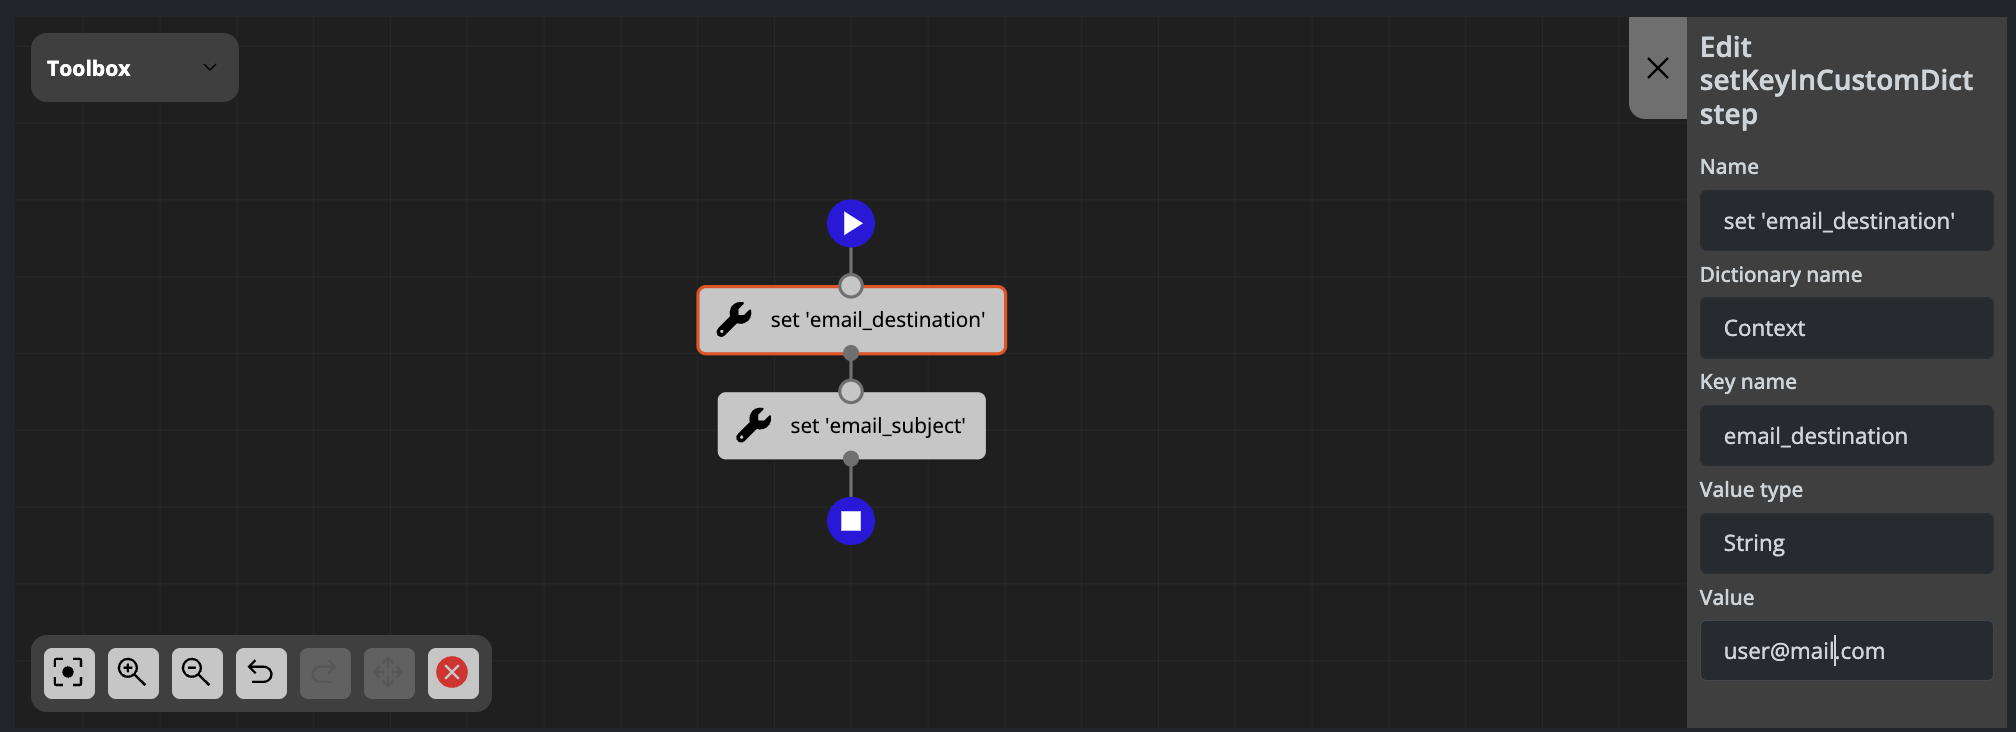
The above configuration generates the following code:
context['email_destination'] = 'user@mail.com'
Set Last Configuration in Object
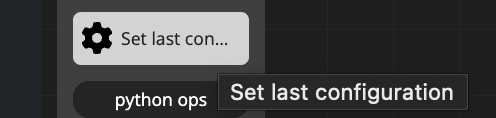
This step allows you to retrieve the last configuration and assign it to one of the available objects. This is useful when you need to access or reference previously saved configuration data within your management scripts.
Examples
Example: Setting Last Configuration in the Context Object
Setting the last configuration in the context object inside the automation_custom_output key:
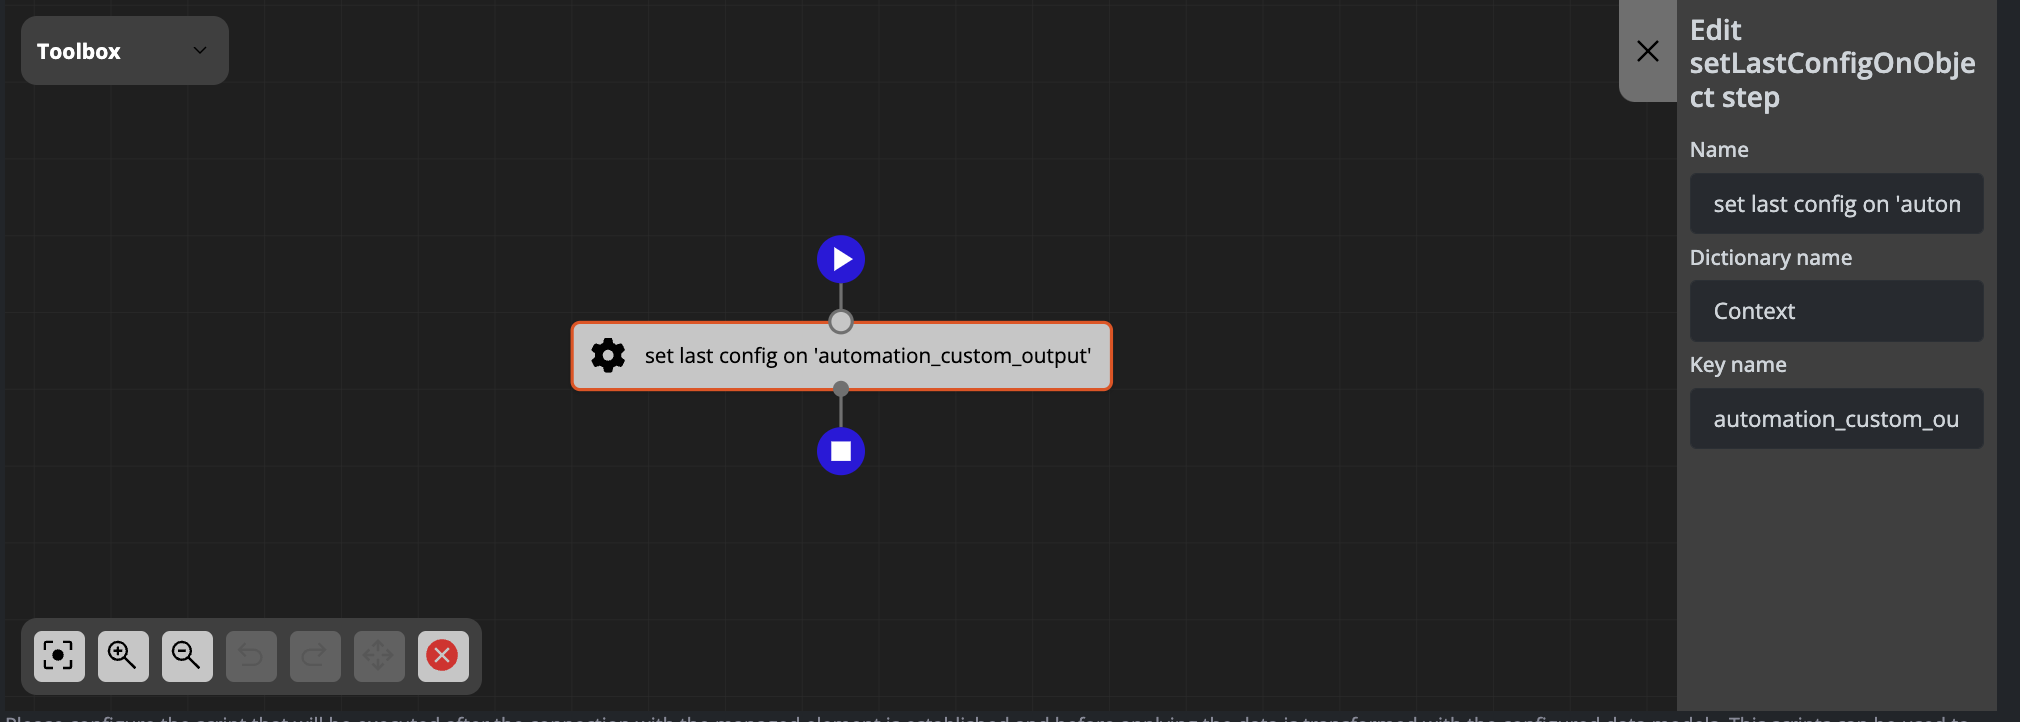
The above configuration generates the following code:
context['automation_custom_output'] = config.get_last_config()
Available steps table
Overview
FLUX provides three types of scripts, each with specific available steps for workflow automation. This page details all available steps and their properties for each script type.
Management Script Steps
The management_script supports the following steps:
Set Value in Objects
Stores different types of values in one of three available objects using a typed key.
Properties:
| Property Name | Type | Label | Options |
|---|---|---|---|
| dictionary name | str | Object Name | Results, Context, Settings |
| key name | str | Name of key | — |
| value type | — | Type of value | str, number, none, expression |
| value | — | — | — |
Set SSH Key Pair in Context
Retrieves an SSH key pair and stores it in one of the defined objects using a custom key.
Properties:
| Property Name | Type | Label | Options |
|---|---|---|---|
| privKeyKey | — | — | — |
| pubKeyKey | — | — | — |
Set Last Configuration
Retrieves the element's last configuration and stores it in one of the available objects using a custom key.
Properties:
| Property Name | Type | Label | Options |
|---|---|---|---|
| dictionary name | str | — | Results, Context, Settings |
| key name | str | — | — |
Processing Script Steps
The processing_script supports the following steps:
Set Value in Objects
Stores different types of values in one of three available objects using a typed key.
Properties:
| Property Name | Type | Label | Options |
|---|---|---|---|
| dictionary name | str | Object Name | Results, Context, Settings |
| key name | str | Name of key | — |
| value type | — | Type of value | str, number, none, expression |
| value | — | — | — |
Set Last Configuration
Retrieves the element's last configuration and stores it in one of the available objects using a custom key.
Properties:
| Property Name | Type | Label | Options |
|---|---|---|---|
| dictionary name | — | — | — |
| key name | — | — | — |
Set Variable on Element Config
Sets an attribute in the element configuration object.
Properties:
| Property Name | Type | Label | Options |
|---|---|---|---|
| key name | — | — | — |
| value type | — | — | — |
| value | — | — | — |
If Condition Simple for Numbers
Checks a simple condition with a numeric variable. Examples: if a=b, if a >= b, if a < 12
Properties:
| Property Name | Type | Label | Options |
|---|---|---|---|
| variable to evaluate | — | — | — |
| operator | — | — | — |
| value | — | — | — |
If Condition Simple for Strings
Checks a simple condition with a string variable. Examples: if a.startswith('device_'), if a in b, if s.endswith(':')
Properties:
| Property Name | Type | Label | Options |
|---|---|---|---|
| variable to evaluate | — | — | — |
| operator | — | — | — |
| value | — | — | — |
If Condition Advanced
Evaluates Python conditions. Examples: if context['host'] == "0.0.0.0.0", if not data.get('apt_upgradable.table')
Properties:
| Property Name | Type | Label | Options |
|---|---|---|---|
| condition | — | — | — |
Pause
Executes a time.sleep(time) operation.
Properties:
| Property Name | Type | Label | Options |
|---|---|---|---|
| time | — | — | — |
Pause with Log
Executes a sleep operation with logging.
Properties:
| Property Name | Type | Label | Options |
|---|---|---|---|
| time | — | — | — |
Update Element Credentials
Reads SSH credentials from context and updates them in the element.
Properties:
| Property Name | Type | Label | Options |
|---|---|---|---|
| privKeyKey | — | — | — |
| pubKeyKey | — | — | — |
Wait for Connect
Waits for a specified time until the connection against the element executes correctly.
Properties:
| Property Name | Type | Label | Options |
|---|---|---|---|
| timeout | — | — | — |
| retry | — | — | — |
| sleep | — | — | — |
Set Variable Value
Note: To be documented.
Properties:
| Property Name | Type | Label | Options |
|---|---|---|---|
| variable_name | — | — | — |
| value_type | — | — | — |
| value | — | — | — |
Execution Script Steps
The Flow execution_script includes all steps from the Processing Script, plus the following additional steps:
Filter Flow Elements
Applies a function to filter the given elements, with support for in-place modification or returning a new list.
Properties:
| Property Name | Type | Label | Options |
|---|---|---|---|
| elements | list | List of elements | elements, ... |
| filter_function | function | Function to filter elements | — |
| inplace | bool | Replace or return | True, False |
Task Execution
Runs a specific task on given elements. If the flow containing the task is serial, the elements parameter is not required.
Properties:
| Property Name | Type | Label | Options |
|---|---|---|---|
| short_name | str | Task short name | — |
| elements | list | List of elements to run the task | elements, ... |
| retry_attempts | int | Retry attempts | — |
| retry_delay | int | Retry delay | — |
Flow Execution
Runs a specific flow on given elements.
Properties:
| Property Name | Type | Label | Options |
|---|---|---|---|
| short_name | str | Flow short name | — |
| elements | list | List of elements to run the flow | elements, ... |
| retry_attempts | int | Retry attempts | — |
| retry_delay | int | Retry delay | — |
Task
Task Class
The task class determines the action that will be executed when the task runs. FLUX supports the following task classes:
- CLI Operations: Establishes a connection with a device and sends model commands via console
- REST/HTTP: Sends model data (typically JSON format) via HTTP
- SOAP/HTTP: Sends model data via HTTP
- Notifications: Sends a custom notification with the model as the message body
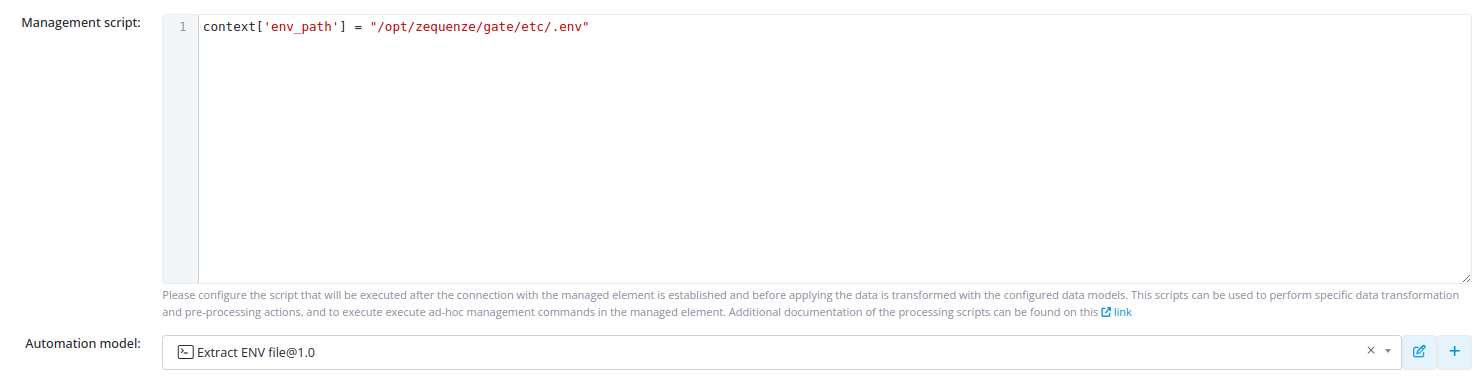
Management Script
The Management Script adds extra data to the execution context that can be referenced within models.
For detailed code documentation, see Visual Workflow Designer Scripts.
Special Variables by Task Class
Notifications Task
Use these context variables to configure notification parameters:
context['email_destination'] = 'devops@zequenze.com'
context['email_subject'] = 'Flow notification'
Simulating Automation Model Output
You can set the model output by retrieving the last configuration:
context['automation_custom_output'] = config.get_last_config()
Automation Model
The Automation Model is used to build the messages or commands that will be sent to the target element.
Processing Model
The Processing Model is used to process and parse the element's response to the executed message or command.
Processing Script
The Processing Script adds extra data to the results of command or message execution.
For detailed code documentation, see Visual Workflow Designer Scripts.
Special Variables by Task Class
REST/HTTP Task
In REST/HTTP tasks, you can access the response data using the data variable:
if data.get('status_code') == 200:
settings['nms_downtime.status'] = 'false'
All Task Classes
All task classes can save specific configuration data for the target element. See PublicElementConfig for object reference documentation.
Example configuration and audit checks:
config.version = '1.7'
config.section = 'core'
config.required_approvement_percentage = 85
settings['audit.interfaces'] = config.check_key_occurrences("interface.*", ">=", 90, required_for_audit=True)
settings['audit.valid_domain'] = config.compare_string_value('domain', 'startswith', 'zequenze', required_for_audit=True)
settings['audit.virtual_interface'] = config.complex_compare('interface.x', 'comienza con Virtual', required_for_audit=True)
settings['audit.custom_hop'] = config.complex_compare('route.x', 'contiene un nexthop a la ip 172.16.254.1', required_for_audit=True)
settings['audit.route'] = config.check_key_matches('route.0.0.0.0/0', required_for_audit=True)
settings['audit.valid_hostname'] = config.compare_string_value('hostname', 'contains', '01', required_for_audit=True)
settings['audit.has_logging_interface'] = config.check_key_matches("interface.*.logging", required_for_audit=True)
settings['audit.has_vrf_interface'] = config.check_key_matches("interface.*.vrf", required_for_audit=True)
settings['audit.has_gigabit_interface'] = config.check_key_matches("interface.GigabitEthernet1.*", required_for_audit=True)
settings['audit.has_gigabit_two_interface'] = config.check_key_matches("interface.GigabitEthernet2.*", required_for_audit=True)
settings['audit.result'] = config.audit_value
Flow
Overview
Flows enable you to coordinate the execution of multiple steps across several elements. A step can be:
- A task execution
- A common tool (such as sleep)
- Another flow execution (referred to as a child flow)
Schedule
You can configure a specific schedule for your flow. When scheduled, the flow executes automatically on the specified days at the specified time.
Execution Mode
Serial
In Serial mode, the flow executes all steps for a single element before moving to the next element. This ensures that each element completes its entire workflow sequentially.
Parallel
In Parallel mode, the flow executes one step across all elements before proceeding to the next step. This allows for simultaneous execution across multiple elements.
Processing Script
The Processing Script allows you to sort and filter the elements that will be used in the flow execution as you wish.
Example
sort_function = lambda x: 1 if x['context']['patroni_leader'] == 'master' else 0
order_flow_elements(elements, sort_function, reverse=False)
This code sorts elements from DESC to ASC based on whether they are "master" or not.
Available Variables and Functions
- elements: Contains all elements that match the profile, groups, and filters
- order_flow_elements: Sorts elements based on specified criteria (you can use element context)
- filter_flow_elements: Filters elements based on specified criteria (you can use element context)
Execution Script
The Execution Script defines which steps will be executed when the flow runs. See Visual Script Editing to learn how to use the visual view.
Special Variables
- elements: The list of elements after the processing script has been applied
- current: The number of the element currently being executed
- first: The number of the element that will be executed first
- last: The number of the element that will be executed last
Custom Steps
- Filter elements (filter_flow_elements): Filters elements and returns a list containing only the elements that match the filter criteria
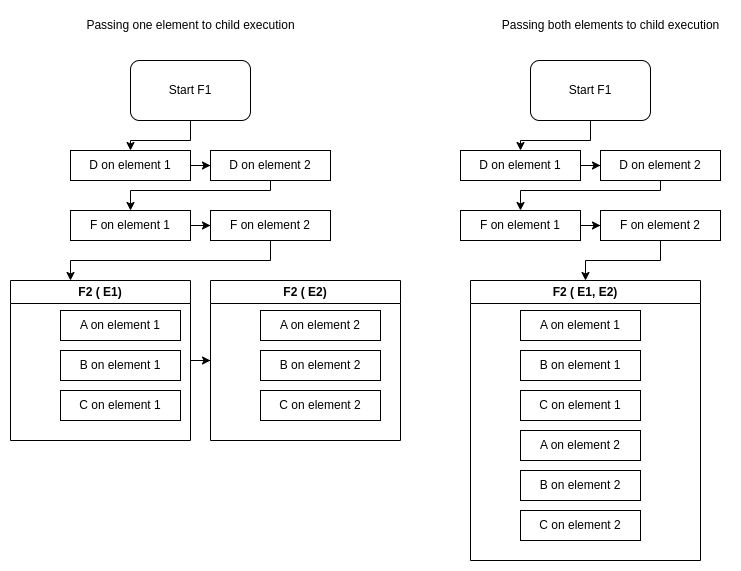
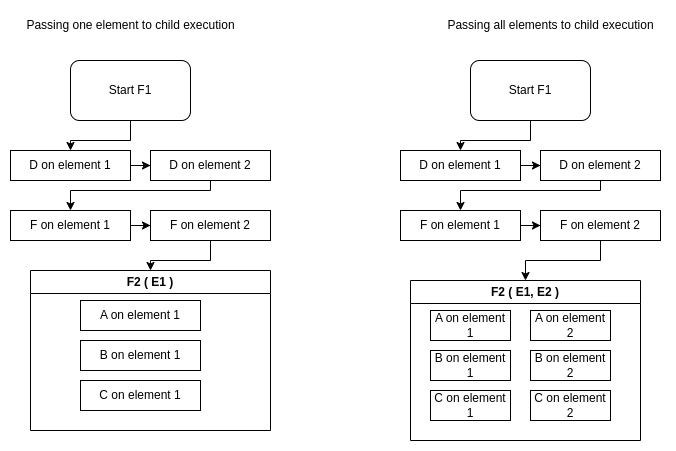
Execution Examples
You can combine multiple flows of different execution modes (Serial and Parallel) to achieve more complex logic. When defining a flow execution script, you can pass specific elements to each child flow execution.
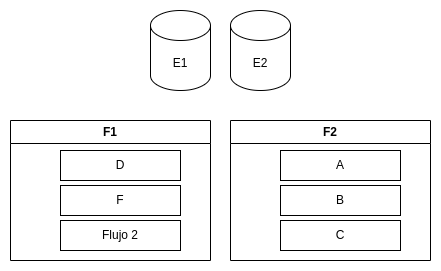
Example Scenario
Given 2 elements (E1, E2), 2 flows (F1 & F2), and 5 tasks (A, B, C, D, F):
Parent Serial - Child Serial
What happens when F1 is Serial and F2 is Serial?
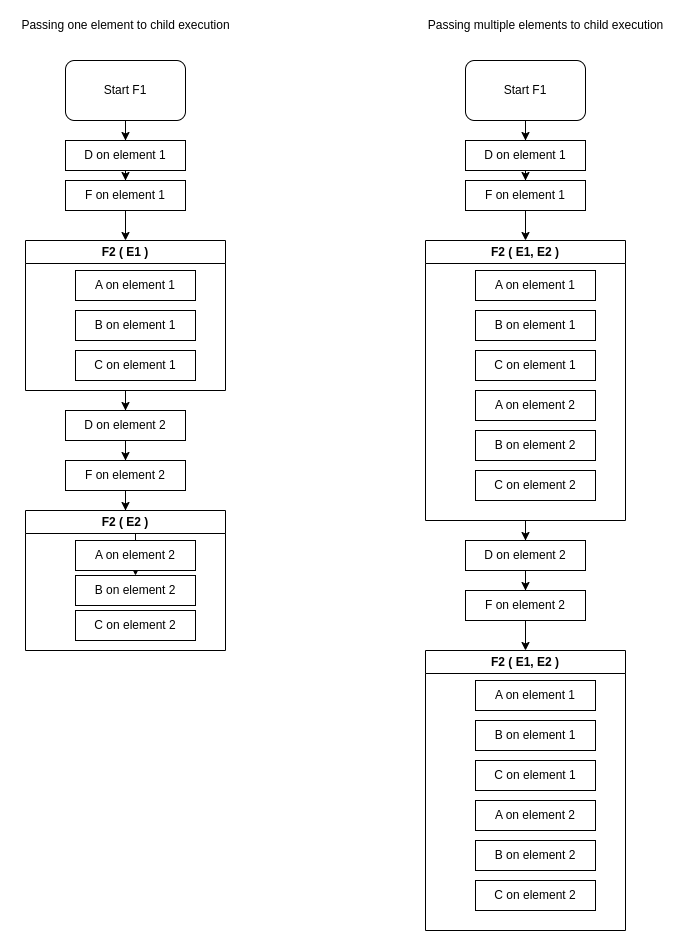
Parent Serial - Child Parallel
What happens when F1 is Serial and F2 is Parallel?
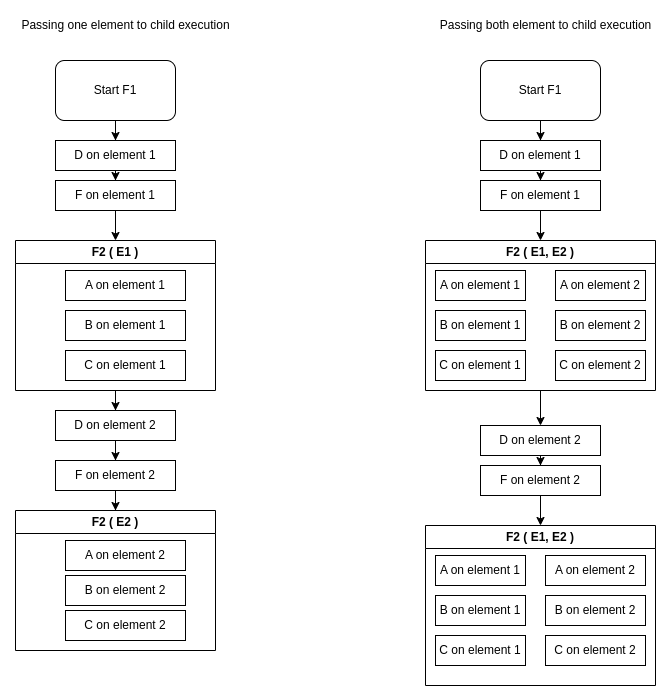
Parent Parallel - Child Serial
What happens when F1 is Parallel and F2 is Serial?
Parent Parallel - Child Parallel
What happens when F1 is Parallel and F2 is Parallel?
Dashboard: Main

Overview
The Zequenze CONTROL Portal Dashboard provides a comprehensive monitoring and management interface for automation systems. This main dashboard view displays real-time automation logs, performance metrics, and system statistics over a 24-hour period, enabling administrators to monitor system health and automation execution status.
Key Features
Real-Time Automation Monitoring
- Automation Logs Per Status Chart: Visual representation of automation execution logs displayed as stacked bar charts
- 24-Hour Time Period: Data visualization covering the last 24 hours with two-hour interval breakdowns
- Status Color Coding: Teal/turquoise bars for "Ok" status, coral/red bars for "Error" status, with legend showing Red for Error, Yellow for Warning, Blue for Running, and Teal for Ok states
- Numerical Data Labels: Each bar displays specific count values for both Ok and Error statuses
- Status Distribution: Chart shows predominantly "Ok" status executions with occasional error instances during the monitoring period
System Metrics Dashboard
Four key metric cards displaying:
- Automation Tasks: 70 total tasks
- Automation Flows: 28 active flows
- Automation Models: 85 configured models
- Elements: 49 system elements
UI Elements
Navigation Sidebar
- FLUX admin portal (dev): Main system identifier
- Dashboard: Currently active section
-
Applications Section:
- Automation
- Inventory
- Locations
- Credentials
- User log
Top Navigation Bar
Chart Controls
- Auto-refresh Toggle: Set to "Auto: off" with dropdown options
- Time Period Selector: "24 hours" with dropdown for different time ranges
- Data Export Options: "Bar (stack)" view selector and CSV export functionality
- Refresh Button: Manual refresh control for updating chart data
User Interactions
Dashboard Monitoring
- Real-time Data Viewing: Monitor automation execution patterns throughout the day
- Status Analysis: Identify peak automation periods and potential issues
- Time-based Filtering: Adjust time periods to view different data ranges
Navigation Options
Navigation
Access Path
-
URL:
https://flux-dev.zequenze.com/admin/ - Direct Access: Main landing page after login to the admin portal
- Breadcrumb: Home > Dashboard
Related Sections
- Automation management
- Inventory management
- Locations configuration
- Credentials management
- User log functionality
- System configuration settings
Data Displayed
Automation Logs Chart
- Time Range: February 12, 6:00 PM through February 13, 4:00 PM (continuous 24-hour period with two-hour intervals)
- Data Points: Two-hourly snapshots of automation execution throughout the full day
- Status Values: Numerical counts showing both Ok statuses (ranging from 66 to 102 executions) and Error statuses (showing 12 errors at one interval)
- Activity Pattern: Generally stable automation activity with most intervals showing 66-102 successful executions, with one interval showing 12 errors and 87 successful executions
- Status Indicators: Bars primarily show teal "Ok" status with one coral/red "Error" indicator appearing as a stacked bar segment at February 13, 12:00 PM
- Status Legend: Shows Ok (teal), Warning (yellow), Error (red), and Running (blue) status indicators
System Statistics
- Current Counts: Real-time metrics for all major system components
- Resource Overview: Quick assessment of system configuration and capacity
Actions Available
Dashboard Management
- Export Data: Download chart data in CSV format for external analysis
- Refresh Controls: Toggle auto-refresh or manually update data using the refresh button
- View Selection: Change between different chart visualization modes
System Navigation
- Deep Dive Analysis: Click on metric cards to access detailed management interfaces
- Application Management: Navigate to Automation, Inventory, Locations, Credentials, or User log sections through the sidebar
- Configuration Access: Navigate to settings and configuration sections
Notes/Tips
Best Practices
- Regular Monitoring: Check the automation logs chart regularly to identify patterns or anomalies
- Peak Hour Analysis: Use the two-hourly breakdown to optimize automation scheduling
- Status Monitoring: Watch for color changes in the chart bars that might indicate warnings or errors
- Error Detection: Pay attention to stacked bar segments showing error counts that indicate system issues requiring attention
Performance Insights
- Activity Patterns: The chart shows generally stable automation execution with values between 66-102 successful executions per two-hour interval
- System Health: Predominantly successful executions with one error occurrence (12 errors at 12:00 PM) indicating generally good system performance with isolated issues
- Resource Planning: Use the metrics to plan for system capacity and resource allocation
- Trend Analysis: Monitor changes in automation volume over time to identify growth patterns and potential issues
System Health Indicators
- Status Consistency: Chart shows predominantly successful executions (teal) with one visible error cluster, indicating mostly stable system health with an isolated issue
- Volume Patterns: Consistent activity levels throughout the 24-hour period with values remaining relatively stable between intervals
- Error Visibility: Stacked bar visualization clearly highlights when errors occur, enabling quick identification of problem periods
- 24/7 Monitoring: Continuous data collection enables proactive system management and real-time issue identification
Elements

Overview
The Inventory Elements page in the Zequenze CONTROL Portal provides a comprehensive view of all network elements and devices managed within the system. This centralized dashboard allows administrators to monitor device status, manage configurations, and perform various operations on network infrastructure components.
Key Features
- Real-time Status Monitoring: View current operational status of all network elements
- Interactive Map View: Visual representation of device locations with status indicators
- Advanced Filtering: Multiple filter options to quickly locate specific elements
- Bulk Operations: Import, export, and manage multiple elements simultaneously
- Status Tracking: Monitor changes in device states over time
- Profile Management: View and manage device profiles and configurations
UI Elements
Navigation Bar
- Home → Inventory → Elements breadcrumb navigation
- Language selector (English flag icon)
- User profile indicator showing logged-in user (ipenaa@zequenze.com)
- Organization context (org: Zequenze)
Tab Navigation
- General: Current active tab showing element listing
- Status map: Tab for geographical distribution view
Search and Filter Controls
- Search Bar: Text-based search functionality for finding specific elements
- View Mode Toggle: Toggle with "1" indicator for viewing options
- Location Filter: Map pin icon button for location-based filtering
- Import Button: Upload element configurations from external files
- Export Button: Download element data and configurations
- Reports Button: Generate reports on element status and performance
- Add Button (+): Create new network elements
- X Button: Clear current filters or selections
- Filter Panel: Advanced filtering options on the right side with "Proceed" button
Map View
- Interactive map with green location markers showing device locations
- Style selector (currently set to "emerald-v8")
- Reset button to restore default map view
- Zoom controls (+ and - buttons)
- Fullscreen toggle option
- Map powered by Leaflet | © Mapbox | © OpenStreetMap
Data Displayed
The main table shows detailed information about network elements:
Column Structure
- Name: Element identifier with clickable links and parent information
- Status: Current operational state (Up/Down with colored indicators)
- Profile: Associated device profile and type information with expandable details
Element Types and Status
The table displays various network elements including:
- HUB11: Network hub (Status: Down) with parent: Región, using Cisco IOS routers Router profile
- HUB10: Network hub (Status: Up) with parent: Región, using Mikrotik RouterOS appliances Net. appliance profile
- OLT6, OLT5, OLT4, OLT3, OLT2: Optical Line Terminals (Status: Up) with parent: HUB, using Mikrotik RouterOS appliances Net. appliance profile
- HUB9, HUB8, HUB7, HUB6, HUB5: Additional network hubs (Status: Up) with parent: Región, using Mikrotik RouterOS appliances Net. appliance profile
Parent-Child Relationships
Elements display hierarchical relationships:
- parent: label with linked parent element name and navigation icon (⊕)
- Visual indication of element hierarchy within the network infrastructure
Status Indicators
- 🟢 Green dot: Element is operational (Up)
- 🔴 Red dot: Element is down or experiencing issues
- Profile badges: Show device categories with detailed profile information and expandable dropdown arrows (Router, Net. appliance, etc.)
User Interactions
Search and Discovery
- Use the search bar to find elements by name or identifier
- Toggle view modes using the view mode button (showing "1" indicator)
- Apply location-based filters using the map pin icon
- Apply filters using the right-side filter panel
- Toggle between General and Status map views
- Clear filters using the X button
- Navigate parent-child relationships by clicking on parent links
Element Management
- Click on element names to access detailed configuration
- Use bulk operations for managing multiple elements
- Import/export configurations for backup or migration
- Reset map view to default settings
- Expand profile information using dropdown arrows for detailed device specifications
Status Monitoring
- Monitor real-time status changes
- View historical status information
- Set up alerts for status changes
Navigation
Access Path
Home → Inventory → Elements
Related Sections
- Settings: Configure element parameters
- Configuration blocks: Manage configuration templates
- Profiles: Define device profiles
- Metrics: View performance data
- Groups: Organize elements into logical groups
- Scripts: Automation and scripting tools
- Locations: Manage device locations
- Credentials: Access and authentication management
- User log: Activity tracking and audit trail
Actions Available
Individual Element Actions
- View Details: Click element name for detailed information
- Edit Configuration: Modify element settings
- Status Management: Monitor and troubleshoot connectivity
- Expand Profile Details: Use dropdown arrows to view complete profile specifications
- Navigate Hierarchy: Click parent links to view parent element details
Bulk Operations
- Import Elements: Upload multiple element configurations
- Export Data: Download element information and configurations
- Generate Reports: Create status and performance reports
- Add New Elements: Create single or multiple network elements
- Clear Filters: Use X button to reset current filter selections
- Proceed: Execute batch operations on filtered results
Map Controls
- Reset: Restore map to default view and settings
- Style Selection: Choose different map styles (emerald-v8 currently selected)
Filtering Options
- Active Filters: 4 Hidden active filters applied
- View Mode: Toggle button with "1" indicator for different viewing options
- Location Filter: Map pin icon for geographical filtering
- Records per page: Currently set to 50 records display limit
- Status Filters: Filter by operational state
- Profile Filters: Filter by device type or profile
- Element Type: Filter by specific element categories
Filter Panel Options
The right-side filter panel provides advanced filtering capabilities:
- FILTER header with close button (X) in the top-right corner
- Proceed Button: Execute filtering operations on selected criteria (highlighted in green, appearing at the top of the panel)
- Active filters: Shows "4 Hidden" indicating multiple active filters
- Active alert: Filter by alert status with "Any or no date/time" dropdown
- Previous status change: Filter by timing of status changes with "Any or no date/time" dropdown
- Records per page: Set to 50 records with dropdown selector
- Records per page (secondary): Set to 5000 records option available
- Element: "Click for options" expandable menu for element selection
- Is child: Filter for child elements with "All" dropdown selection
- Class: "Click for options" expandable menu for class-based filtering
- Profile: "Click for options" expandable menu for profile-based filtering
Notes/Tips
- Performance: The page shows 49 results with configurable record limits for optimal viewing
- Real-time Updates: Status indicators provide live monitoring capabilities
- Enhanced Filtering: Multiple active filters (4 Hidden) enable precise element selection with expandable filter panel for detailed configuration
- Visual Feedback: Color-coded status indicators for quick assessment
- Responsive Design: Map view can be expanded to fullscreen for better visibility, and filter panel can be expanded to show all available options
- Data Export: Use export functionality for reporting and backup purposes
- Advanced Filtering: Proceed button enables batch operations on filtered results and is highlighted in green for clear action identification
- Quick Reset: Use the X button to quickly clear active filters and the Reset button to restore default map view
- Filter Panel Management: The filter panel can be closed using the X button in the top-right corner to provide more screen space for the main content
- Flexible Pagination: Records per page can be adjusted using dropdown selectors for different viewing preferences
- Status Change Tracking: Previous status change filter enables monitoring of recent device state transitions
- Alert Management: Active alert filtering allows monitoring of elements with current alerts
- Detailed Profile Information: Expandable profile dropdown arrows provide access to comprehensive device specifications and classifications
- View Customization: Use the view mode toggle to switch between different data presentation formats
- Location-Based Filtering: The map pin icon provides quick access to geographical filtering options
- Hierarchical Navigation: Parent links with navigation icons enable quick traversal through the element hierarchy
- Multiple Filter Categories: Filter panel includes Class and Profile options for more granular element selection
Automation models

Overview
The Automation Models page in the Zequenze Control Portal provides a comprehensive interface for managing automation models within the FLUX admin portal. This page displays a detailed table of automation models with their configurations, versions, and operational status, allowing administrators to monitor and manage their automation infrastructure.
Key Features
- Model Management: View and manage all automation models in a centralized table
- Version Control: Track different versions of automation models
- Status Monitoring: Real-time status indicators showing model validity and public accessibility
- Organization Management: Models are organized by groups and organizations
- Filtering and Search: Advanced filtering options and search functionality with collapsible filter panel
- Bulk Operations: Import and add multiple models simultaneously
UI Elements
Navigation Bar
Tab Navigation
- Custom: Currently selected tab
- System: System-level automation models
- Groups: Group-based model organization
Action Buttons
- Refresh: Left-most circular arrow button for refreshing the model list
- Import: Blue button for importing automation models
- Add: Green plus button for adding new models
- X: Green close/clear button for clearing selections or filters
- FILTER: Filter toggle button with X close option (filter panel currently collapsed)
Filter Panel
The collapsible filter panel on the right side (currently collapsed) includes:
- Class: Dropdown selector with "Click for options" placeholder
- Direction: Dropdown with "All" selected
- Groups: Selection with "Click for options" placeholder
- Is valid: Dropdown with "All" selected
- Is public: Dropdown with "All" selected
- Organization: Dropdown with "Click for options" placeholder
- Sub-organizations: Additional organizational filtering option
- Proceed: Green "Proceed" button at the bottom of the filter panel
Main Data Table
The table contains the following columns:
- Name: Model names with descriptive identifiers (sortable with up/down arrows)
- Version # 2: Version numbers (mostly 1.0, sortable with up/down arrows)
- Class: Model classification (CLI, JSON) with dropdown indicators
- Direction: Data flow direction (Out, In) with directional arrows
- Group: Associated group indicator
- Is valid: Green checkmarks indicating model validity
- Description: Detailed descriptions of model functionality in Spanish
- Is public: Red/Green indicators showing public accessibility status
- Organization: All models shown belong to "Zequenze"
Displayed Models
The table shows several automation models:
- Send notifications docs zequenze (send-docs-zequenze) - CLI, version 1.0, Out direction
- state and details Parser OUTPUT DOCS (state-details_pars_docs) - JSON, version 1.0, Out direction
- Exec script generate docs (exec-generate_docs) - CLI, version 1.0, Out direction
- Refresh ecr secrets on gke (refresh-ecr-secrets-gke) - CLI, version 1.0, Out direction
- GKE Cluster Maintenance icinga2 downtime remove (gke-icinga2-maintenance-remove) - JSON, version 1.0, Out direction
- GKE Cluster Maintenance icinga2 downtime schedule (gke-icinga2-maintenance-downtime) - JSON, version 1.0, Out direction
- GKE Cluster icinga2 downtime remove (gke-icinga2-downtime-disable) - JSON, version 1.0, Out direction
- GKE Cluster icinga2 downtime schedule (gke-icinga2-downtime) - JSON, version 1.0, Out direction
- COPY Gunicorn.py model (gunicorn-model-copy) - version 1.0, In direction
- Exec migrate script (exec-migrate-script) - CLI, version 1.0, Out direction
- AUTH Settings.py model (settings-model-auth) - version 1.0, In direction
User Interactions
Search and Filter
- Search Bar: Located at the top with magnifying glass icon for quick model searches
- Refresh Button: Circular arrow icon to refresh the model list and reload data
- Collapsible Filter Panel: "FILTER" button toggles the detailed filter panel on the right side, currently showing collapsed state
- Filter Options: Multiple dropdown selectors for Class, Direction, Groups, validation status, public status, and organization filtering (accessible when expanded)
- Filter Application: Green "Proceed" button to apply selected filter criteria
Table Interactions
- Sorting: Column headers for "Name" and "Version" are clickable for sorting (indicated by up/down arrows)
- Row Selection: Checkboxes for selecting individual models
- Pagination: Bottom navigation shows "1 2 85 results" with "Show all" option
Navigation
Access Path
Users can reach this page through:
Related Sections
- Dashboard: Main dashboard access
-
Automation: Currently active section (expanded)
- Flows: Automation workflow management
- Tasks: Task management
- Models: Currently active section
- Logs: System logs
- Reports: Automation reports
- Inventory: Inventory management
- Locations: Location management
- Credentials: Credential management
- User log: User activity logs
Data Displayed
Model Types
The page displays various automation model types:
- Documentation Models: Models for sending notifications and generating documentation
- Parser Models: Output document parsing models
- Script Execution Models: Automated script generation and execution (generate docs, migrate script)
- Cloud Infrastructure Models: GKE cluster management and ECR secret refresh models
- Monitoring Integration Models: Icinga2 downtime scheduling and maintenance models
- Application Configuration Models: Gunicorn and AUTH settings models
Status Indicators
- Green Checkmarks: Valid models ready for use (shown in "Is valid" column)
- Red/Green Circles: Models with different public accessibility status (shown in "Is public" column)
- Version Numbers: Track model evolution and updates
- Direction Indicators: Show data flow direction (Out, In) with corresponding arrow icons
Actions Available
Primary Actions
- Refresh Models: Click the circular arrow button to reload the model list and update data
- Import Models: Bulk import automation models from external sources
- Add New Model: Create new automation models
- Clear/Close: Green X button for clearing selections or closing panels
- Toggle Filters: Use the "FILTER" button to show/hide the detailed filtering panel
Filtering Actions
- Advanced Filtering: Expand the filter panel to filter by Class, Direction, Groups, validation status, public accessibility, and organization
- Multi-criteria Filtering: Apply multiple filters simultaneously using the dropdown selectors in the filter panel
- Apply Filters: Use the green "Proceed" button to execute the selected filter criteria
Model-Specific Actions
- View Details: Click on model names to view detailed configurations
- Version Management: Track and manage different model versions using sortable Version column
- Status Updates: Monitor and update model validity status
- Sort Models: Click on "Name" or "Version" column headers to sort models
Notes/Tips
Best Practices
- Regular Monitoring: Check the "Is valid" column regularly to ensure models are functioning correctly
- Version Control: Keep track of version numbers when updating models, using the sortable Version column for easy comparison
- Organization: Use the collapsible filter panel to efficiently manage large numbers of models without cluttering the interface
- Filter Management: Expand the filter panel, utilize the detailed filter options, and click "Proceed" to apply multiple criteria for narrowing down results
- Data Refresh: Use the refresh button to ensure you're viewing the most current model data
Important Information
- Pagination: With 85 total results, use pagination or the advanced filtering options to manage large datasets effectively
- Model Validation: Indicators in the "Is public" column show different accessibility statuses requiring attention
- Search Optimization: Use the search functionality to quickly locate specific models by name or description
- Filter Workflow: Expand the filter panel, select desired filter criteria from the dropdowns, and click the "Proceed" button to apply filters effectively
- Language Support: Model descriptions are displayed in Spanish, indicating multi-language support
- Direction Types: Models can have different directions (In/Out) indicating their data flow pattern
Footer Information
- Copyright: 2026 © zequenze
- Legal Links: Terms of service, Privacy policy, and Changelog available
- Version: FLUX admin portal (dev) v1.0.0-dev
Automation tasks

Overview
The Automation Tasks page in the Zequenze CONTROL Portal provides a comprehensive interface for managing and monitoring automated tasks across your network infrastructure. This page displays a detailed list of all automation tasks including documentation management, GKE cluster maintenance, Kubernetes deployments, and Docker image builds.
Key Features
- Task Management Dashboard: Centralized view of all automation tasks with real-time status monitoring
- Multi-Device Support: Handles various device types and infrastructure components
- Profile-Based Configuration: Tasks are organized by element profiles for efficient management
- Bulk Operations: Import and add multiple tasks simultaneously
- Advanced Filtering: Filter tasks by status, organization, class, and element profiles
- Real-time Status Tracking: Visual indicators show task execution status and health
UI Elements
Header Section
- Search Bar: Located at the top for quick task filtering and discovery
-
Action Buttons:
- Refresh Icon: Circular refresh button on the far left for reloading the task list
- Visibility Icon: Eye icon with notification badge showing "0" for toggling task visibility options
- Import: Blue button with user icon for importing task configurations
- Add: Green "+" button for creating new automation tasks
- Filter Toggle: Green dropdown button with "X" icon to show/hide filter panel
Main Task Table
The table displays the following columns:
- Checkbox Column: Select individual tasks for bulk operations
- Element Groups: Shows task categorization and grouping
- Groups: Primary task organization
- Element groups: Secondary grouping level
- Is active: Indicates if the task is currently active (green checkmarks visible)
- Class: Task classification (CLI, Notifications, REST/HTTP, File TX)
- Auto-triggers: Automated trigger rules applied
- Element profiles: Associated profiles (Build Linux server/VM, Apps GKE server, etc.)
- Is public: Visibility status of the task (red icons visible for private tasks)
- Organization: Organization assignment (Zequenze)
- Proceed: Task execution status (Active)
Filter Panel (Right Side)
The filter panel shows the following filtering options:
- Proceed: Filter section at the top with "Active" status display
- Class: "All" dropdown for filtering by task classification
- Element profiles: "Click for options" dropdown for profile-specific filtering
- Group: "Click for options" dropdown for task group filtering
- Organization: "Click for options" dropdown for organization-based filtering with "Sub-organizations" checkbox option below
User Interactions
Task Management
- Select Tasks: Use checkboxes to select individual tasks for bulk operations
- View Tasks: Browse through paginated list of automation tasks
- Search Tasks: Use the search bar to find specific tasks by name or description
- Refresh Tasks: Click the refresh icon to reload the current task list
- Toggle Visibility: Use the eye icon to adjust task visibility settings
- Filter Tasks: Apply multiple filters to narrow down task visibility
- Import Tasks: Bulk import automation tasks from external sources
- Add New Tasks: Create individual automation tasks using the Add button
Task Configuration
- Profile Selection: Tasks can be assigned to specific element profiles (Build Linux server/VM, Apps GKE server, etc.)
- Organization Assignment: Tasks can be assigned to specific organizations
- Access Control: Configure public/private visibility for tasks
Navigation
Current Location
Related Sections
- Flows: Automation workflow management
- Tasks: Current section for task management
- Models: Device and configuration models
- Logs: Task execution history
- Reports: Automation reporting and analytics
Data Displayed
Task Categories Visible
-
Documentation Tasks:
- Task Send notifications docs (send_notif_task_docs) - build.ops group
- Docs IA (docs-ia-generate)
-
GKE Cluster Maintenance:
- Refresh ecr secrets on gke (refresh-ecr-secrets-gke)
- GKE Cluster Maintenance icinga2 downtime disable (icinga2-maintenance-downtime-dis) - nms.ops group
- GKE Cluster Maintenance Window icinga2 downtime schedule (gke-icinga2-downtime-maintenance) - nms.ops group
- GKE Cluster icinga2 downtime disable (icinga2-downtime-disable) - nms.ops group
- GKE Cluster icinga2 downtime schedule (gke-icinga2-downtime) - nms.ops group
-
Template Management:
- TEMPLATE gunicorn.py.j2 (gunicorn-py-j2) - auth.dev group
-
Deployment & Migration:
- Execute migration script (exe-migrate-app)
- AUTH Settings.py.j2 (settings-transfer-auth) - auth.dev group
- Execution of post-deployment tasks (exec-post_deploy)
-
Kubernetes Operations:
- Deploy Kubernetes app statefulset templates (statefulset-app_deploy)
- Run the application build and upload the Docker image (run-build_and_push)
-
Additional Tasks:
- Clone/checkout application repository (git-clone-checkout) - auth.dev and build.ops groups
- list of docker images (docker-images-list)
- Task Send notifications certificates (send_notif_task_Cert) - build.ops group
- Costos GCP (app_gcp_costs)
Status Indicators
- Green Checkmarks: Indicate active/healthy tasks in the "Is active" column
-
Class Icons: Show different task types:
- Notifications icon (envelope) for notification tasks
- CLI icon (terminal) for command-line interface tasks
- REST/HTTP icon for API-based tasks
- File TX icon for file transfer tasks
- Profile Dropdowns: Display assigned element profiles with dropdown arrows including "Build Linux server/VM", "Apps GKE server", "GCP costs", and "CLI" configurations
- Organization Labels: Show task ownership (all tasks assigned to Zequenze)
- Red Icons: Indicate private tasks in the "Is public" column
- Proceed Status: All visible tasks show "Active" status
Actions Available
Primary Actions
- Select Tasks: Use checkboxes in the leftmost column to select individual tasks for bulk operations
- Refresh: Reload the task list to see latest updates
- Toggle Visibility: Control which tasks are displayed using the eye icon (with notification count badge)
- Import Tasks: Bulk import automation configurations
- Add Task: Create new automation task
- Filter Tasks: Apply various filtering criteria including class and element profiles
- Search Tasks: Quick search functionality
Secondary Actions
- Profile Management: Assign and modify element profiles including GKE server, Linux server/VM, and GCP costs profiles
- Organization Assignment: Change task ownership
- Status Management: Monitor and control task execution
- Pagination: Navigate through multiple pages of results (currently showing page 1 with 70 total results and "Show all" option available)
Notes/Tips
- Task Selection: Use the checkboxes to select multiple tasks for bulk operations
- Element Profile Matching: Ensure tasks are assigned to appropriate element profiles for successful execution, including Apps GKE server, Build Linux server/VM, and GCP costs profiles
- Organization Permissions: Task visibility and execution may be restricted based on organization membership
- Status Monitoring: Green checkmarks in the "Is active" column represent healthy/active tasks - monitor for any status changes
- Pagination: Use page navigation to view all 70 automation tasks or click "Show all" to display all results at once
- Filter Combinations: Multiple filters can be applied simultaneously for precise task management - filters are arranged vertically starting with Proceed status at the top
- Task Naming: Tasks follow a structured naming convention with technical identifiers in parentheses for easy identification
- Cloud Infrastructure: Multiple tasks are dedicated to GKE cluster maintenance and Kubernetes deployments
- Class Filtering: The "All" dropdown in the Class filter allows you to narrow tasks by their type (CLI, REST/HTTP, Notifications, File TX)
- Notification Badge: The eye icon displays a badge with "0" indicating the number of hidden or filtered tasks
Automation flows

Overview
The Automation Flows page in the Zequenze FLUX admin portal provides a comprehensive management interface for viewing, monitoring, and controlling automated workflows. This page displays all automation flows configured in the system with their current status, scheduling information, and execution details.
Key Features
- Flow Management Dashboard: Centralized view of all automation flows with real-time status monitoring
- Advanced Filtering: Multiple filter options including status, schedule, visibility, group, parent, and organization
- Bulk Operations: Import and add multiple flows with dedicated action buttons
- Status Tracking: Real-time status indicators (OK, Active, Failed) with timestamp information
- Scheduling Overview: Visual representation of flow schedules and execution times
- Group Organization: Flows organized by element groups and operational groups
UI Elements
Header Section
Action Bar
Filter Panel
The right-side filter panel displays the following filter options:
- Proceed: Top section with green "Proceed" button for applying filtered results
- Active: Dropdown filter with "All" selected for active/inactive flows
- Schedule: "Click for options" section for scheduling configuration
- Is public: Dropdown filter with "All" selected for visibility settings
- Group: "Click for options" section for operational groups
- Parent: Dropdown filter with "All" selected for parent-child relationships
- Organization: "Click for options" section with Sub-organizations checkbox option
- Proceed: Bottom section with green "Proceed" button for additional result processing
Main Data Table
The table displays the following columns:
- Checkbox: Row selection checkboxes for bulk operations
- Element Groups: Shows the automation flow names and descriptions
- Groups: Associated group tags (app-deploy, django-migrate, nms.ops, build.ops, reboot.prd, etc.)
- Element groups: Related element groupings
- Is active: Checkbox indicators for active/inactive status
- Schedule: Time-based scheduling information with duration indicators and scheduler tags
- Tasks status: Current execution status with OK/Failed indicators and timestamps showing both last and next execution times
- Is public: Visibility settings
- Organization: Organizational assignment (all showing "Zequenze")
- Proceed: Action column for individual flow operations
User Interactions
Navigation
Search and Filter
- Refresh Data: Click the circular arrow icon to refresh the flow list
- Bulk Selection: Use the "Select All" checkbox to select/deselect all flows
- Global Search: Use the search bar to find specific flows by name or description, then click the search button (magnifying glass icon)
- View Options: Click the eye icon with notification badge to access view configuration options
- Filter Panel: Click the "FILTER" button or the green filter toggle button to open/close the filter panel on the right side
- Clear Filters: Use the green filter toggle button with "X" to remove all applied filters
- Proceed Actions: Click the green "Proceed" buttons at the top or bottom of the filter panel to apply selected filters
- Active Filter: Use the dropdown filter (currently set to "All") to filter by Active/Inactive status
- Schedule Filter: Click "Click for options" to access scheduling filters
- Is public Filter: Use the dropdown (currently set to "All") to filter by visibility settings
- Group Filter: Click "Click for options" to filter by operational groups
- Parent Filter: Use the dropdown (currently set to "All") to filter by parent-child relationships
- Organization Filter: Click "Click for options" to access organizational filtering with sub-organization checkbox options
Flow Management Actions
- Select Flows: Use individual row checkboxes to select specific flows for bulk operations
- View Details: Click on any flow name to view detailed configuration
- Status Monitoring: Monitor real-time status indicators and timestamps
- Import Flows: Use the Import button to bulk import automation configurations
- Add New Flow: Use the Add button to create new automation workflows
- Filter Management: Use the filter panel to apply multiple filter criteria simultaneously
- Individual Actions: Use the action icons in the rightmost column for flow-specific operations
Data Displayed
Flow Information
- Flow Names: Descriptive names like "GENERATE DOCS", "GKE refresh ecr token", "GKE Maintenance Window Schedule Remove", "GKE Maintenance Window Schedule", "DJANGO MIGRATE APP", "APP CI / CD", "Docker images list", "Flow GCP costs", "k8s-renew-certs-netcard", "k8s-renew-certs-zqz", "Servers certificate update", "k8s-renew-certs-zequenze", "Dummy fail flow", "Server reboot database prd part4", "Server reboot database prd part3", "Server reboot database prd"
- Descriptions: Technical identifiers (ia-docs-generate, gke-refresh-ecr-token, gke-maintenance-remove, gke-maintenance-window, django-migrate-app, app-cicd-flow, images-docker-list, gcp_costs_flow, k8s-renew-certs-netcard, k8s-renew-certs-zqz, servers_cert_update, k8s-renew-certs-zequenze, dummy-fail-flow, server-reboot_db4, server-reboot_db3)
- Group Associations: Tags showing deployment groups, build operations, maintenance windows, NMS operations, and reboot operations
Status Indicators
- Green "OK" with Edit Icon: Successful execution with timestamps showing both last and next scheduled runs (Feb-Mar 2026)
- Red Circle Icons: Failed or error states in the rightmost column
- Blue Checkmarks: Active status indicators
- Scheduler Tags: Blue tags with dropdown indicators showing scheduler associations (DOCS scheduler, GKE refresh ecr token, GKE Maintenance Window Remove, GKE Maintenance Window, gcp_costs_scheduler, renew-certs-netcard, renew-certs-zqz, 24 hours, rebootschedulerdatabasepostgrescluster)
Execution Details
- Last Execution: Recent timestamps from February-March 2026 showing "(last)" designation
- Next Execution: Scheduled next run times showing "(next)" designation
- Duration: Expected or actual execution durations displayed in the schedule column (e.g., "24 hours")
Actions Available
Primary Actions
- Refresh: Update the flow list with latest information using the circular arrow icon
- Select All: Bulk select flows using the checkbox in the table header
- Search: Find specific flows using the search field and search button
- View Options: Access view configuration via the eye icon (shows notification badge with 1 item)
- Import: Bulk import automation flows from external sources
- Add: Create new automation flows with the flow builder
- Filter Toggle: Open/close the filter panel using the green filter button with funnel icon and "X"
- Proceed: Apply filtered results using the green "Proceed" buttons in the filter panel
- Edit: Modify existing flow configurations via edit icons in the status column
- Individual Actions: Access flow-specific operations via red circle icons in the rightmost column
Secondary Actions
- Save: Save current filter configurations (28 results Save button at bottom)
- Bulk Operations: Perform actions on multiple selected flows
- Filter Panel Management: Toggle the filter panel open/closed using the FILTER button with collapse arrow (×)
- Export: Export flow configurations (implied functionality)
Filter Panel Options
Status Filters
- Proceed: Top section with green "Proceed" button for applying filtered results
- Active: Dropdown filter currently set to "All" for active/inactive flows
- Schedule: "Click for options" section for scheduling configuration
- Is public: Dropdown filter currently set to "All" for visibility settings
Organizational Filters
- Group: "Click for options" section for operational groups
- Parent: Dropdown filter currently set to "All" for parent-child relationships
- Organization: "Click for options" section with Sub-organizations checkbox option
- Sub-organizations: Checkbox option to include or exclude sub-organizational flows
Additional Filtering
- Proceed Section: Additional green "Proceed" button at the bottom of the filter panel for processing filtered results
Notes/Tips
- Portal Context: This interface is part of the FLUX admin portal (dev environment) as shown in the left sidebar branding
- Status Monitoring: Green "OK" indicators with edit icons show successful recent executions with February-March 2026 timestamps, while red circle indicators in the rightmost column require attention
- Scheduling: Scheduler tags with dropdown indicators show automated scheduling with specific scheduler assignments, including duration-based schedules (e.g., "24 hours")
- Group Tags: Colored tags help quickly identify flow purposes (app-deploy, build.ops, nms.ops, reboot.prd)
- Real-time Updates: The page shows live status updates with precise timestamps for monitoring active operations, displaying both last execution and next scheduled execution times
- Filter Management: Use the green filter toggle button to quickly manage all applied filters and the filter panel visibility
- Bulk Operations: Select multiple flows using checkboxes to perform batch operations efficiently
- View Customization: The eye icon with notification badge indicates available view configuration options
- Organization Scope: Flows are scoped to your organizational access level (currently showing Zequenze organization)
- Advanced Filtering: Use the "Click for options" sections in the filter panel to access detailed filtering criteria
- Dual Proceed Buttons: The filter panel includes green "Proceed" buttons at both the top and bottom for convenient access to result processing options
- Scheduler Integration: Blue scheduler tags with dropdown indicators indicate integration with various automated scheduling systems for different operational tasks, including time-based schedules
- Individual Row Management: Each flow can be managed individually through its row interface, including edit icons in the status column and action icons in the rightmost column
- Execution Timeline: The Tasks status column clearly distinguishes between last execution time and next scheduled execution time with "(last)" and "(next)" labels
- Multiple Server Operations: The interface displays multiple related flows (e.g., server reboot database operations split into parts) for managing complex multi-step processes
Automation schedules

Overview
The Automation Schedules page in the Zequenze Control Portal provides a centralized view for managing all automation schedules within the system. This interface allows administrators to view, filter, and manage both interval-based and specific schedules that control various automated processes across the platform.
Key Features
Schedule Management Interface
- Comprehensive Schedule Listing: Displays all automation schedules in a structured table format
- Dual Schedule Types: Shows both Interval schedules (recurring time-based) and Specific schedules (targeted automation tasks)
- Public/Private Classification: Visual indicators showing whether schedules are publicly accessible
- Organization-based Grouping: Schedules are organized by their associated organizations (Root, Zequenze)
Advanced Filtering System
- Multi-criteria Filtering: Filter by Class, Public status, and Organization
- Real-time Search: Search functionality to quickly locate specific schedules
- Collapsible Filter Panel: Dedicated filter sidebar that can be opened/closed with Class, Is public, and Organization filter options
- Sub-organization Options: Organization filter includes sub-organization capabilities
UI Elements
Main Table Structure
- Name Column: Lists schedule names with time-based identifiers (1 hour, 5 minutes, etc.)
- Class Column: Shows schedule type with visual icons (Interval ⏱ or Specific schedule 📋)
- Is Public Column: Green checkmarks (✓) for public schedules, red X marks for private
- Organization Column: Displays the owning organization with clickable links
Control Panel
Filter Panel Interface
- Currently Closed: Filter panel is shown in collapsed state in the main interface
- Toggle Access: Can be expanded using the "FILTER" button in the top-right area
- Hidden Options: When expanded, provides Class, Is public, and Organization filtering options
Header Section
- Page Title: "SELECT AUTOMATION SCHEDULE TO CHANGE" prominently displayed at the top
- Breadcrumb Navigation: Clear path showing: Home > Automation > Automation schedules
User Interactions
Viewing Schedules
- Browse through 22 available automation schedules
- Sort schedules by clicking column headers
- View schedule details by clicking on schedule names
Filtering and Search
- Text Search: Use the search bar to find schedules by name
- Filter Panel Access: Click the "FILTER" button to expand the filter options panel
- Class Filter: Select between Interval and Specific schedule types (available when filter panel is expanded)
- Public Status Filter: Choose between public/private status options (available when filter panel is expanded)
- Organization Filter: Filter by Root, Zequenze, or other organizations with sub-organization support (available when filter panel is expanded)
Schedule Management
- Create New: Click the "+ Add" button to create new automation schedules
- Delete Existing: Use the red "✗" button to remove selected schedules
- Edit Existing: Click on schedule names to modify configurations
- Organization Links: Click organization names to view related resources
Navigation
Accessing This Page
- From the main dashboard: Navigate to Automation > Schedules
- Via the left sidebar: Click "Automation" then "Schedules"
- Direct URL:
/admin/automation/schedule/
Related Navigation
- Flows: Access automation workflows
- Tasks: View automation tasks
- Models: Manage automation models
- Logs: Review automation execution logs
Data Displayed
Schedule Types
-
Interval Schedules (Time-based recurring):
- 1 hour, 1 minute, 2 hours, 24 hours
- 30 minutes, 30 seconds, 5 minutes
- 7 days, 8 hours
- All marked as public and owned by Root organization
-
Specific Schedules (Task-specific):
- DOCS scheduler
- GKE Maintenance Window
- GKE Maintenance Window Remove
- GKE refresh ecr token
- gcp_costs_scheduler
- reboot_scheduler
- All marked as private and owned by Zequenze organization
Visual Indicators
- Green Checkmarks: Public schedules
- Red X Marks: Private schedules
- Blue Links: Clickable organization and schedule names
- Icons: Distinguish between Interval (⏱) and Specific (📋) schedules
Actions Available
Primary Actions
- Create Schedule: Add new automation schedules using the "+ Add" button
- Delete Schedule: Remove schedules using the red "✗" button in the control panel
- Edit Schedule: Modify existing schedules by clicking on their names
- Access Filters: Click the "FILTER" button to expand the filtering panel and apply search criteria
- Search Schedules: Quickly locate specific schedules using the search function
Secondary Actions
Notes/Tips
Best Practices
- Naming Convention: Notice that interval schedules use time-based names for easy identification
- Organization Structure: Most interval schedules belong to "Root" while specific tasks belong to "Zequenze"
- Public vs Private: Consider security implications when setting schedule visibility
- Filter Management: Click the "FILTER" button to access advanced filtering options when needed
Important Considerations
- Schedule Dependencies: Some schedules may depend on others (like maintenance windows before reboots)
- Resource Impact: Be aware that frequent interval schedules can impact system resources
- Monitoring: Regularly check the Logs section to ensure schedules are executing properly
- Deletion Warning: Use the delete function carefully as it may permanently remove automation schedules
Filter Usage Tips
- Click the "FILTER" button to reveal filtering options
- Use multiple criteria for precise schedule location
- Utilize organization-based filtering for better schedule organization
- Combine search with filters for optimal results
Services

Overview
The AI Services management page in the Zequenze Control Portal provides administrators with a centralized interface to manage and monitor artificial intelligence services within the FLUX admin portal. This page displays all configured AI services, their current status, and provides tools for service management and organization.
Key Features
- Service Listing: View all AI services in a tabular format with comprehensive details
- Real-time Status Monitoring: Track active/inactive status and public accessibility of services
- Organization Management: Filter and organize services by organizational units
- Configuration Management: Access to service configurations and profiles
- Bulk Operations: Import and add multiple services efficiently
- Advanced Filtering: Expanded filter panel with detailed filtering options
UI Elements
Main Navigation
Service Management Table
The main table displays the following columns:
- Name: Service identifier with configuration details
- Type: Service classification (Boolean switch, Central Authorization, Progress Bar, etc.)
- Is active: Green/red indicator showing service operational status
- Is public: Public accessibility status
- No logs: Log availability indicator (red dots indicate no logs available)
- Organization: Associated organizational unit (Zequenze, Root, Bestel)
Filter Panel (Right Side)
The filter panel is currently open and displays the following filter options:
- Proceed: Process status filter showing "Proceed" status
- Type: Service type selection dropdown with "Click for options" placeholder
- Service class: Classification filter options with "Click for options" placeholder
- Active: Status filter with "All" dropdown selection showing all active states
- Is public: Public accessibility filter with "All" dropdown selection
- Organization: Organizational unit filter with "Click for options" placeholder
- Sub-organizations: Additional organizational hierarchy filter option displaying "Proceed" status
User Interactions
Primary Actions
- Search: Use the search bar to find specific services by name or identifier
- Add Service: Click the blue "Add" button to create new AI services
- Import Services: Use the blue "Import" function for bulk service addition
- Filter Services: The filter panel is accessible on the right side with an "X" close button to collapse it when needed
- Remove Services: Use the green dropdown button with "×" symbol to access service removal options
- Refresh View: Use the refresh icon next to the search bar to reload the service list
Service Management
- Click on service names to access detailed configuration
- Monitor service status through visual indicators
- Access organization-specific services through the organization filter
Navigation
Access Path
Related Sections
- AI Services: Current location for service management
- Assistants: Access AI assistant configurations
- Dashboard: Return to main administrative overview
Data Displayed
The page currently shows 18 results with various services including:
- Boolean switch services: Multiple boolean switch configurations including "Boolean switch", "Inbound calls - Boolean switch", and "Outbound calls - Boolean switch"
- Authorization services: Central authorization and local authorization services
- Progress Bar services: Multiple test services including Progress Bar 100 Test Service, Progress Bar 25 Test Service, Progress Bar 50 Test Service, and general Progress Bar service
- Configuration services: OpenAI gpt-4-o model configuration, Flow & Task prompt config
- Device extraction services: GPT End User Device Extractor
- Testing services: Numeric Spin test
- Data services: Default log retention
Each service displays:
- Service type and classification
- Active/inactive operational status
- Public accessibility settings
- Organizational assignment (Zequenze, Root, Bestel)
- Log availability status (red indicators show services without logs)
Actions Available
Service Management Actions
- Create New Services: Add individual AI services through the blue "Add" button
- Bulk Import: Import multiple services from external sources using the blue "Import" button
- Remove Services: Access service removal functions through the green dropdown button with "×" symbol
- Refresh Data: Update the service list using the refresh icon in the toolbar
- Status Monitoring: Track real-time service availability and performance
- Access Control: Manage public/private service accessibility
- Organization Assignment: Associate services with specific organizational units
Filter Management Actions
- Close Filter Panel: Click the "X" button on the expanded filter panel to collapse it
- Apply Multiple Filters: Use various filter criteria simultaneously to refine service views through the open filter panel
- Reset Filters: Clear applied filters to show all services
- Sub-organization Filtering: Use the sub-organizations filter to narrow results by organizational hierarchy
Administrative Functions
- Filter and Sort: Organize services by multiple criteria using the expanded filter panel
- Configuration Access: Direct access to service configuration details
- Process Tracking: Monitor service processing status through the Proceed filter
Notes/Tips
Best Practices
- Use the expanded filter panel to efficiently manage large service inventories with multiple filtering criteria
- Monitor active/inactive status to ensure service availability
- Keep track of services without logs (indicated by red dots in "No logs" column)
- Regularly review public accessibility settings for security compliance
- Use the refresh icon to ensure you're viewing the most current service data
- Close the filter panel using the "X" button when not needed to maximize table viewing space
- Use the removal function carefully to avoid deleting critical services
- Utilize the sub-organizations filter to manage complex organizational hierarchies
Important Considerations
- Services marked as inactive may affect dependent applications
- Organization filters help manage multi-tenant environments
- The "No logs" indicator helps identify services requiring attention
- Multiple service types are available including Boolean switches, authorization services, and configuration tools
- The filter panel can be collapsed or expanded as needed for optimal workspace management
- Service removal actions should be performed with caution as they may affect system functionality
User Account Information
- Currently logged in as:
la.docs@zequenze.com - Role: Root administrator access
- Environment: FLUX admin portal (dev) v1.0.0-dev
Metric logs

Overview
The Metric Logs page in the Zequenze FLUX Admin Portal provides a comprehensive view of all metric data collected from various devices and sensors in your fleet. This centralized logging system displays real-time and historical metric information, allowing administrators to monitor system performance, track data collection activities, and troubleshoot connectivity issues across their IoT infrastructure.
Key Features
- Real-time Metric Monitoring: View live data streams from connected devices and sensors
- Historical Data Access: Browse through timestamped metric logs with detailed filtering options
- Multi-parameter Tracking: Monitor various data types including package management operations (ignored, removed, installed, upgraded, pending upgrades)
- Advanced Filtering: Filter logs by date/time, element, location, profile, parameter, and organization
- Data Export Capabilities: Export metric data for external analysis and reporting
- Pagination Support: Navigate through large datasets efficiently with pagination controls
UI Elements
Main Data Table
The central table displays metric logs with the following columns:
- Transaction date/time: Timestamp of when the metric was recorded (Feb 13, 2026 format with precise timestamps)
- Element: Device or sensor identifier (shows various servers including nms-st01.ops.zequenze.com, gate01.dev.zequenze.com, flux01.prd.zequenze.com, ctt01.qat.zequenze.com, and ctt01.dev.zequenze.com with Ubuntu Linux server/VM configurations)
- Origin: Source of the data collection (Scheduler)
- Location: Physical or logical location of the device (Amazon Web Services, Google Cloud)
- Metric/Parameter: Type of operation being tracked (Ignored packages, Removed packages, Installed packages, Upgraded packages, Pending upgrades)
- Result: Actual metric values showing numerical results (0.0, 4.0) with information icons, or dashes for non-numerical results
- Organization: Associated organization (Zequenze)
Filter Panel (Right Sidebar)
The filter panel is positioned on the right side with the following elements:
- Active Filters: Shows currently applied filters with "Proceed" status indicator at the top
- Date/Time Filter: "Last hour" dropdown selection
- Records Per Page: Set to "50 records" with dropdown options
- Element Filter: "Click for options" dropdown
- Profile Filter: "Click for options" dropdown
- Location Filter: "Click for options" dropdown
- Parameter Filter: "Click for options" dropdown
- Organization Filter: "Click for options" dropdown with "Sub-organizations" checkbox option
- Proceed Button: Green "Proceed" button at the bottom to apply selected filters
Top Navigation Bar
User Interactions
Viewing Metrics
- Users can scroll through the paginated list of metric entries
- Click on column headers to sort data by specific criteria
- Use the pagination controls at the bottom (1, 2, Next, showing "60 results" with "Show all" option) to navigate through results
- Click the refresh button to reload the latest metric data
Filtering Data
- Access the filter panel by clicking the green filter button on the right side
- Select specific time ranges using the Date/Time dropdown
- Choose specific elements, profiles, locations, or parameters from their respective dropdowns
- Toggle "Sub-organizations" checkbox to include or exclude sub-organization data
- Click the green "Proceed" button at the bottom to apply selected filters
- Apply multiple filters simultaneously for refined results
- Use the 'X' button in the top-right corner to close the filter panel
Data Export
- Click the blue "Export" button to download filtered metric data
- Select from available export formats for external analysis
Navigation
Accessing the Page
Related Pages
- Dashboard: Return to main overview
- Inventory: Access other inventory management features
- Elements: Manage individual device configurations
- Settings: Configure metric collection parameters
- Configuration blocks: Configure metric collection rules
- Profiles: Manage device profiles
- Groups: Organize elements into groups
- Scripts: Automate metric collection
- Locations: Manage location settings
- Credentials: Configure authentication for devices
Data Displayed
Metric Types
The system tracks package management operations across devices:
- Ignored packages: Packages that are excluded from management operations
- Removed packages: Packages that have been uninstalled from systems
- Installed packages: Packages that have been newly installed
- Upgraded packages: Packages that have been updated to newer versions
- Pending upgrades: Packages awaiting update operations
Device Integration
The system tracks metrics from various infrastructure elements including:
- nms-st01.ops.zequenze.com: Ubuntu Linux server/VM on Amazon Web Services
- gate01.dev.zequenze.com: Ubuntu Linux server/VM on Google Cloud
- flux01.prd.zequenze.com: Ubuntu Linux server/VM on Amazon Web Services
- ctt01.dev.zequenze.com: Ubuntu Linux server/VM on Google Cloud
- ctt01.qat.zequenze.com: Ubuntu Linux server/VM on Google Cloud
Data Values
The system tracks metrics with:
- Numerical Results: Values like 0.0, 4.0 displayed with information icons providing additional context
- Non-numerical Results: Represented by dashes (-) for operations without quantifiable values
- Package Counts: Tracking the number of packages affected by various operations
Temporal Data
- All entries are timestamped with precise date and time information
- Data spans multiple time periods for historical analysis
- Recent entries from February 13, 2026 are displayed with timestamps ranging from 05:48 to 05:49 PM
Actions Available
Primary Actions
- Refresh Data: Click the refresh button to reload the latest metric information
- Filter Metrics: Apply various filters to narrow down displayed data using the green filter button
- Export Data: Download metric information for external use using the blue export button
- Generate Reports: Create formatted reports from selected metrics using the blue reports button
- Search Records: Use the search function with magnifying glass icon to find specific entries
- Paginate Results: Navigate through large datasets using page controls (1, 2, Next) or click "Show all" to view all 60 results
- Toggle View Options: Use the eye icon to adjust viewing preferences
Administrative Actions
- Monitor Real-time Data: View live metric updates as they occur
- Analyze Trends: Compare historical data across different time periods
- Track Package Operations: Monitor package management activities across the infrastructure
- Multi-cloud Monitoring: Track operations across Amazon Web Services and Google Cloud deployments
- Organization Management: Filter data by organization and sub-organizations
Notes/Tips
Performance Optimization
- Use specific filters to reduce large dataset load times
- Consider exporting data for complex analysis rather than processing in-browser
- The default "Last hour" filter helps focus on recent activity
- Use the refresh button to ensure you're viewing the most current data
Data Interpretation
- 0.0 Results: May indicate no packages matched the operation criteria during the measurement period
- Dash (-) Results: Indicate operations that don't produce numerical results but were successfully executed
- Information Icons: Hover over or click the information icons next to numerical results for additional context
- Pending Upgrades: Non-zero values indicate packages awaiting updates that may require attention
Best Practices
- Regularly monitor package management metrics to maintain system security and stability
- Use the organization filter when managing multi-tenant environments
- Export historical data periodically for long-term trend analysis and compliance reporting
- Monitor both installed and upgraded packages to track system changes
- Track pending upgrades to ensure timely security updates
- Monitor operations across both Amazon Web Services and Google Cloud to maintain multi-cloud visibility
- Use the sub-organizations filter to analyze metrics at different organizational levels
Automation Contexts
Overview
This document explains how automation contexts are constructed, composed, and made available across every execution layer of the FLUX automation application: flows, tasks, scripts, models, and services (email-msg).
Contexts provide a structured way to pass data and configuration throughout the automation pipeline, ensuring that each component has access to the appropriate information needed for execution.
Think of context as a "backpack of information" that moves through the execution. It starts with base device data and gets enriched as the process moves forward. The main idea: each step can reuse what previous steps already discovered.
Base Element Context
Function: element_context_generate(element)
The element context serves as the foundation of every execution. It is generated once per element at the beginning of each task or flow execution step and is passed throughout the entire pipeline.
Source Location: apps/inventory/utils.py → element_context_generate()
Context Structure
The base element context contains the following components:
{
# ── Group Variables ─────────────────────────────────────────────────────────
# One key per GroupVariable configured in any Group assigned to the element.
# Variables with dots in their name are expanded into nested dictionaries.
# Example: "if.description" → context["if"]["description"] = value
"<variable_name>": "<value>",
"<nested.variable>": "<value>", # expanded: context["nested"]["variable"]
# ── Element Settings (ElementSetting) ───────────────────────────────────────
# One key per parameter configured in the element's Profile.
# Key format: [group.variable_root.][instance.]parameter.variable_name
# Example: "net.0.hostname" → context["net"]["0"]["hostname"]
"<parameter_variable_name>": "<value>",
# ── Element Serialization ───────────────────────────────────────────────────
"element": { # Serialized Element (all database fields)
"id": 1,
"name": "router-01",
"uuid": "...",
"status": True, # operational status
"status_change": "...", # last status change datetime
"prev_status_change": "...",
"is_active": True,
"debug": False,
"sync": False,
"reconf": False,
"internal": False,
"location": { # nested — all Location fields
"id": 1,
"name": "DataCenter A",
...
},
"latitude": None,
"longitude": None,
"profile": 3, # Foreign Key ID
"organization": 1, # Foreign Key ID
"is_public": False,
"group": [2, 5], # list of Foreign Key IDs
"certificate": None,
"key": None,
"password": None,
"elevated_priv_password": None,
"management_address": "192.168.1.1",
"management_gateway": None,
"transport_settings": None,
"software_version": "17.3.4",
"hardware_version": None,
"serial_number": "FTX1234ABCD",
"serial_number_alt": None,
"ip_address": None, # Foreign Key ID
"ip_network": None,
"dfgw_address": None,
"dns_servers": None,
"mac_address": None,
"created": "...",
"created_by": 1,
"last_change": "...",
"first_execution": "...",
"last_execution": "...",
"description": "Core router",
"description2": None,
"description3": None,
"description4": None,
"notes": None,
"active_alert": None,
"alert": None,
},
# ── Timestamp ───────────────────────────────────────────────────────────────
"epoch": 1710000000, # UTC timestamp (integer) at context generation time
}
Flow Context Addition: context['flow']
When a task runs inside a flow (via run_task_wrapper), the following key is automatically added before the TaskContext is built:
context['flow'] = {
'user': {
'id': user.id,
'username': user.username,
'full_name': user.get_full_name(),
'email': user.email,
}
# Returns empty dictionary {} if no user is associated with the flow
}
When a user runs the flow, user info is also loaded as real runtime variables:
flow_variables = {'user': None}
flow_variables['user'] = {
'id': user.id,
'username': user.username,
'full_name': user.get_full_name(),
'email': user.email,
}
Task Results Addition: context['tasks']
At the beginning of each task execution within a flow, the task results accumulated so far for the current element are merged into the context:
if self.ctx.flow and self.ctx.flow_context:
self.ctx.context['tasks'] = self.ctx.flow_context[-1]['tasks']
This allows scripts to read results from previously-executed tasks of the same element within the current flow run.
TaskContext Class
The TaskContext groups all execution-time variables for a single task run on a single element.
Source Location: apps/automation/task_utils.py → TaskContext
TaskContext Properties
class TaskContext:
element # Element ORM instance
flow # Flow ORM instance (or None if standalone task)
flow_context # list[dict] — the live flow context list (see Flow Context section)
context # dict — base element context (element_context_generate), modified in-flight
user # User ORM instance (or None)
Important: The context property is mutable throughout the pipeline. Management scripts, processing scripts, and the task runner itself add keys to it as the task progresses.
Flow Context (flow_context)
A Flow runs over one or more elements (devices). The flow_context is a list built progressively as the flow processes elements — one entry per element.
Source Location: apps/automation/flow_utils.py → FlowManager
Per-Element Entry Structure
For each element, the flow creates this structure:
{
"id": element.id, # element.id
"context": element_context_generate(element), # full element_context_generate() result
"tasks": {} # populated after each task finishes
}
Each element in the flow generates an entry with the following structure:
{
"id": 42, # element.id
"context": { # full element_context_generate() result
... # all keys from Base Element Context section
},
"tasks": { # populated after each task finishes
"<task_pk_as_str>": {
# Keys depend on which steps ran:
"management_script": {
"status": "OK",
"result": {...}
},
"process_model": {
"status": "OK",
"result": "<rendered model string>"
},
"model_commands": {
"status": "OK",
"result": "<raw command output>"
},
"processing_model_out": {
"status": "OK",
"result": {...}
},
"element_data_mapped": {
"status": "OK",
"result": {...}
},
"execute_service": {
"status": "OK",
"result": {}
},
},
"<another_task_pk>": { ... },
}
}
The list grows as each element is processed by the flow:
- Serial flows: Process one element at a time
- Parallel flows: Launch all elements concurrently, but the list is still populated per-element
How Flow Context is Used
- The flow knows which element is being processed (
id+context). - The flow keeps task results in
tasksas execution moves forward. - Next flow steps can make decisions using those accumulated results.
Script Contexts
FLUX automation provides five distinct types of scripts, each receiving a different set of variables and serving specific purposes in the automation pipeline.
Flow Pre-Execution Script
Purpose: Runs once before any element loop, used to sort or filter the element list.
Script Type: processing_script on Flow
Source Location: FlowManager.flow_execute_processing_script()
Context Variables
{
"elements": list[Element], # full list of elements that will run the flow
"order_flow_elements": Callable, # sort_flow_elements(elements, sort_fn, reverse=False)
"filter_flow_elements": Callable, # filter_flow_elements(elements, filter_fn, inplace=True)
"settings": {}, # unused output placeholder
}
Output Expectations
- No explicit output expected
- The
elementslist is modified in place
Available Modules
math, json, random, naturaltime, re, ssh_key_generate, time
Flow Execution Script
Purpose: The main flow script that calls run_task() / run_flow() to orchestrate execution.
Script Type: execution_script on Flow
Serial Flow Context
Execution: One invocation per element
Source Location: SerialFlowManager.run_script()
{
"context": dict, # flatten_dictionary(flow_context) — flattened snapshot
"flow_variables": {
"user": {
"id": ...,
"username": ...,
"full_name": ...,
"email": ...
} # or None if no user
},
"element": Element, # current element ORM instance
"elements": list[Element], # parent flow's elements (if nested), else None
"current": int, # index of current element (0-based)
"previous": int, # current - 1
"last": int, # len(elements) - 1
"first": 0,
"settings": {}, # unused
"run_task": Callable, # run_task(id=None, short_name=None, retry_attempts=1, retry_delay=0)
"run_flow": Callable, # run_flow(id=None, short_name=None, elements=None, ...)
}
Key Points:
- The
run_taskcallable executes the task for the current element only - After script execution,
action_statusandaction_infoare read fromscript_contextand stored in the flow log
Magic Replacements: Applied to the script string before execution:
| Placeholder | Replaced With |
|---|---|
current |
str(current_order) |
previous |
str(current_order - 1) |
last |
str(flow_elements_count - 1) |
first |
"0" |
Parallel Flow Context
Execution: One invocation for all elements at once
Source Location: ParallelFlowManager.run_script()
{
"context": dict, # flatten_dictionary(flow_context)
"flow_variables": dict, # same as serial (see above)
"elements": list[Element], # all elements of this flow
"settings": {},
"run_task": Callable, # run_task_in_elements(id=, short_name=, elements=None, ...)
"run_flow": Callable, # run_flow_in_elements(id=, short_name=, elements=None, ...)
"filter_flow_elements": Callable,
}
Key Points:
- The
run_taskcallable spawns one thread per element
Available Modules
math, json, random, naturaltime, re, ssh_key_generate, time, pause
TaskFlow Condition Script
Purpose: Executed before deciding whether to execute a task step for a given element.
Script Type: condition_value on TaskFlow
Source Location: task_flow_execute_condition_script()
Context Variables
{
"flow_context": list[dict], # full flow_context list (see Flow Context section)
"current": int, # current element order
"previous": int, # current - 1
"last": int, # len(elements) - 1
"first": 0,
"settings": {},
}
Output Requirements
The script must assign: condition = True or condition = False
Available Modules
math, json, random, naturaltime, re, ssh_key_generate, time
Task Management Script
Purpose: Runs as Step 1 of the task pipeline, before any connection to elements. Used to enrich the context (e.g., resolve credentials, build payloads, call APIs, wait for element availability).
Script Type: management_script on Task
Source Location: task_execute_script(..., klass='mgmt')
A Task receives element context and can enrich it while it runs. When a task starts inside a flow:
element_context = element_context_generate(element)
element_context['flow'] = flow_variables if flow_variables else {}
Then, right before task execution, previous task results for that same element are injected:
self.ctx.context['tasks'] = self.ctx.flow_context[-1]['tasks']
Context Variables
{
"element": PublicElement, # wraps the Element (restricted write interface)
# only if 'element.' appears in the script text
"config": PublicElementConfig, # wraps ElementConfig (read/save last config)
# only if 'config.' appears in script text
"data": {}, # always empty for management scripts
"context": dict, # full element context dict (mutable — write here)
"flow_context": None, # NOT passed from run_management_script
"settings": {}, # not used as output for mgmt scripts
"pause": Callable, # pause(sleep=30, user_msg=None)
"wait_for_connect": Callable, # wait_for_connect(timeout=10, retry=1, sleep=30, user_msg=None)
"log_message": Callable, # log_message(level, msg)
}
Writing Output
# Add/update keys in element context
context['my_new_variable'] = 'value'
context['credentials'] = {'user': 'admin', 'pw': 'secret'}
Output Processing
-
Extraction Method:
result.pop('context', {}) -
Integration: The entire
contextdict after execution is merged intoTaskContext.contextvia.update()
If a management script returns new context data, it is merged directly:
self.ctx.context.update(script_out)
Available Modules
math, json, random, naturaltime, re, ssh_key_generate, time
Task Processing Script
Purpose: Runs as Step 7, after model commands have been sent and parsed. Used to transform, validate, or enrich the data extracted from the element before it is stored in the database.
Script Type: processing_script on Task
Source Location: task_execute_script(..., klass='proc')
Context Variables
{
"element": PublicElement, # same as management script
"config": PublicElementConfig,
"data": dict, # current processing_out (command results, parsed data)
"context": dict, # full element context dict (read + write)
"flow_context": None, # NOT currently passed from run_processing_script
"settings": {}, # output dict — write results here
"pause": Callable,
"wait_for_connect": Callable,
"log_message": Callable,
}
Writing Output
settings['hostname'] = data.get('Hostname', '').strip()
settings['action_status'] = 'ok' # optional — stored in task results
settings['action_info'] = 'Hostname updated'
Special Output Keys
| Key | Purpose |
|---|---|
action_status |
Stored in TaskResults.action_status and flow log |
action_info |
Stored in TaskResults.action_info and flow log |
Output Processing
-
Extraction Method:
result.pop('settings', {}) -
Integration: Merged into
TaskManager.results.processing_outvia.update()
Available Modules
math, json, random, naturaltime, re, ssh_key_generate, time
How Task Context is Used
The task can:
- Read base element data (
element,epoch, settings/group variables) - Read flow user data in
context['flow'] - Read previous task outputs in
context['tasks'] - Add more data for later steps
Concrete runtime behavior already used in code:
if not self.results.commands_out and self.ctx.context.get('automation_custom_output'):
self.results.commands_out = self.ctx.context['automation_custom_output']
Model Python Script Context
For models with klass in ('pyms', 'pyps'), a Python script runs inside the model data mapping process.
Source Location: apps/automation/utils.py → model_data_map_python_script()
Context Variables
{
"model": Model, # the Automation Model ORM instance
"data": str, # raw text data received from element (for pyps)
# empty string for pyms (no raw data)
"context": dict, # full element context dict (read-only recommendation)
"output": {}, # write results here
"settings": {}, # alternative output dict
}
Writing Output
output['parsed_value'] = some_function(data)
output['hostname'] = re.search(r'hostname (\S+)', data).group(1)
Output Processing
-
Extraction Method:
result.pop('output', {}) -
Special Handling: If
contextwas also modified, it is merged underoutput['context']
Additional Modules
math, json, random, naturaltime, re, time, boto3, botocore, collections, datetime, timedelta, gcp_bigquery, gcp_service_account, timezone, pytz
Service Execution Context (email-msg)
Purpose: Handles email service execution during task completion.
Source Location: apps/automation/utils.py → task_execute_service()
Called In: TaskManager.execute_service() (Step 9)
A Service (email service in this case) uses the context available at service execution time.
Email Context Assembly
At service step, the email context is assembled exactly like this:
email_context = {
# ── Fixed Keys ──────────────────────────────────────────────────────────────
'element': element, # raw Element ORM instance
'task': task, # Task ORM instance (name, short_name, id, ...)
'body_custom_msg': notification_content, # 'content' param from service settings
# ── Task Context (spread) ───────────────────────────────────────────────────
# Everything from TaskContext.context at the time execute_service runs:
# - all base element context keys (group variables, element settings, context['element'], epoch)
# - context['flow'] = flow_variables (if running inside a flow)
# - context['tasks'] = previous tasks results for this element in this flow
# - any keys added by management_script or processing_script
**task_context,
# ── Flow Context Entry (spread) ─────────────────────────────────────────────
# The flow_context[-1] dict for the current element (see Flow Context section), or {} if standalone:
# - "id": element.id
# - "context": element_context_generate(element) (original snapshot)
# - "tasks": { "<task_pk>": task_detail, ... }
**flow_context_entry,
}
Service Settings Parameters
These parameters are configured on the Service instance of type email-msg:
| Parameter | Usage |
|---|---|
from-email |
Sender address |
custom_to |
Comma-separated recipient list |
subject |
Email subject (Django template rendered) |
content |
body_custom_msg in the email context |
template |
Template ID (optional, selects HTML template) |
Injecting Custom Variables
The task_context received by task_execute_service() is directly self.ctx.context — the same mutable dictionary that circulates through the entire task pipeline. Since the service runs in step 9, results from both the management script (step 1) and processing script (step 7) are available.
Management Script → Official Channel
Script results are applied with .update() to ctx.context:
# In task management_script (klass='svc'):
context['recipient_email'] = element.get('email_contact', '')
context['alert_level'] = 'critical' if context.get('status') == 'down' else 'info'
context['custom_subject'] = f"[{element['name']}] Alert processed"
# All these keys will be available in the email template
Processing Script → Direct Dictionary Mutation
The processing script receives the same context object by reference. Its official output (settings) goes to processing_out (and from there to the database), not to ctx.context. However, since the dictionary is passed by reference, writing directly to context within the processing script also persists and reaches the service:
# In task processing_script:
settings['sw_version'] = data.get('version', '') # → processing_out → Database
# To pass something additional to the service:
context['parsed_hostname'] = data.get('hostname', '') # → persists in ctx.context → reaches service
Data Flow Summary
| Source | Destination | Available in email_context? |
|---|---|---|
context['x'] = val in management script |
ctx.context via .update() |
✓ Yes |
context['x'] = val in processing script |
ctx.context direct (by reference) |
✓ Yes |
settings['x'] = val in processing script |
results.processing_out → Database |
✗ No (unless also copied to context) |
flow_variables (user info from flow) |
context['flow'] |
✓ Yes (as context['flow']['user']) |
How Service Context is Used
Email subject/body and template can use:
- Task and element data
- Anything previously added to
task_context - If the flow already has task results, those are also available through the merged context
Context Lifecycle Within Task Execution
The following table summarizes which context is available at each step of TaskManager.execute():
| Step | Method | Context at Entrance | Context Modifications |
|---|---|---|---|
| — | execute() starts |
Base element context | context['tasks'] added if inside flow |
| 1 | run_management_script() |
Base context | Script can add/modify any key in context |
| 2 | element_data_mapping() |
Context enriched by step 1 | results.model_out set |
| 3–6 | connect_with_element() … |
Same context | results.commands_out, processing_out built |
| 7 | run_processing_script() |
Same context + data=processing_out |
results.processing_out updated from settings; action_status/action_info stored |
| 8 | mapping_result_to_database() |
Same context + processing_out | Element parameters saved to database |
| 9 | execute_service() |
Same context | Email sent; service_out merged into processing_out |
| 10 | finish_execution() |
Final context | Task log created; flow_context[-1]['tasks'][task_pk] updated |
Context Lifecycle Within Serial Flow Execution
FlowManager.flow_execute()
│
├─ flow_execute_processing_script() ← receives: elements list (can sort/filter)
│
└─ for each element:
flow_context.append(get_flow_context_for_element(element))
│
└─ SerialFlowManager.run_script(element, order)
│ receives: flattened flow_context, element, positions, run_task, run_flow
│
└─ run_task(id, short_name)
│
└─ run_task_wrapper()
│ element_context = element_context_generate(element)
│ element_context['flow'] = flow_variables
│
└─ TaskManager.execute()
├─ context['tasks'] = flow_context[-1]['tasks']
├─ run_management_script() → context enriched
├─ element_data_mapping()
├─ connect_with_element()
├─ model_commands_execution()
├─ custom_model_commands_output_processing()
├─ convert_command_results...()
├─ run_processing_script() → processing_out enriched
├─ mapping_result_to_database()
├─ execute_service() → email sent with full context
└─ finish_execution()
└─ flow_context[-1]['tasks'][task_pk] = task_detail
Context Lifecycle Within Parallel Flow Execution
ParallelFlowManager
│
├─ for each element: flow_context.append(get_flow_context_for_element(element))
│
└─ run_script()
│ receives: flattened flow_context, all elements, run_task_in_elements
│
└─ run_task_in_elements(id, short_name, elements=None)
│
└─ spawns one thread per element → run_task_wrapper() (same as serial)
Key Difference: The parallel flow script sees all elements at once. The context variable in the script is the flattened snapshot of flow_context (all elements merged), not a per-element view.
Variable Availability Reference
This table shows which variables are available in each script type:
| Variable | Flow Pre-exec | Flow Exec (Serial) | Flow Exec (Parallel) | Task Condition | Task Mgmt Script | Task Proc Script | Model pyms/pyps | Service (Email) |
|---|---|---|---|---|---|---|---|---|
element (Element ORM) |
✗ | ✓ | ✗ | ✗ | ✓ (PublicElement) | ✓ (PublicElement) | ✗ | ✓ |
elements (list) |
✓ | ✓ (parent) | ✓ | ✗ | ✗ | ✗ | ✗ | ✗ |
context (element ctx dict) |
✗ | ✓ (flattened) | ✓ (flattened) | ✗ | ✓ (mutable) | ✓ (read) | ✓ (read) | ✓ (spread) |
flow_context (list) |
✗ | ✗ | ✗ | ✓ | ✗ | ✗ | ✗ | ✓ (latest entry) |
flow_variables (user info) |
✗ | ✓ | ✓ | ✗ | ✗ | ✗ | ✗ | ✗ |
data |
✗ | ✗ | ✗ | ✗ | ✓ (empty) | ✓ (processing_out) | ✓ (raw text) | ✗ |
settings (output) |
✗ | ✗ | ✗ | ✗ | ✗ | ✓ write here | ✗ | ✗ |
output (output) |
✗ | ✗ | ✗ | ✗ | ✗ | ✗ | ✓ write here | ✗ |
condition (output) |
✗ | ✗ | ✗ | ✓ write here | ✗ | ✗ | ✗ | ✗ |
run_task |
✗ | ✓ | ✓ | ✗ | ✗ | ✗ | ✗ | ✗ |
run_flow |
✗ | ✓ | ✓ | ✗ | ✗ | ✗ | ✗ | ✗ |
current/previous/last/first |
✗ | ✓ | ✗ | ✓ | ✗ | ✗ | ✗ | ✗ |
config (PublicElementConfig) |
✗ | ✗ | ✗ | ✗ | ✓ | ✓ | ✗ | ✗ |
pause(sleep) |
✓ | ✓ | ✓ | ✗ | ✓ | ✓ | ✗ | ✗ |
wait_for_connect(...) |
✗ | ✗ | ✗ | ✗ | ✓ | ✓ | ✗ | ✗ |
task (Task ORM) |
✗ | ✗ | ✗ | ✗ | ✗ | ✗ | ✗ | ✓ |
body_custom_msg |
✗ | ✗ | ✗ | ✗ | ✗ | ✗ | ✗ | ✓ |
Writing to Context from Scripts
Management Script → Context Enrichment
context['resolved_ip'] = '10.0.0.1'
context['credentials'] = {'username': 'admin', 'password': 'secret'}
# These are available to all subsequent steps in the same task execution
Processing Script → Settings Population
settings['hostname'] = data.get('hostname', '').strip()
settings['sw_version'] = re.search(r'Version (\S+)', data.get('version', '')).group(1)
settings['action_status'] = 'ok' # or 'warning', 'error'
settings['action_info'] = 'Parsed 3 parameters successfully'
# Keys in settings are merged into processing_out and saved to ElementSetting
Model pyms/pyps Script → Output Writing
output['interface_count'] = len(re.findall(r'^interface', data, re.M))
output['mgmt_address'] = context.get('element', {}).get('management_address')
Flow Execution Script → Results Reading
# After run_task runs, results are accumulated in flow_context and
# available via the flattened context dict in the next run_task call
# (for reading, use the full flow_context structure)
run_task(short_name='collect-hw')
run_task(short_name='send-report') # can read results from collect-hw via context['tasks']
Summary: End-to-End Context Flow
| Case | Real context source | Practical use |
|---|---|---|
| Flow | {"id", "context", "tasks"} per element + flow_variables['user'] |
Coordinate and track full flow execution |
| Task | element_context_generate(...) + flow + tasks + script updates |
Run task logic with up-to-date shared data |
| Service | email_context = fixed keys + merged task/flow context |
Send dynamic email content with real execution data |
Real Path Through System
- Flow creates per-element context:
id,context,tasks. - Task starts and receives base context +
flow_variables. - Task injects previous task results into
context['tasks']. - Management/processing steps enrich available data.
- Service runs and receives merged
email_context(element + task + accumulated context).
Result: Services run with real, current data from the same execution — no manual copy/paste. Flows create and organize context, tasks enrich and consume it, and services use it to execute with full, real execution state.