# CONTROL Users Guide
Documentation for CONTROL Users Guide
# Overview
# Architecture
## Overview
The CONTROL platform is built on Zequenze's core framework architecture, designed for scalability and performance. The system is organized into three main layers that work together to provide comprehensive device and service management capabilities.
## Architecture Layers
### Machine Interfaces
The interface layer handles all communication protocols and external connections:
- TR069
- MQTT
- Web Server
- Additional protocol adapters
### Application Layer
The application layer provides core management functionality:
- Device Management
- Service Management
- Firmware Manager
- Additional management applications
### Databases
The data layer stores and manages:
- Device records
- Metrics and telemetry data
- Configuration data
- Additional operational data
## Architecture Diagram
## Scalability
Each architectural layer can be scaled horizontally independently, allowing you to optimize resources based on specific requirements:
- **Traffic volume** – Scale interface layers to handle increased connection loads
- **Activity levels** – Scale application layers to process more operations
- **Data size** – Scale database layers to accommodate growing data storage needs
## Related Documentation
- [What is CONTROL?](https://docs.zequenze.com/books/control/page/what-is-control)
- [Specifications](https://docs.zequenze.com/books/control/page/specifications)
# Specifications
## Overview
CONTROL is a carrier-grade device management platform designed for service providers requiring comprehensive multi-vendor and multi-protocol device management capabilities.
## Platform Characteristics
### Carrier-Grade Architecture
- **Multi-protocol and multi-vendor support**: Enables management of diverse device ecosystems through multiple southbound protocols including TR-069, MQTT, SNMP, API, and CLI
- **Standards compliance**: Full adherence to Broadband Forum Device Management Specifications
- [CPE WAN Management Protocol](https://cwmp-data-models.broadband-forum.org/) ([TR-069 Amendment 6](https://www.broadband-forum.org/technical/download/TR-069_Amendment-6.pdf))
- **Cloud-native design**: Horizontally scalable cloud-based architecture for enterprise-grade performance
- **OSS/BSS integration**: Seamless integration with Service Provider operational and business support systems through flexible APIs
### Core Functionalities
**Device Lifecycle Management**
- Automated device onboarding
- Comprehensive firmware management
- Bulk provisioning capabilities
**Configuration Management**
- Device general information and configuration
- WAN technologies: LTE, GPON, Cable, DSL
- LAN and WiFi configuration
- CWMP protocol configuration
- Services configuration
- Configuration scripting and automation
**Diagnostics and Troubleshooting**
- TR-143 based device diagnostics
- Advanced CLI for technical troubleshooting
- Real-time device monitoring
### Scalable Database Architecture
- Integrated database for high-scale deployments supporting millions of device records
- Native database integration with optional support for external database systems
- Multiple device provisioning methods:
- Web-based GUI
- Bulk provisioning
- Auto-onboarding
- External API integration
### Flexible Management Interface
**Dual Access Methods**
- Intuitive web-based GUI for manual operations
- Comprehensive API for automation and integration
**Role-Based Access Control**
- Customizable privileges based on user and organization profiles
- Support for multiple user types: call center users, NOC operators, engineering staff
### Reports and Analytics
**Comprehensive Reporting**
- Device-based reports
- Location and group-based analytics
- Interactive heatmaps
**Data Analysis and Export**
- Historical metrics tracking for any device parameter
- Multiple export formats: CSV, API, and more
- Custom reporting capabilities
## Further Reading
- [What is CONTROL?](https://docs.zequenze.com/books/control/page/what-is-control)
- [Architecture](https://docs.zequenze.com/books/control/page/architecture)
# What is CONTROL?
## Overview
**CONTROL** is a multivendor and multiprotocol Device Management Platform, also known as an ACS (Automated Configuration Server). It enables service providers to efficiently manage and support customer premises equipment (CPE) regardless of manufacturer or device model.
## Key Capabilities
CONTROL provides comprehensive device management functionalities designed for service provider operations:
- **Automated Device Onboarding** – Streamlined provisioning of new devices
- **Device Configuration Management** – Centralized configuration control and version management
- **Services Configuration** – Service-level parameter configuration and deployment
- **Configuration Scripting/Automation** – Script-based workflows for bulk operations
- **Device Diagnostics** – Real-time monitoring and diagnostic tools
- **CLI Access** – Command-line interface for advanced troubleshooting
- **Firmware Management** – Centralized firmware updates and version control
## Protocol Support
CONTROL communicates with managed devices through standard and secure southbound protocols, including:
- TR-069 (CWMP)
- MQTT
- SNMP
- CLI
- Additional vendor-specific protocols
This multi-protocol approach ensures unified device management across different brands and models through a single platform.
## User Interface
### Web-Based GUI
CONTROL features a comprehensive web-based graphical user interface for configuration, settings management, and troubleshooting. The interface supports role-based access control with differentiated privilege levels:
- **Read-only** – View configuration and status information
- **Read-write** – Modify device settings and configurations
- **Admin** – Full platform administration capabilities
### RESTful API
All configuration settings and management actions are accessible through a flexible RESTful API, enabling seamless integration with existing OSS/BSS platforms and custom automation workflows.
## Additional Resources
- [Architecture](https://docs.zequenze.com/books/control/page/architecture)
- [Specifications](https://docs.zequenze.com/books/control/page/specifications)
# Basic Configuration
# Knowledge Basic
## Logging into the Platform
The first step to access CONTROL is to receive an invitation email. This email contains a link that allows you to set your password for future access to the platform.
After receiving the invitation, click the link to set up your password. You will see a page similar to this example:
Once the process is complete, you will be redirected to the CONTROL platform:
## Understanding the CONTROL Interface
Now that you're logged into the CONTROL platform, let's explore the available options:
### Main Dashboard
In the center of the screen, you'll find a series of customizable reports in the **Main Dashboard**. These reports include:
- **Devices UP** - Shows currently active devices
- **Devices Per Status** - Displays device status distribution
- **Devices Logs** - Provides access to device log information
All of these reports are customizable if needed to suit your monitoring requirements.
### Navigation Menu
The left-side menu provides access to key platform sections:
1. **Inventory** - View devices, create configurations, and add parameters for each profile. In this section you can view the devices, create configurations, and add the parameters you need for each profile.
2. **Firmware** - Upload different firmware versions for upgrades or downgrades, and customize firmware update workflows. You can upload different versions of firmware for upgrade or downgrade, and customize the workflow for firmware upgrades as needed.
3. **Locations** - Create and manage physical locations using:
- Geo-localization with coordinates
- Custom labels to identify device groups
- Organization by OLT or DOCSIS CMTS connections
This section is very useful when you need to create different physical locations, geo-localization with coordinates, or custom labels to identify groups of devices connected to the same OLT or DOCSIS CMTS.
4. **User Log** - View all transactions and changes made within the platform. This section allows you to view all transactions or changes that have been made in the platform.
## Enabling Expert Mode
To access advanced features, you need to activate **Expert Mode**:
1. Check the **Expert mode** checkbox
2. Refresh the webpage by pressing **F5** or using your browser's refresh button
This activates additional options and advanced functionality within the CONTROL platform.
---
This completes the basic overview of the CONTROL platform. The next step is to create a Profile.
# Profile
## Creating a New Profile
Before creating a profile, it's important to understand its purpose. Profiles are where you configure key device settings such as:
- WAN interface configurations
- Custom WiFi network names (e.g., "ISP-Provider-2.4GHz" for 2.4GHz networks)
- 5.0GHz network configurations
- Other device-specific parameters
This is where the magic happens when you want to create new interfaces or set up custom configurations for your devices.
### Steps to Create a Profile
1. Navigate to **Inventory** in the CONTROL portal
2. Click on **Profile**
3. Click the **Add** button
---
### Configuring Profile Settings
You will see the profile creation page with the following fields:
#### Required Fields
1. **Name**
Enter a descriptive identifier for this profile. Best practice is to use the format: **"Vendor Model [Base]"**
Example: *"Nokia G-1425G-B [Base]"*
2. **Short-name / code**
Provide an abbreviated version of the profile name.
Example: *"Nokia-G-1425G"*
3. **Device class**
Select the appropriate device type from the following options:
- eMTA
- ONT
- DSL CPE
- Fixed Wireless Access CPE
- LTE CPE
- LTE MiFI
- STB
- WiFi eXtender
- WiFi Mesh AP
- WiFi Mesh (master)
- WiFi Mesh (slave)
- WiFi AP
- VoIP phone
- VoIP ATA
- LAN Switch
- Router
- Network appliance
- SONDA probe
- Transport gateway
- Other
4. **Organization**
If applicable, select which organization this profile belongs to.
#### Automatic Device Onboarding Settings
5. **Automatic device onboarding**
Enable this option to allow the CONTROL platform to automatically assign new credentials to devices. This ensures each device receives unique username and password combinations for enhanced security.
6. **User**
Enter the default username that matches the factory credentials on the device. This username must match what is configured on devices connecting to the CONTROL platform.
7. **Password**
Enter the default password that matches the factory credentials on the device. Both username and password must match for automatic profile assignment to work correctly.
8. **Overwrite existing devices**
Enable this option to allow devices that have been reset to factory credentials to reconnect to the CONTROL platform. This prevents connection rejection when a device already exists in the system and ensures that devices returning to factory settings can still connect without issues.
---
### Example Configuration
Below is an example of a completed profile configuration:
Once all fields are configured, click **"Save and close"** to create the profile.
---
## Profile Created
After successfully creating the profile, you can:
1. **Filter by Name** - Use the search filter to locate your profile by its name
2. **View the Profile** - The newly created profile will appear in the profile list
---
## Next Steps
The next step is to configure a device with the credentials and URL settings.
# Add Device to CONTROL
## Overview
This guide walks you through configuring a device to connect to the CONTROL platform. In this example, we'll configure an ONT from an oriental vendor with TR069 credentials created in a previous step.
## Prerequisites
Before beginning, ensure you have:
- Valid TR069 credentials created in CONTROL (see the [Profile chapter](https://docs.zequenze.com/books/control/page/profile))
- Network access from the device to the CONTROL platform URL
- Administrative access to your device
## Step 1: Access Device Configuration
Log in to your device's web interface.
## Step 2: Review Existing WAN Interfaces
After logging in, verify the existing WAN interfaces. This device has a pre-configured interface, but we'll examine the configuration and create a new one for demonstration purposes.
To navigate to the WAN interface configuration:
1. Click **"Internet"**
2. Click **"WAN"**
3. Click **"WAN"** again
4. In the displayed list, you'll see existing WAN interfaces (in this example, an interface named **"Management"**)
## Step 3: Create a New WAN Interface
Create a new WAN interface for TR069 connectivity:
1. Change the connection type from **"PPP"** to **"IP"**:
## Step 4: Configure Service List Options
Next, configure the **"Service List"** type. Change it from *Internet* to one that includes *TR069*.
### Understanding Service List Combinations
You may encounter several service list options in this device and possibly others. Here's what each means:
1. **TR069** — This option is alone, it is because there would be a separate WAN interface solely to manage the device through the CONTROL platform, which would be ideal but is often not possible due to network design issues that already exist.
2. **INTERNET_TR069** — With this option we will be sharing the Internet service for the user or client along with the administration of the device. **Not recommended** since when the service is suspended, access to the CONTROL platform is sometimes lost and communication would be limited until the service is reactivated.
3. **VOIP_TR069** — Sharing the TR069 service with VoIP may possibly be a good option since it would not affect the existing Internet services you already have.
4. **INTERNET_VoIP_TR069** — This last option would be to manage all the services in a single VLAN or WAN interface, which is rare for clients with this configuration, but it works.
## Step 5: Configure WAN Interface Parameters
Configure your WAN interface with the following settings:
1. **Connection name** — Enter a descriptive name to identify this connection
2. **Service List** — Select **TR069**
3. **IP Version** — Select the appropriate IP version (IPv4 or IPv6)
4. **VLAN ID** — Enter the VLAN ID for this service
**Important:** Please make the necessary changes in your network configuration to ensure the device can reach the CONTROL platform URL through this WAN interface with the TR069 service enabled.
After clicking **Apply**, verify your configuration:
## Step 6: Verify Network Connectivity
Confirm that the WAN interface has a valid IP address and can reach the CONTROL platform:
### Optional: Test CONTROL Platform Connectivity
This step is optional, but you can confirm with a ping that the CONTROL URL can be reached using the device's built-in ping utility:
1. Navigate to **"Management & Diagnosis"**
2. Click **"Diagnosis"**
3. Under **"Egress"**, select your TR069 interface (e.g., **"Management"**)
4. Enter the CONTROL platform domain
5. Start the ping test
6. Confirm that all packets successfully reach CONTROL
## Step 7: Configure TR069 Settings
Navigate to the TR069 Management section:
1. Click **"Management & Diagnosis"**
2. Click **"TR069 Management"**
## Step 8: Connect Device to CONTROL
Configure the TR069 parameters to establish connection with CONTROL:
Configure the following parameters:
1. **WAN Connection** — Select the interface created for TR069 (e.g., *Management*)
2. **ACS URL** — Enter: `https://control.zequenze.com/cwmp/`
**Note:** Please confirm the correct URL with Zequenze staff before proceeding.
3. **Username** — Enter the username created in the [Profile chapter](https://docs.zequenze.com/books/control/page/profile)
4. **Password** — Enter the password created in the [Profile chapter](https://docs.zequenze.com/books/control/page/profile)
5. **Periodic Inform** — Enable this option to allow the device to report periodically to CONTROL
6. **Periodic Inform Interval** — For initial setup, set this to **180 seconds**
## Step 9: Apply Configuration
Review your final configuration:
Click the **Apply** button to save your changes.
## Next Steps
Device configuration is now complete. The device should appear in the CONTROL platform within the configured periodic inform interval. You can now proceed to manage and monitor your device through CONTROL.
# Discovering the parameters
## Confirm Device Connection
At this point, you should have a device successfully connected to the CONTROL platform, similar to the example shown below:
> **Note:** If the device list is empty, perform the following troubleshooting steps locally on the device:
>
> - **Try HTTP instead of HTTPS:** Change the CONTROL URL from `https://control.zequenze.com/cwmp/` to `http://control.zequenze.com/cwmp/`. If this works, the device does not support HTTPS or encrypted communication.
>
> - **Use IP address instead of domain:** Replace the domain `control.zequenze.com` with the CONTROL platform's IP address (e.g., `https://35.171.123.57/cwmp/` or `http://35.171.123.57/cwmp/`). If this works, verify the device's DNS configuration.
>
> - **Verify TR069 service:** Validate that the WAN interface has the TR069 service enabled to achieve connectivity to the CONTROL platform.
### Understanding the Interface
The screenshot above displays the following elements:
1. **Inventory** — Located on the left sidebar, this section contains devices, profiles, and other resources.
2. **Devices** — Displays the list of connected devices, showing their status as online or offline (with reasons for offline status).
3. **General** — The default section view when accessing a device.
4. **Name** — Automatically assigned by CONTROL as a unique identifier using the ONT's OUI-FSAN or serial number.
5. **Status** — Shows whether the device is UP or DOWN. Devices have a configured "Periodic Inform Interval" (e.g., 180 seconds). If the device fails to report within this interval, its status changes to DOWN.
6. **Profile** — Indicates which profile the device is assigned to.
7. **Serial** — Displays the serial number or FSAN reported by the device.
8. **SW Version** — Shows the current software version running on the device.
## Enable Parameter Discovery
To discover all available parameters from a device on the CONTROL platform, follow these steps:
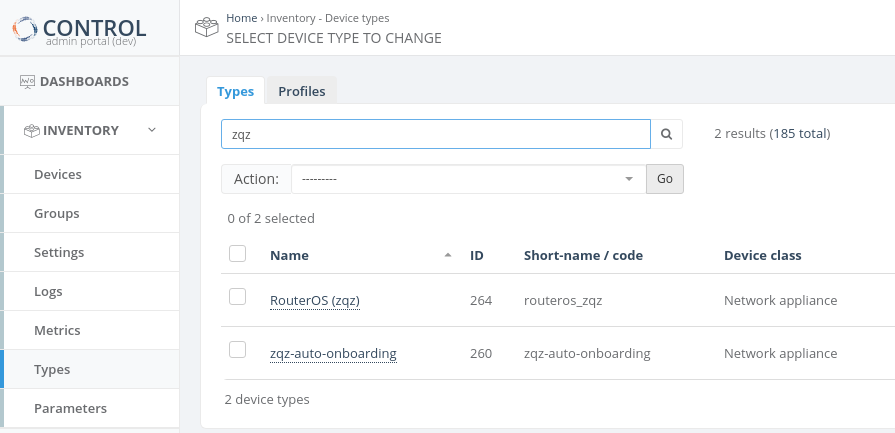
### Step 1: Navigate to Profiles
1. Click **Inventory** in the left sidebar.
2. Select **Profiles** from the menu.
3. (Optional) Use the filter to search for a specific profile name and press Enter.
4. Check the checkbox next to the desired profile to reveal additional options.
Once you check the checkbox:
1. The checkbox is marked and selected.
2. A new **"Action"** button appears.
### Step 2: Toggle Discovery
1. Click the **"Action"** button.
2. Select **"Toggle Discovery"** from the dropdown menu.
3. A green gear icon will appear, confirming that the discovery process has started.
The CONTROL platform will now wait for the device to connect and retrieve all available parameters.
### Step 3: Monitor Discovery Progress
The green gear icon indicates that the platform is waiting to obtain all parameters from the device. Refresh the webpage to check when the gear icon disappears, signaling that discovery is complete.
## View Discovered Parameters
Once discovery is complete, you can view all discovered parameters.
### Access the Profile
Click on the profile name to open its details:
### Locate System Groups
Inside the profile, scroll down to the bottom of the page to find the **System groups** section:
This section contains:
1. **System groups** — Where discovered parameters are stored.
2. **Group** — The name of the parameter group. For discovered parameters, this is typically the profile name followed by "Discovered".
3. **Move** — A button that displays the parameters and their count.
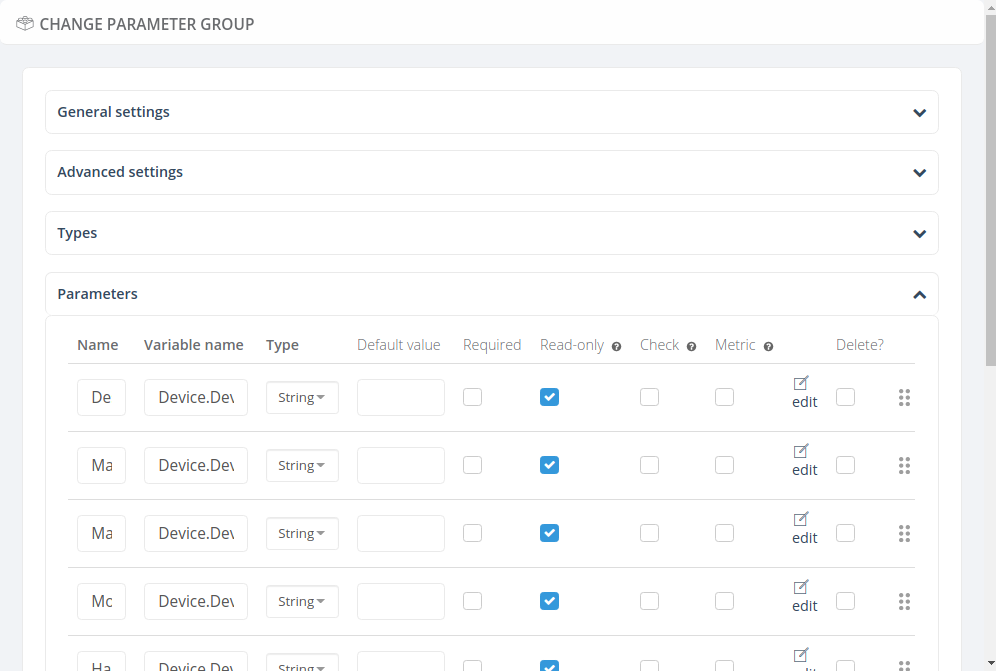
### View Parameter Details
Click the **"Move"** button to open the parameter viewer:
This window displays:
1. **Variable name** — The name of each discovered parameter.
2. **Type** — The parameter data type (e.g., string, integer, date, etc.).
3. **Read-only** — Indicates whether the parameter is read-only or writable.
4. **Discovered value** — The value discovered from the example device.
5. **Values** — A table containing all parameter information.
6. **Pages** — Navigation controls for browsing multiple pages of parameters.
7. **Quantity** — The total number of parameters available for this device with its current firmware or software version.
> **Reference:** For detailed information about parameters, consult the standard documentation for [TR-098](https://cwmp-data-models.broadband-forum.org/tr-098-1-8-0.html) or [TR-181](https://cwmp-data-models.broadband-forum.org/tr-181-2-18-0-cwmp.html).
## Next Steps
You can now export all discovered parameters to Excel or other formats for local analysis. This process will be covered in the next section.
# Export the parameters
## Overview
This guide explains how to locate, filter, and export parameter groups from the CONTROL portal. You'll learn to navigate to the Parameters section, apply filters to find specific groups, and export the data in your preferred format.
---
## Navigate to the Parameters Section
Begin by accessing the Parameters area within the Inventory module.
[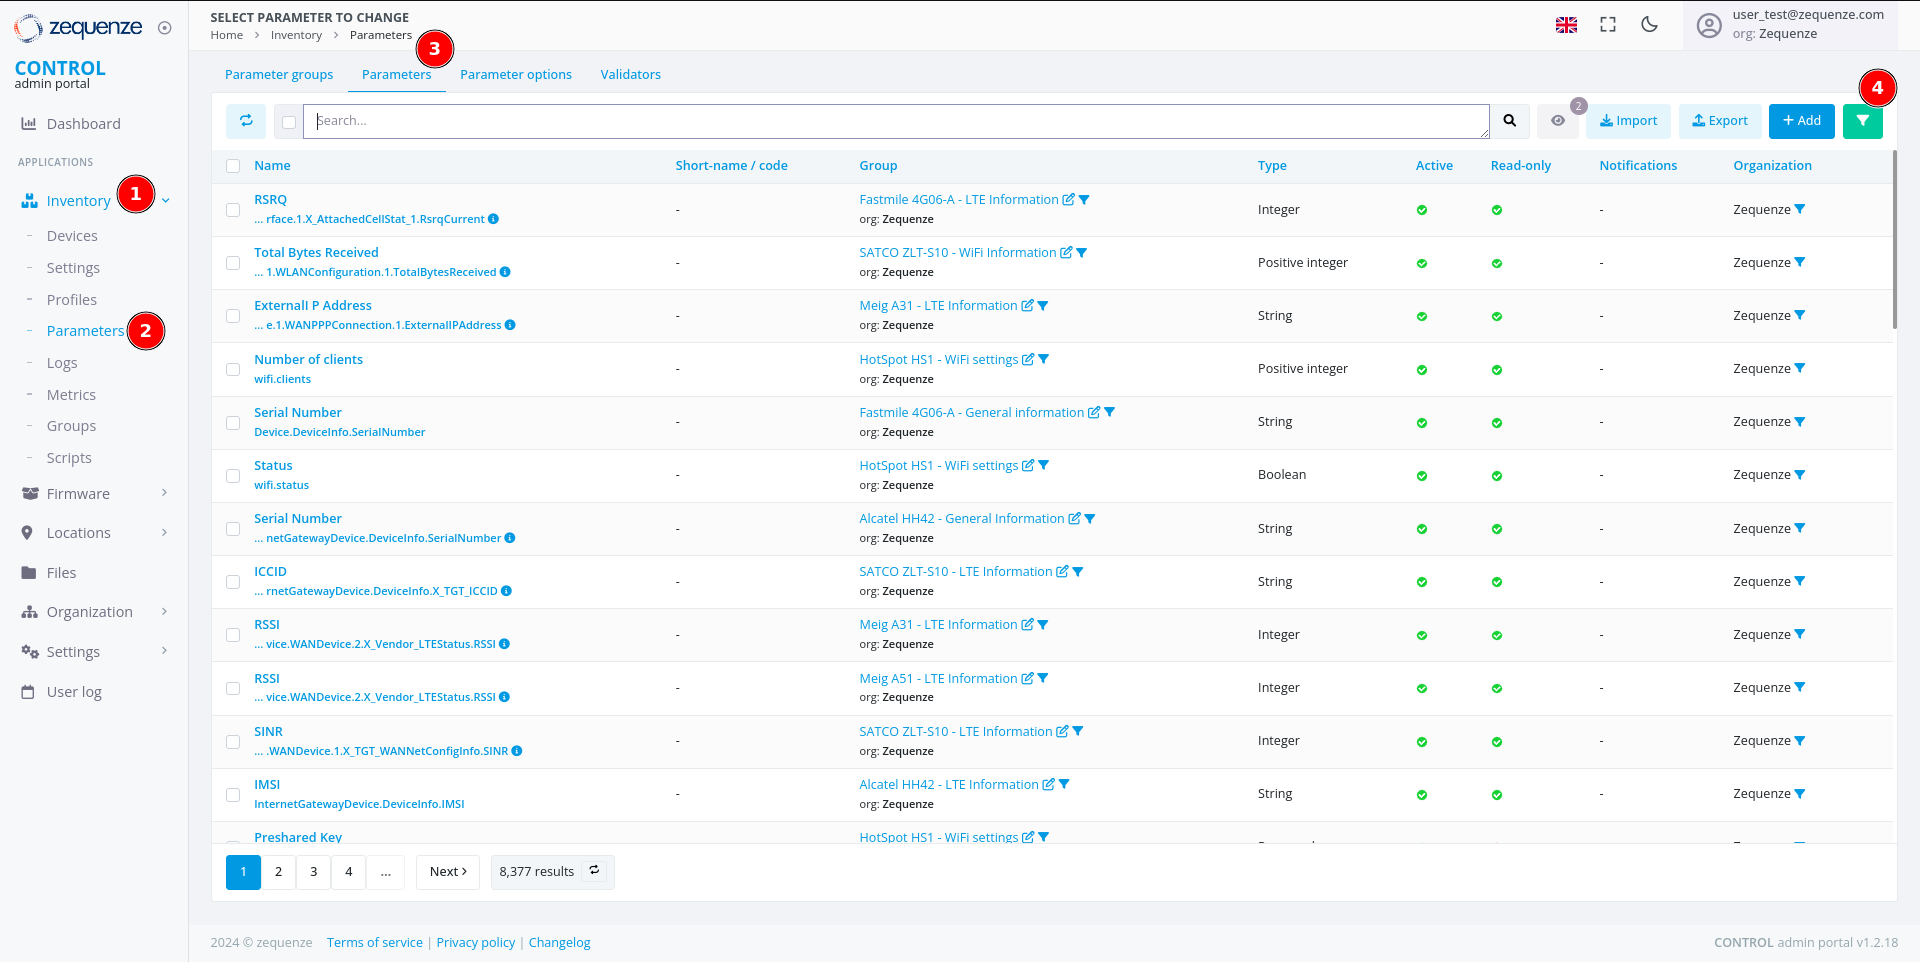](https://docs.zequenze.com/uploads/images/gallery/2024-08/vCmPlY55Bib7hJ7E-image.png)
1. Click on **Inventory**
2. Click on **Parameters**
3. Click on **Parameters** again
4. Activate the filter by clicking the **green funnel icon**
---
## Filter Parameters by Group
Once the filter panel is open, you can search for specific parameter groups.
[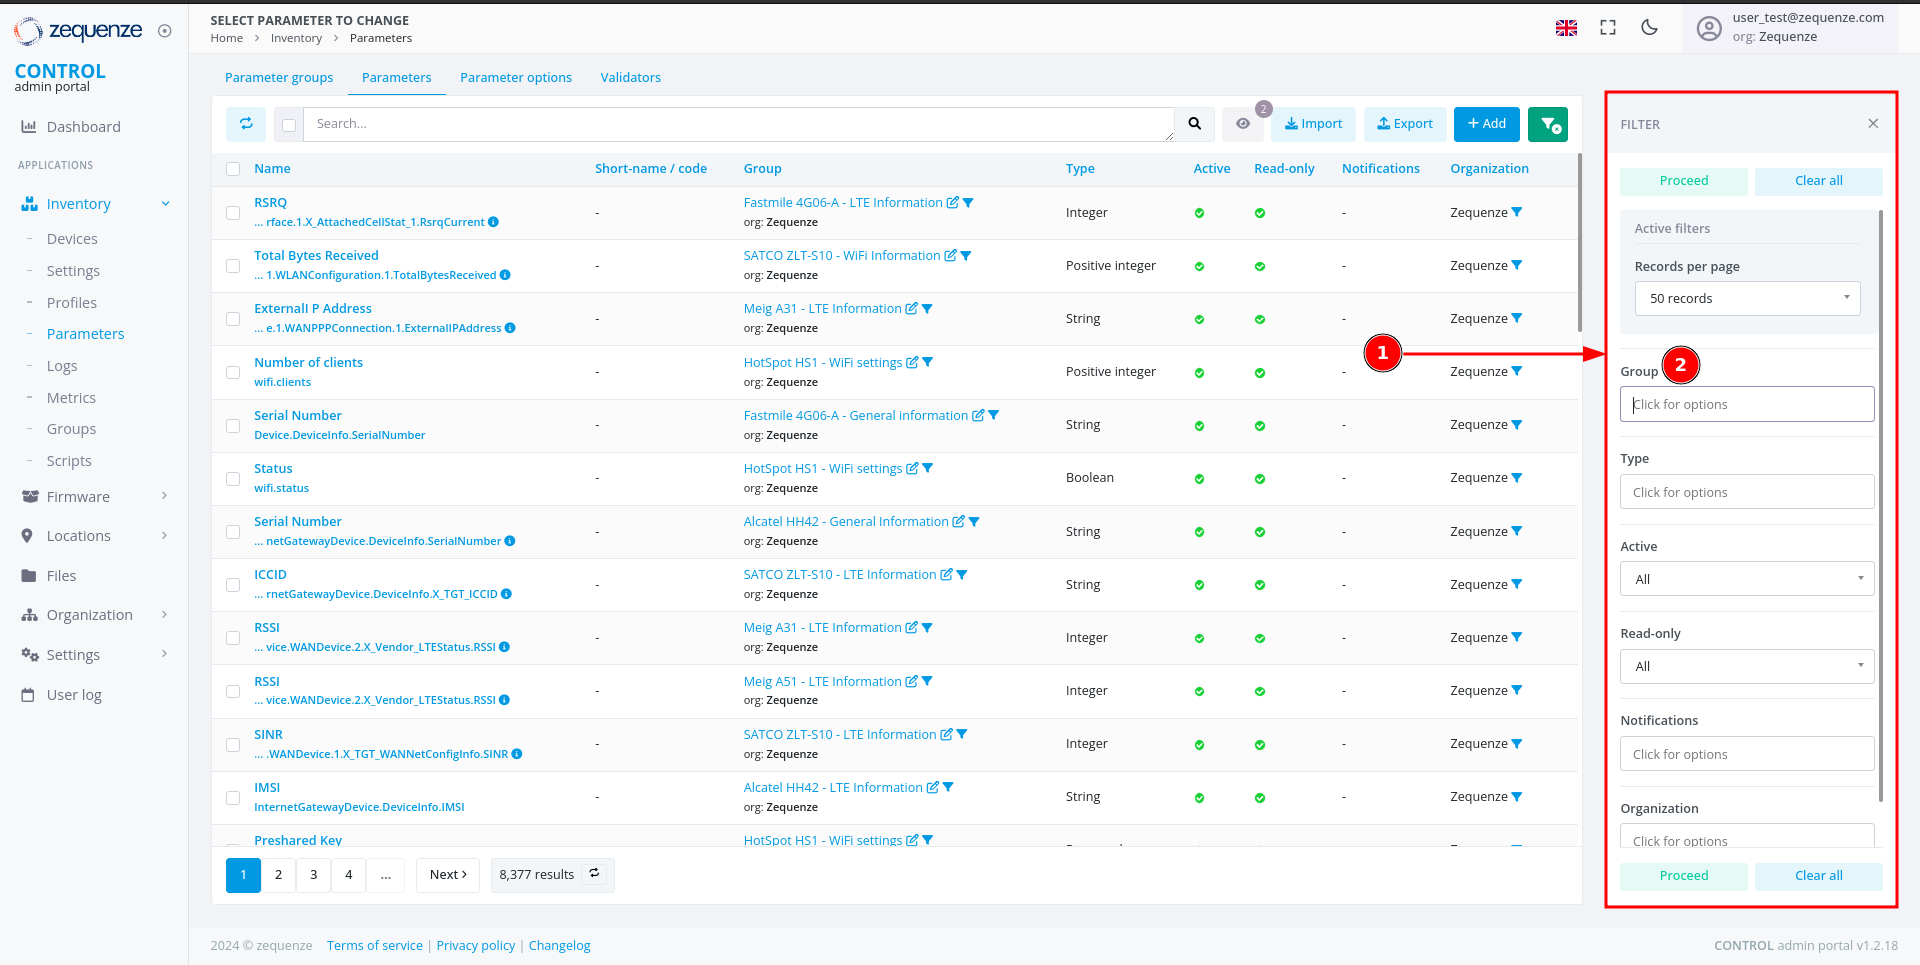](https://docs.zequenze.com/uploads/images/gallery/2024-08/toGhtf11sQI9qsl9-image.png)
1. The filter panel displays available filter options
2. Locate the **Group** field
### Search for Your Group
[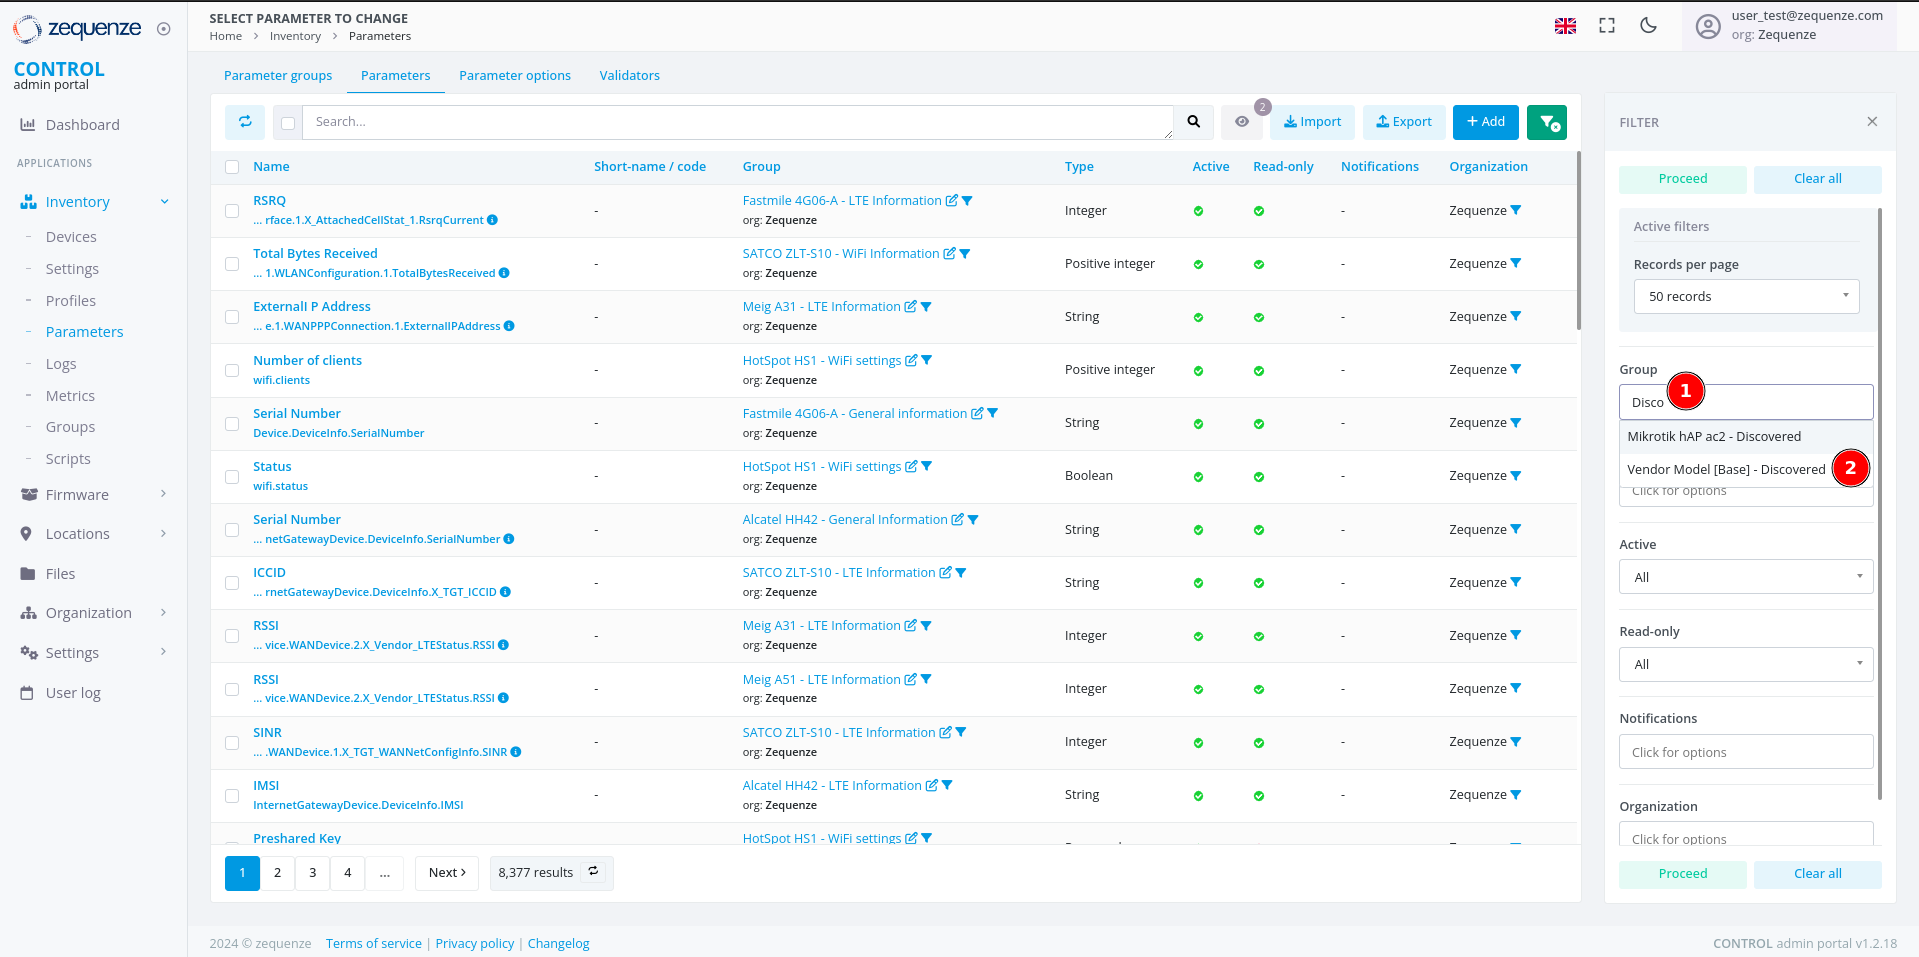](https://docs.zequenze.com/uploads/images/gallery/2024-08/OHrr7XF6n5tbCl8F-image.png)
1. In the **Group** field, enter a search term (e.g., type *"Disco"* to find all groups containing the word *"Discovered"*)
2. Select your desired group from the results (e.g., **"Vendor Model [Base] - Discovered"**)
3. Click the **Proceed** button to apply the filter
---
## Verify Filtered Results
After applying the filter, confirm that the correct parameters are displayed.
[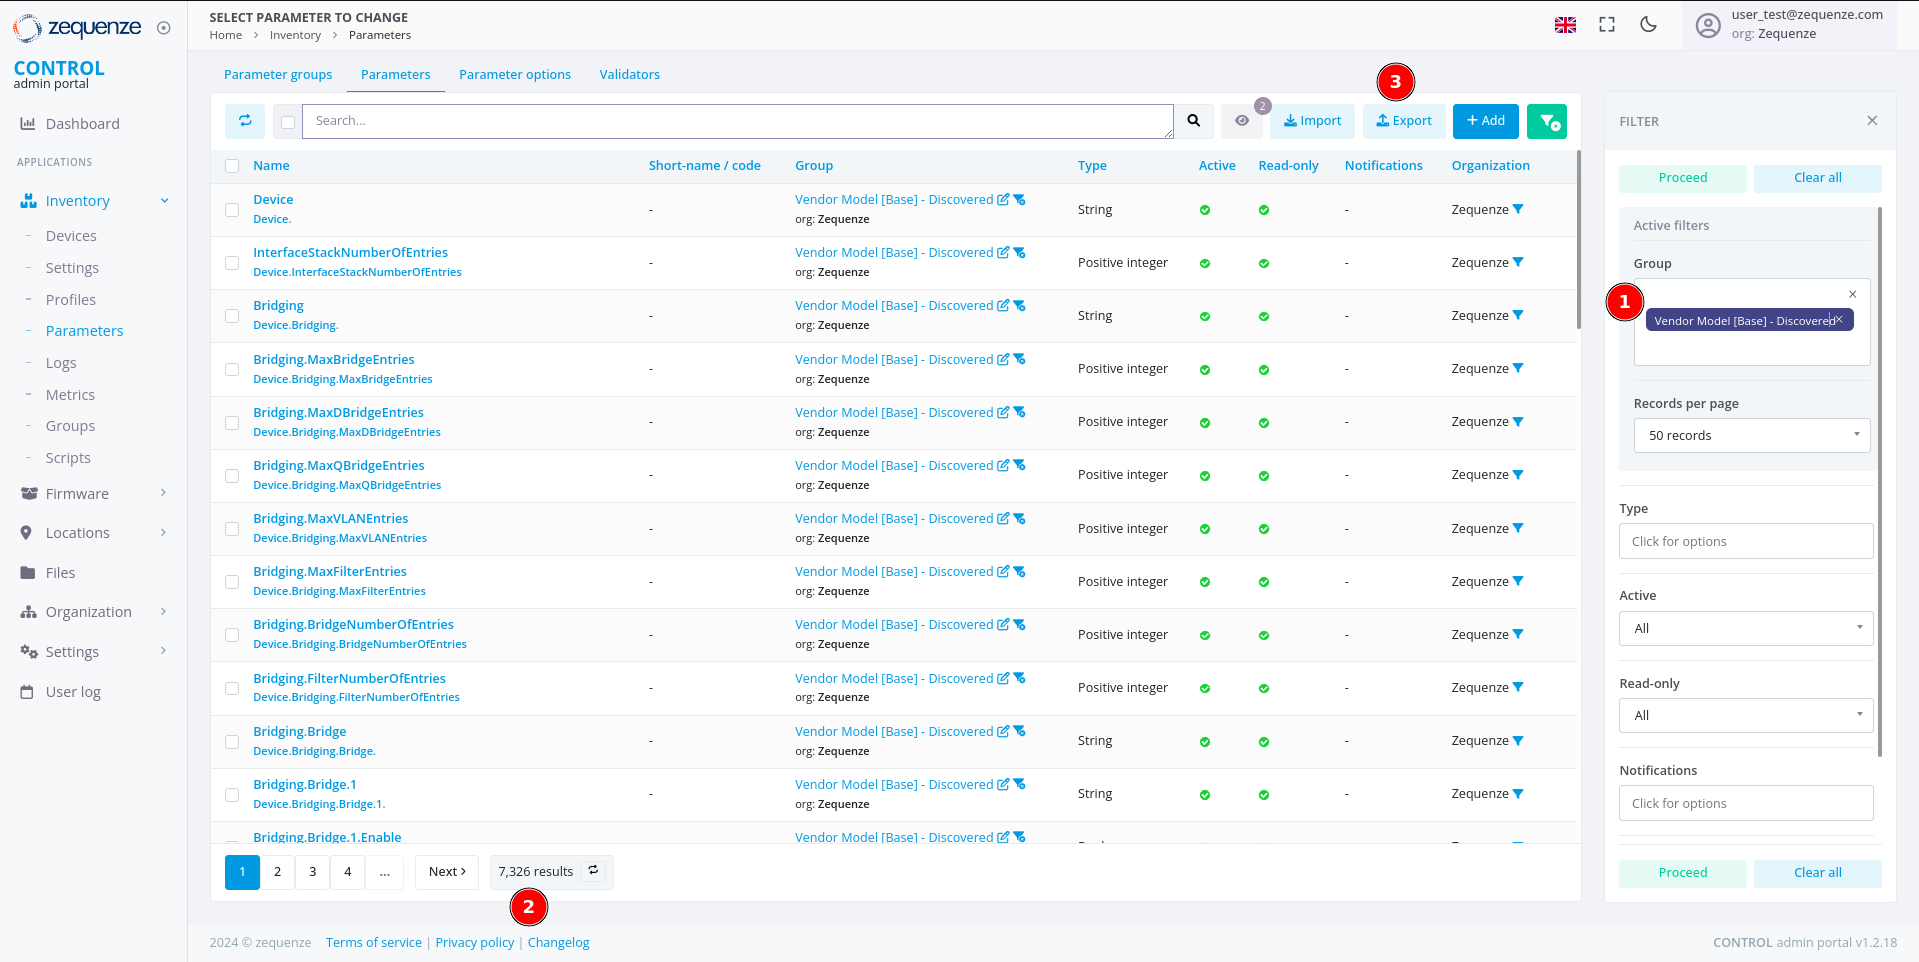](https://docs.zequenze.com/uploads/images/gallery/2024-08/uMZdfdQEezBuJMS4-image.png)
1. Review the applied Group filter
2. Verify that the parameter count matches the expected number from your Profile (you can confirm the quantity by comparing it with the number of parameters Discovered in the Profile)
3. Proceed to export the parameters
---
## Export the Parameters
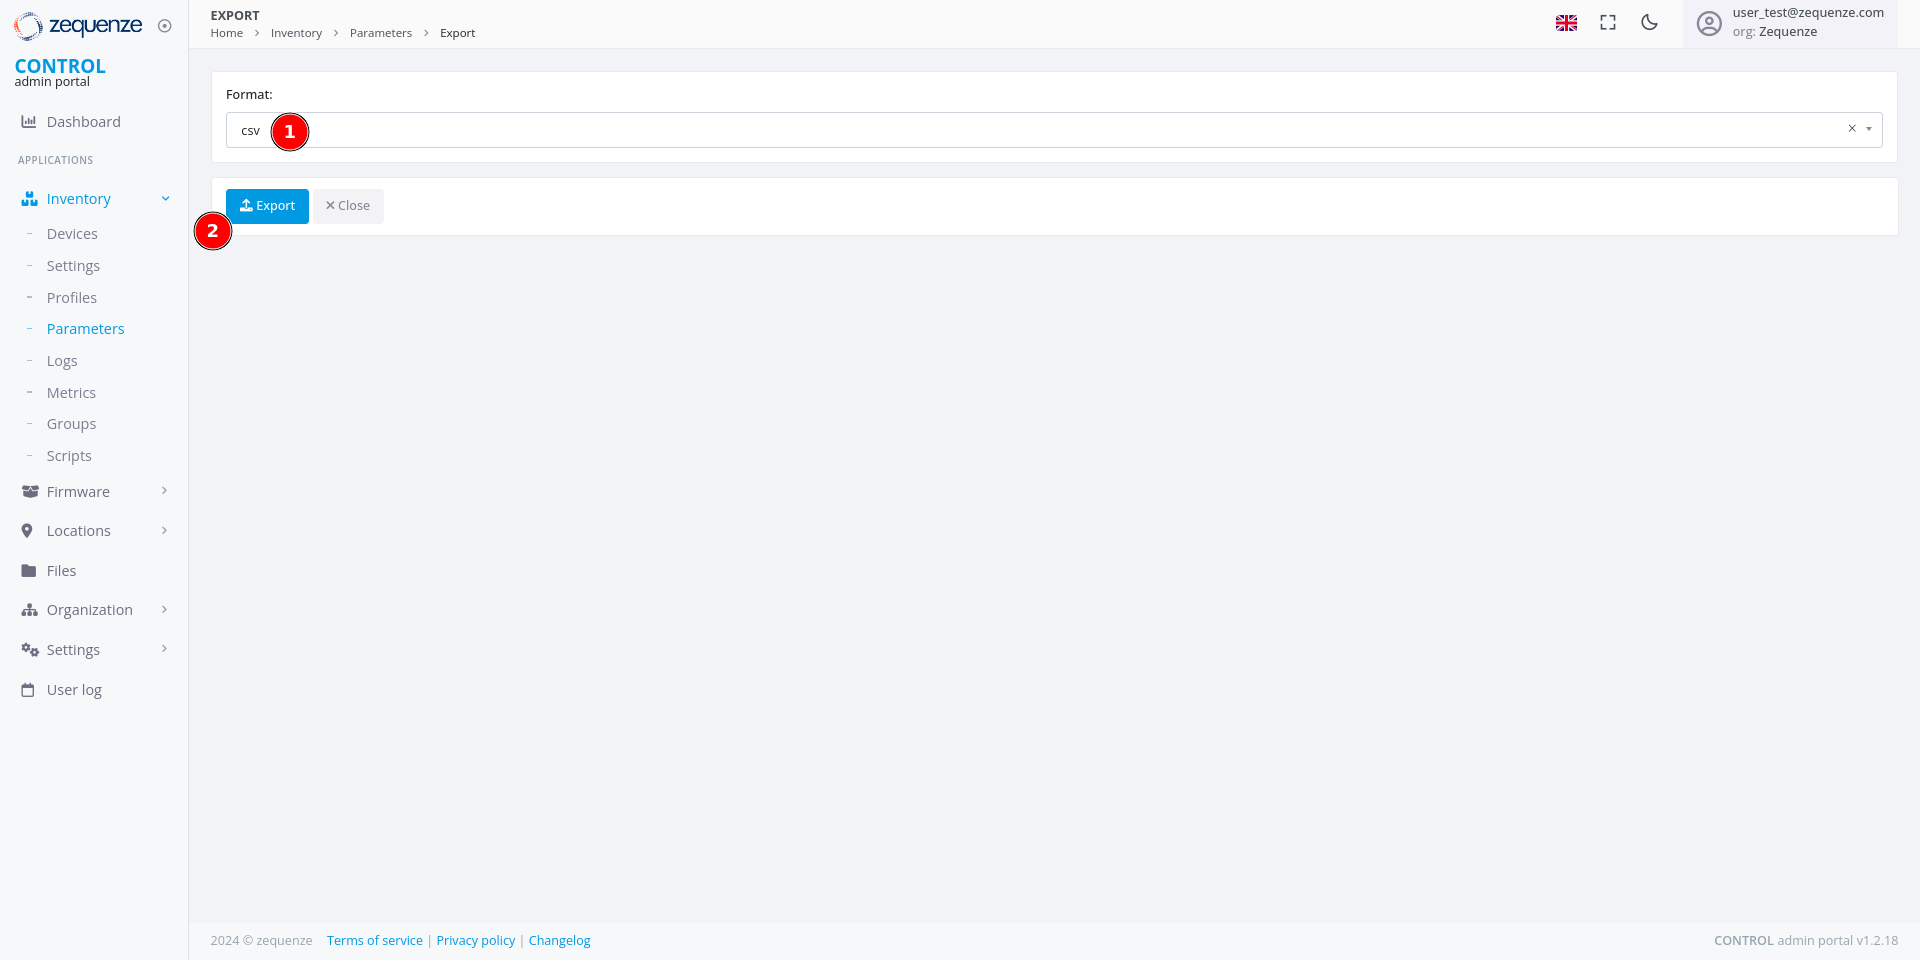
### Initiate the Export
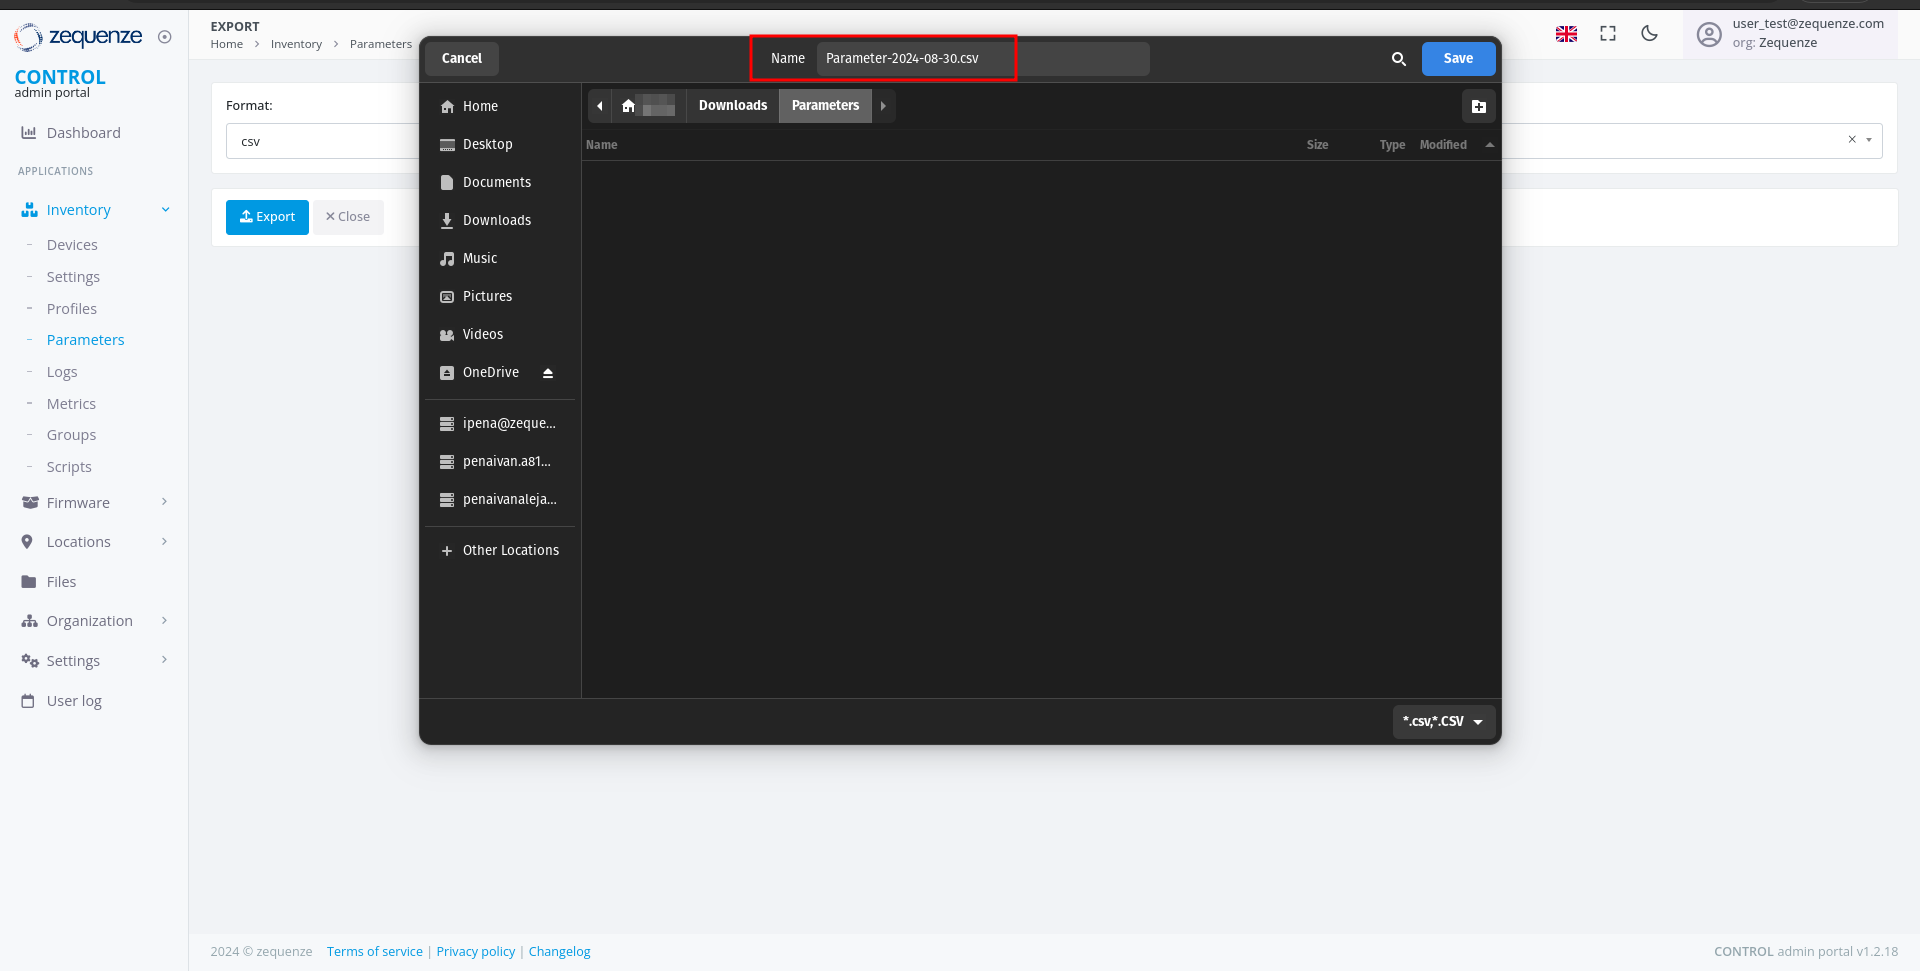
Click the **Export** button to open the export dialog.
[](https://docs.zequenze.com/uploads/images/gallery/2024-08/dbVMA4cDCxPZk9If-image.png)
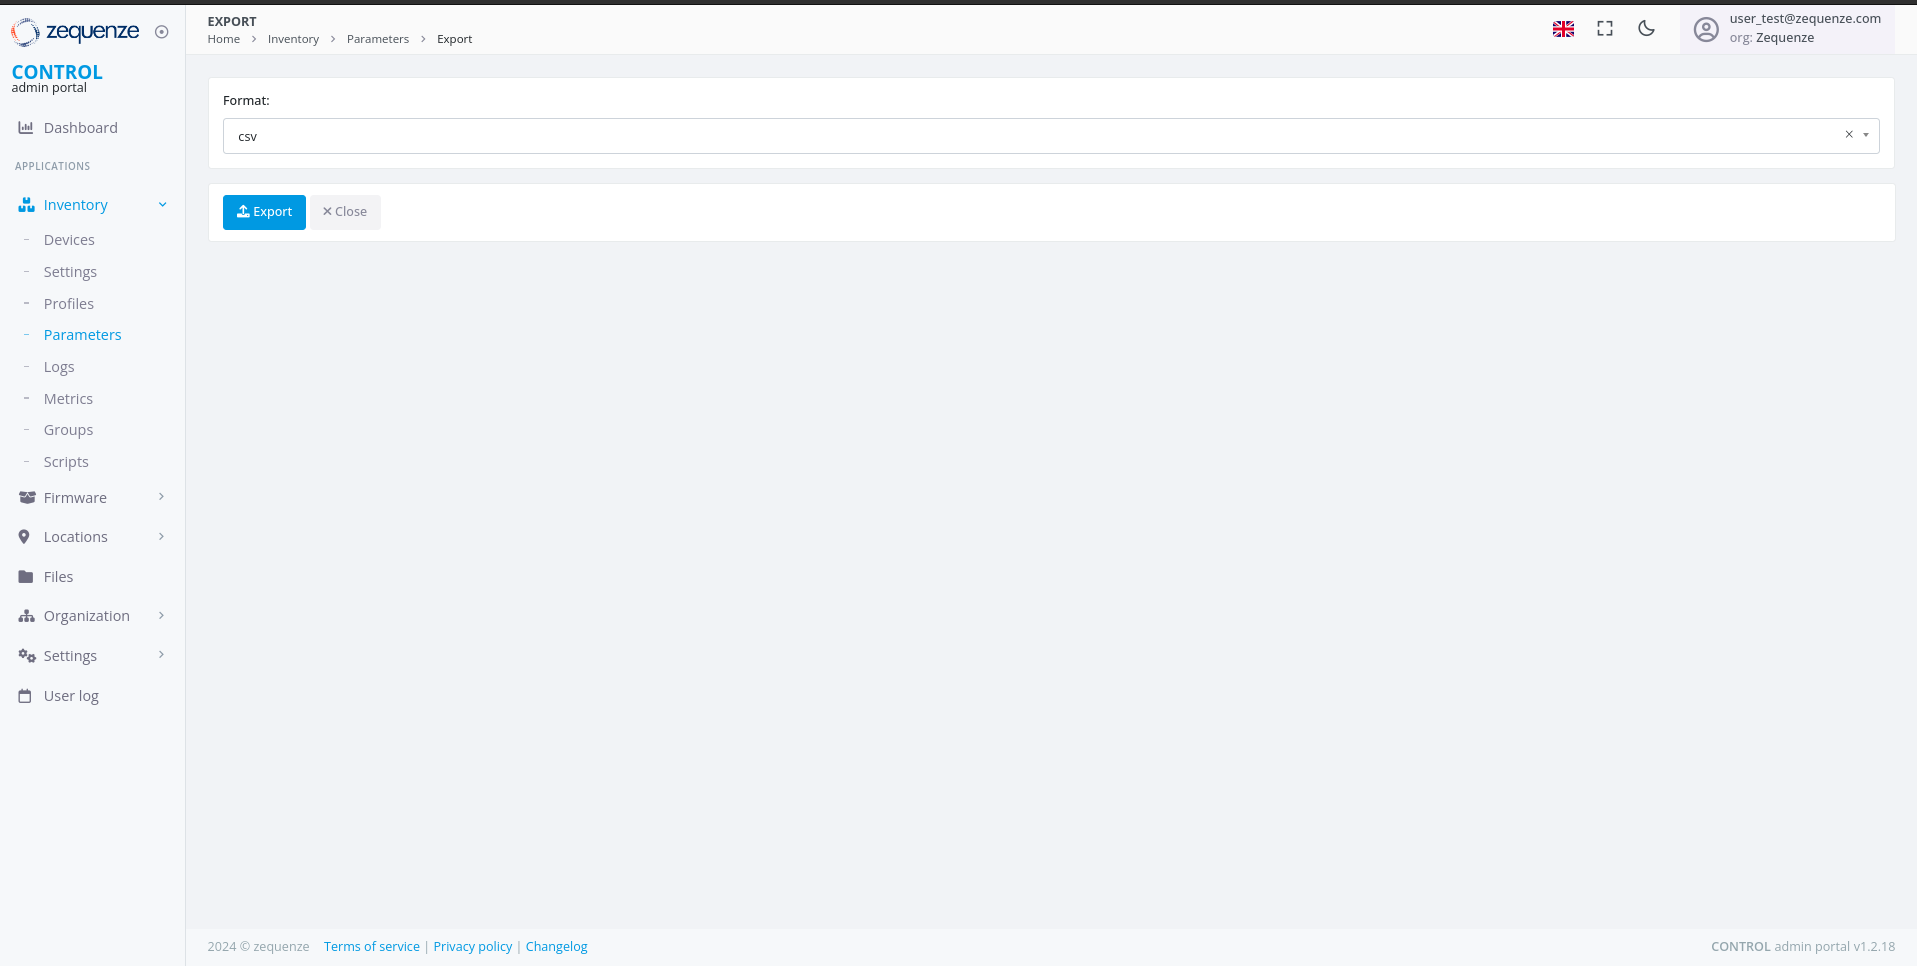
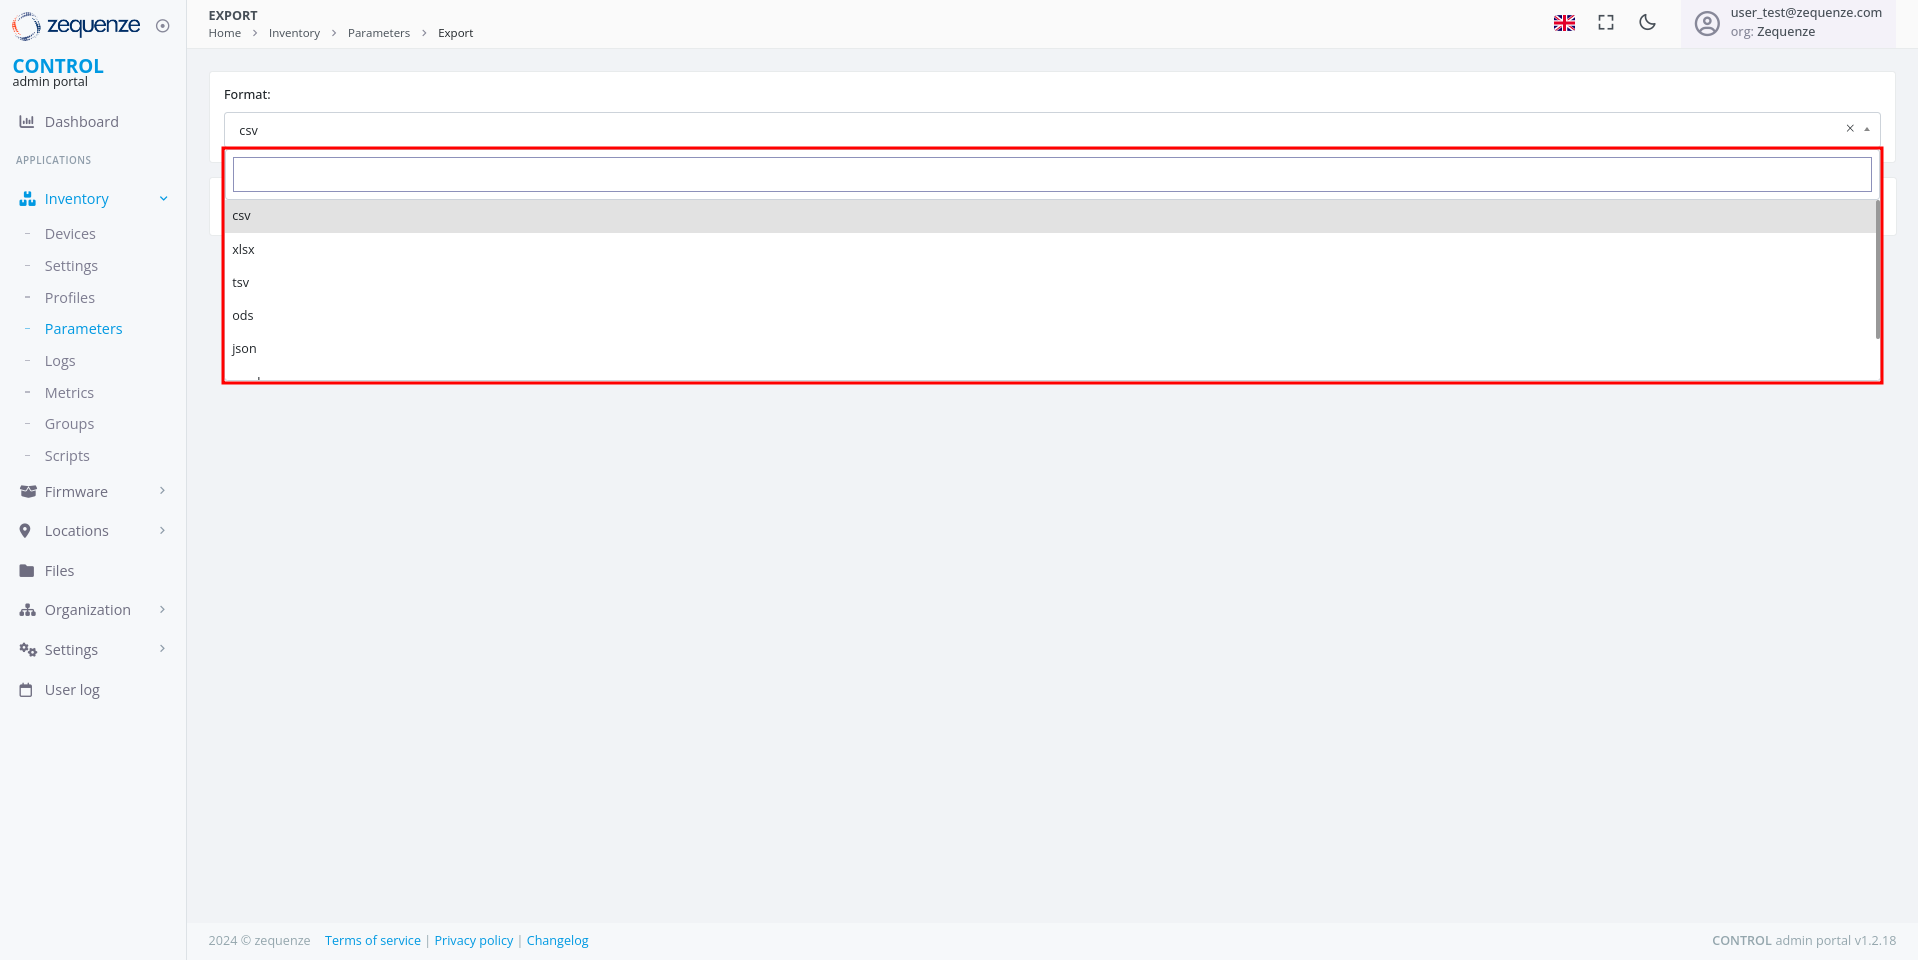
### Select Export Format
Choose your preferred file format from the available options.
[](https://docs.zequenze.com/uploads/images/gallery/2024-08/rEfW5Ruensoz7Atn-image.png)
[](https://docs.zequenze.com/uploads/images/gallery/2024-08/O2xaE6N5ormqDOSv-image.png)
1. Select your desired format (e.g., **CSV**)
2. Click the **Export** button to start the export process
---
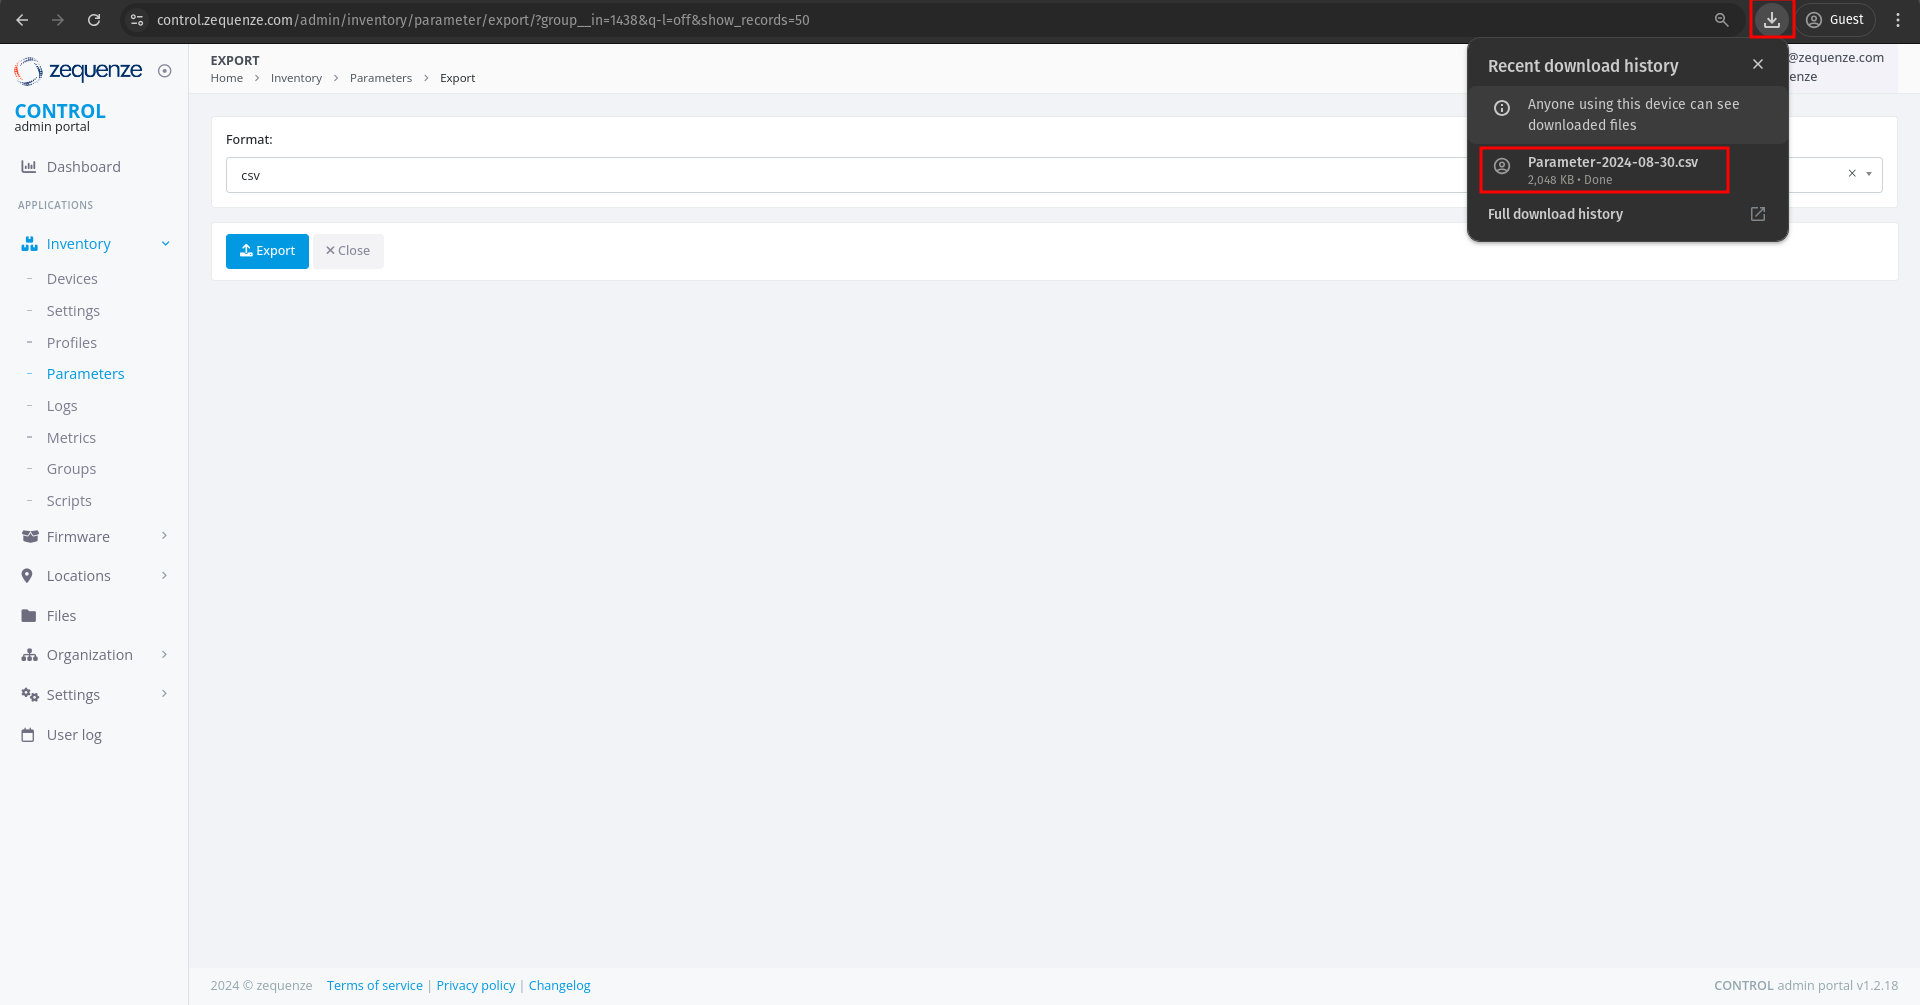
## Download the Exported File
### Monitor Export Progress
After initiating the export, a progress indicator appears at the top of your browser showing that the report is being generated.
[](https://docs.zequenze.com/uploads/images/gallery/2024-08/iOwGL8BWiW8FTxSP-image.png)
### Download Complete
When the export is ready, a download notification will appear.
[](https://docs.zequenze.com/uploads/images/gallery/2024-08/MlhHglIVaVDFrZgQ-image.png)
### Open the File
You can now open the exported CSV file to view your parameters.
[](https://docs.zequenze.com/uploads/images/gallery/2024-08/s0yf73kHf4Rnfrcu-image.png)
# Formatting the Parameters
This guide demonstrates how to format and organize parameters exported from CONTROL using a spreadsheet application. This example uses LibreOffice Calc, but you can apply the same process in Microsoft Excel or similar tools.
## Opening the Exported File
When you open the exported parameters file in LibreOffice, a **Text Import** dialog will appear:
For most cases, you can simply click **OK** to accept the default import settings. If you're using Excel, you may need to use the "Import Data" function to load the file properly.
## Understanding the Parameter Sheet
After importing, you'll see a spreadsheet with many columns and parameters:
Don't be intimidated by the number of parameters—once you understand the structure, working with them becomes straightforward.
## Extracting Key Columns
For this workflow, you'll need to create a new sheet and copy only four specific columns from the original data.
### Step 1: Create a New Sheet
Create a second sheet (Sheet2) in your workbook to organize the filtered data:
1. **Sheet2** - Your new working sheet
2. **Sheet1** - The original sheet with all parameters
### Step 2: Identify the Required Columns
From the original sheet, locate and copy the following four columns:
1. **Column C**
2. **Column H**
3. **Column R**
4. **Column AY**
### Step 3: Paste into Sheet2
Copy these four columns and paste them into Sheet2:
## Understanding the Column Structure
Your new sheet now contains four essential columns:
1. **variable_name** - Lists all parameters available for devices using this software version
2. **type** - Indicates the data type of each parameter (string, integer, boolean, etc.) and tells us what kind of parameter it is
3. **read_only** - Shows whether the parameter is read-only or can be modified. Some parameters are only read-only and you can't write to them
4. **discovered_value** - Displays the current value of each parameter (for example, the name of one SSID for a WiFi 2.4GHz network)
## Sorting the Parameters
To make the parameters easier to work with, sort them alphabetically by the first column (variable_name):
**Note:** Make sure to include the header row when sorting so the column titles remain in place.
### Result
After sorting, your parameters will be organized alphabetically:
## Next Steps
With your parameters now organized and easy to navigate, you can begin creating configuration profiles by selecting the specific parameters that meet your requirements.
# First Parameters
## Group Parameters
Before adding parameters to CONTROL, we recommend organizing them into logical groups. This section demonstrates how to group device information parameters as an example.
### Step 1: Identify Parameters in Your Spreadsheet
Begin by locating the parameters you want to group. For this example, we'll group four device information parameters:
1. Locate the **Manufacturer** parameter
2. Locate the **ModelName** parameter
### Step 2: Copy Parameters to a New Sheet
When you mark or find the parameters you need, copy them to a separate sheet for easier organization:
### Step 3: Add Friendly Names
Add a new **"name"** column to create user-friendly labels for each parameter:
You can assign a short, descriptive name for each "variable_name" to establish a clear relationship between the technical parameter name and its display name.
---
## Add Parameters to a Profile
Now that you've organized your parameters, it's time to add them to your device profile in CONTROL.
### Step 1: Navigate to Parameter Groups Section
Return to the profile you created previously and scroll down to the bottom of the page:
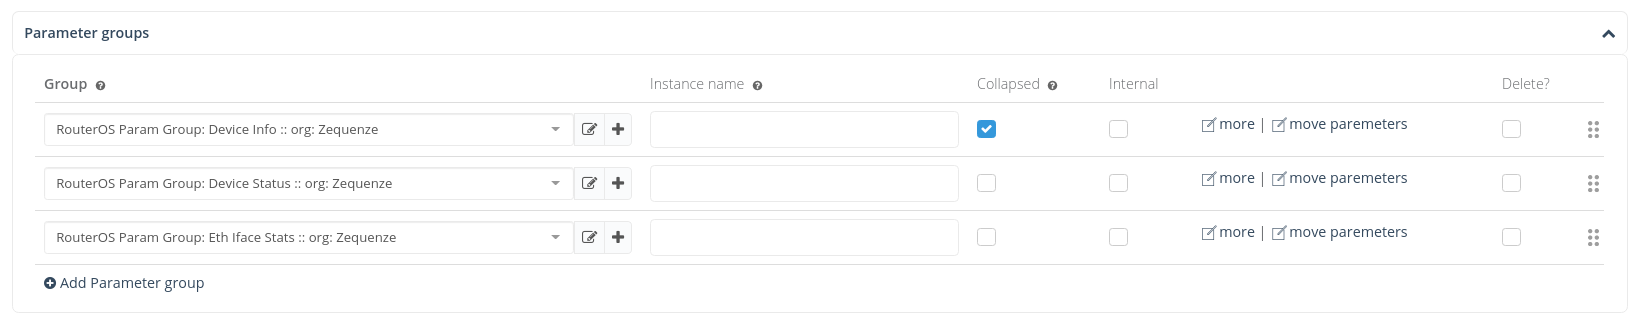
Locate the **"Parameter groups"** section:
1. **Parameter groups** - This section allows you to create and organize parameter groups
2. **Add** - Click this button to create a new parameter group
### Step 2: Create a New Parameter Group
After clicking **Add**, you'll see the following interface:
1. Click the **+** icon to open the parameter group configuration window
### Step 3: Configure the Parameter Group
A new window will open where you can configure your parameter group:
1. **Name** - Enter a descriptive name for this group (e.g., **"Model | Device Info"**)
2. **+ Add** - Click this button once for each parameter you want to add (in this example, we need 4 parameters)
### Step 4: Add Parameter Details
1. After entering the group name and adding 4 parameter slots, you're ready to fill in the parameter details
Now transfer the parameter information from your Excel or LibreOffice Calc spreadsheet into CONTROL:
As you can see, there's now a clear correspondence between your spreadsheet and the CONTROL interface. When you've finished entering all parameters, click **"Save and close"**.
### Step 5: Save the Parameter Group
You'll now see your newly created parameter group:
1. Click the **Save** button to save your changes to the profile
After saving, you'll see the organization name displayed in the parameter groups section:
You can repeat this process to add additional parameter groups or parameters as needed.
---
## View Parameters on a Device
Now that you've configured your parameter groups, let's verify that they appear correctly on the device page.
### Step 1: Navigate to the Device
1. Click on **Inventory**
2. Select **Devices**
3. You'll see your previously connected devices. In this screenshot, the device shows as **Down** because it was powered off for this demonstration
Click on the device name to view its details:
On the device page, you can now see:
1. The parameter group name you created
2. The first parameter: **"Model::Manufacturer"**
3. The second parameter: **"Model::Name"**
4. The third parameter: **"Model::SWVersion"**
5. The fourth parameter: **"Model::UpTime"**
6. The **Last connection** timestamp for this device in CONTROL
### Step 2: Wait for Parameter Values
It's normal for the parameter values to be empty at this stage. CONTROL will request and populate these values once the device connects to the platform.
After connecting the device:
The parameter values are automatically retrieved and displayed once the device establishes a connection to CONTROL.
You can now create additional parameter groups or add more parameters to existing groups as needed for your deployment.
# User Groups and Permissions Guide
## Overview
The CONTROL platform implements a **role-based access control (RBAC)** system to manage user permissions and data access. Access control is organized through **Groups** — collections of permissions that define which modules, actions, and data a user can access within the platform.
Users can be assigned to **multiple groups simultaneously**, and their effective permissions represent the **union** of all permissions from their assigned groups. This flexible approach allows organizations to create precise permission sets that match their operational roles and security requirements.
### Key Concepts
| Concept | Description |
|---------|-------------|
| **Group** | A named collection of permissions. Users automatically inherit all permissions from their assigned groups. |
| **Permission** | A specific action allowed on a specific resource (e.g., "Can view device", "Can change parameter"). |
| **Organization** | Users can only access data belonging to their organization and its sub-organizations. This organizational boundary is enforced independently of group permissions. |
| **Expert Mode** | An optional toggle that reveals advanced features and configuration options for experienced users. Requires assignment to the "Users: Expert mode" group. |
## Available Groups
The CONTROL platform provides standard groups organized by platform module and access level. These groups cover all core functionality areas:
| Group Name | Module | Access Level |
|-----------|--------|-------------|
| CONTROL account admins | CONTROL | Administration |
| CONTROL API Logs read-only | CONTROL | Read-only |
| CONTROL inventory admins | CONTROL | Administration |
| CONTROL inventory basic users | CONTROL | Basic |
| CONTROL inventory read-only basic users | CONTROL | Read-only (basic) |
| CONTROL inventory read-only users | CONTROL | Read-only |
| CONTROL inventory scripting | CONTROL | Specialized |
| CONTROL inventory users | CONTROL | Standard |
| CONTROL portal admins | CONTROL | Administration |
| Link admin users | Link | Administration |
| Link read-only users | Link | Read-only |
| SecureDNS admins | SecureDNS | Administration |
| SecureDNS reports | SecureDNS | Read-only |
| SONDA admins | SONDA | Administration |
| SONDA reports | SONDA | Read-only |
| Users | General | Basic |
| Users: Expert mode | General | Specialized |
## Detailed Group Descriptions
### CONTROL Account Administration
#### CONTROL account admins
**Description:** CONTROL account administration access.
**Purpose:** Grants administrative control over account-level configuration of the CONTROL platform, including device profile management, parameter configuration, and service settings.
**Key Capabilities:**
| Area | Permissions |
|------|------------|
| **Device Profiles (Types)** | View, edit, and delete device profiles — the templates that define how the platform communicates with specific CPE device models. |
| **Parameters & Groups** | View, edit, and delete parameters and parameter groups — the configuration variables used by services (WiFi Analytics, throughput tests, etc.). |
| **Lists & Options** | View, edit, and delete list groups — dropdown/selection options used in service configuration. |
| **WiFi Remediation** | View remediation policies and manage remediation logs — automatic WiFi optimization actions. |
| **Task Scheduler** | View failed tasks and manage successful tasks in the background task queue. |
| **SecureDNS** | Add and edit DNS categories; view DNS transaction logs. |
| **Service Settings** | View extended service settings. |
| **Revision History** | Edit revision entries (audit log management). |
**Recommended For:** Platform administrators responsible for configuring device profiles and service parameters.
### CONTROL API Access
#### CONTROL API Logs read-only
**Description:** CONTROL read-only API Logs.
**Purpose:** Provides read-only access to API activity logs, enabling monitoring and auditing of all API transactions made to and from the platform.
**Key Capabilities:**
| Area | Permissions |
|------|------------|
| **API Methods** | View available API methods and their configurations. |
| **API Transaction Logs** | View API transaction logs — records of all API calls made to/from the platform including request/response details. |
| **API Transaction Details** | View detailed information for individual API transactions. |
**Recommended For:** Operations staff, auditors, and support teams who need to monitor API activity for troubleshooting or compliance purposes.
### CONTROL Inventory Management
#### CONTROL inventory admins
**Description:** CONTROL — inventory administration access.
**Purpose:** Full administrative access to the device inventory system, including device management, service configuration, reporting, and system tools.
**Key Capabilities:**
| Area | Permissions |
|------|------------|
| **Devices** | Add, edit, and view devices in the inventory. Manage device settings. |
| **Service Configuration** | Full CRUD on parameters, parameter groups, lists, list groups, and service classes — the building blocks of all services. |
| **Schedules & Scripts** | Create and manage inventory schedules and view script logs. |
| **Reports & Dashboards** | View dashboards. Manage report cache data. |
| **Locations** | Add locations and manage location groups. |
| **Portal** | View and manage portal profiles and templates. |
| **Performance Profiler** | Access the SQL query profiler for performance analysis. |
| **User Management** | Manage content types, permissions, user profiles, and sessions. |
| **Data Replication** | Full control over database replication processes. |
| **WiFi Analytics** | Manage WiFi remediation logs; view remediation policies. |
| **SecureDNS** | Manage categories, view rules and transaction logs. |
| **Validators** | Manage validation rules used by parameters. |
**Recommended For:** Senior administrators and engineering staff who need full control over the inventory and service configuration.
#### CONTROL inventory users
**Description:** CONTROL — inventory regular user access.
**Purpose:** Standard operational access to the device inventory, including device management, parameter editing, and report creation. This is the primary group for day-to-day operations.
**Key Capabilities:**
| Area | Permissions |
|------|------------|
| **Custom Reports** | Create custom reports for personal use. |
| **Dashboards** | Create new dashboards and manage elements. |
| **Service Configuration** | Full CRUD on parameters, lists, and validators — configure service behavior for devices. |
| **Device Settings** | Delete device settings (data cleanup). |
| **Group Variables** | Add group variables for device group configurations. |
| **Combined Logs** | Access combined device log views. |
| **Portal Templates** | Delete portal templates. |
**Recommended For:** NOC operators, field engineers, and support staff who actively manage devices and service configurations.
#### CONTROL inventory basic users
**Description:** CONTROL — inventory basic user access.
**Purpose:** Limited access for users who need to perform basic inventory operations such as creating custom reports and managing specific settings.
**Key Capabilities:**
| Area | Permissions |
|------|------------|
| **Custom Reports** | Create and delete custom reports — personal report configurations with saved filters. |
| **Dashboard Elements** | Remove dashboard widgets from personal views. |
| **Device Settings** | Delete device settings (cleanup operations). |
| **Parameters** | Delete parameters; view and change validators. |
| **Combined Logs** | Access to combined device logs view. |
**Recommended For:** Support staff who need basic report customization and limited inventory access.
#### CONTROL inventory read-only users
**Description:** CONTROL — inventory read-only access.
**Purpose:** Read-oriented access with the ability to create custom reports and dashboards for data visualization.
**Key Capabilities:**
| Area | Permissions |
|------|------------|
| **Custom Reports** | Create and delete custom reports. |
| **Dashboards** | Create dashboards and manage dashboard elements. |
| **Combined Logs** | Access combined device log views. |
| **Device Settings** | Delete device settings (for data cleanup). |
| **Validators** | Edit validator configurations. |
**Recommended For:** Monitoring staff and analysts who need to view inventory data and create custom visualizations.
#### CONTROL inventory read-only basic users
**Description:** CONTROL — inventory read-only basic access.
**Purpose:** Minimal access for users who primarily need to view data and create personal reports.
**Key Capabilities:**
| Area | Permissions |
|------|------------|
| **Custom Reports** | Create and delete custom reports for personal use. |
| **Dashboard Elements** | Add widgets to personal dashboard views. |
| **Validators** | Edit validator configurations. |
**Recommended For:** Users who need read-only access with the ability to create custom report views.
#### CONTROL inventory scripting
**Description:** CONTROL — inventory scripting management and execution.
**Purpose:** Access to script management and execution capabilities for automating device operations.
**Key Capabilities:**
| Area | Permissions |
|------|------------|
| **Scripts** | Execute and manage inventory scripts — automated procedures that run against devices (firmware upgrades, bulk configuration, diagnostics). |
| **Script Logs** | View execution logs and results from script runs. |
**Recommended For:** Operations engineers who need to run automated scripts against the device inventory.
### CONTROL Portal Management
#### CONTROL portal admins
**Description:** CONTROL — portal administration access.
**Purpose:** Administration of the CONTROL end-user portal — the customer-facing interface where end users can view their service status and device information.
**Key Capabilities:**
| Area | Permissions |
|------|------------|
| **Portal Pages** | Create, edit, and manage portal pages — the content displayed to end users. |
| **Portal Templates** | Design and manage page templates that control the portal's appearance. |
| **Portal Profiles** | Configure portal user profiles and access levels. |
| **Portal Services** | Manage which services are exposed through the portal. |
**Recommended For:** Staff responsible for managing and customizing the customer-facing portal.
### Link Management
#### Link admin users
**Description:** Link management application administration access.
**Purpose:** Full administrative access to the Link Management module — used for managing network link associations and interconnections between devices.
**Key Capabilities:**
| Area | Permissions |
|------|------------|
| **Links** | Create, edit, and delete network links and associations. |
| **Link Services** | Manage services associated with links. |
**Recommended For:** Network engineers managing device interconnections and link topology.
#### Link read-only users
**Description:** Link management application read-only access.
**Purpose:** View-only access to the Link Management module.
**Key Capabilities:**
| Area | Permissions |
|------|------------|
| **Links** | View network links and associations without the ability to modify them. |
**Recommended For:** Support staff who need visibility into network link topology without modification rights.
### SecureDNS
#### SecureDNS admins
**Description:** SecureDNS — administration access.
**Purpose:** Administrative access to the SecureDNS module — the DNS-based security filtering system that protects devices from malicious domains.
**Key Capabilities:**
| Area | Permissions |
|------|------------|
| **DNS Rules** | Create, edit, and delete DNS filtering rules — define which domains are blocked, allowed, or redirected. |
| **Categories** | Manage DNS categories (malware, phishing, adult content, etc.). |
| **Transaction Logs** | View DNS query logs and filtering statistics. |
| **Service Settings** | Manage SecureDNS service configuration. |
**Recommended For:** Security operations staff managing DNS-based protection policies.
#### SecureDNS reports
**Description:** SecureDNS — reports and transactions access.
**Purpose:** Read-only access to SecureDNS reporting and transaction data.
**Key Capabilities:**
| Area | Permissions |
|------|------------|
| **Reports** | View DNS filtering statistics, top blocked domains, category breakdowns, and response time metrics. |
| **Transaction Logs** | View DNS query logs to analyze filtering activity. |
**Recommended For:** Analysts and managers who need visibility into DNS security metrics without the ability to modify rules.
### SONDA (User Experience Monitoring)
#### SONDA admins
**Description:** SONDA / User experience — administration access.
**Purpose:** Administrative access to the SONDA module — the user experience monitoring system that runs automated tests (latency, jitter, throughput, WiFi quality) from probes and CPE devices.
**Key Capabilities:**
| Area | Permissions |
|------|------------|
| **Events** | View and delete events — automated alerts triggered by test results exceeding thresholds. |
| **Event Patterns** | Create event patterns — define which conditions trigger automated alerts. |
| **Event Origins** | Manage event origins — configure the sources (probes, devices) that generate events. |
| **Event Logs** | Add detailed event log entries. |
| **Test Profiles** | Configure test profiles that define which tests run on which schedules. |
| **Test Services** | Manage test service definitions (ping, throughput, WiFi analytics, etc.). |
**Recommended For:** Engineers configuring automated quality of experience (QoE) monitoring and alert thresholds.
#### SONDA reports
**Description:** SONDA / User experience — reports and transactions access.
**Purpose:** Read-only access to SONDA test results, metrics, and event data.
**Key Capabilities:**
| Area | Permissions |
|------|------------|
| **Event Logs** | View and edit event log entries. |
| **Event Origins** | View and edit event origin configurations. |
| **Test Results** | View test results — latency, jitter, throughput, WiFi scores, and other QoE metrics collected from probes and devices. |
| **Reports** | Access SONDA dashboards and metric reports. |
**Recommended For:** Operators and analysts monitoring service quality metrics.
### General User Access
#### Users
**Description:** Regular users — access to user's profile, change password operations, etc.
**Purpose:** Minimal access for basic user self-service operations.
**Key Capabilities:**
| Area | Permissions |
|------|------------|
| **User Profile** | View own user profile and personal information. |
| **Password** | Change own password. |
| **Site Settings** | View basic site configuration. |
**Recommended For:** Users who only need to manage their own account, such as portal-only users or external collaborators with limited access.
#### Users: Expert mode
**Description:** Expert mode users — users that can activate the "Expert Mode" option in admin interfaces.
**Purpose:** Enables the "Expert Mode" toggle in the admin interface. When activated, Expert Mode reveals advanced fields, options, and actions that are hidden by default to prevent accidental changes.
**Key Capabilities:**
| Area | Permissions |
|------|------------|
| **Expert Mode Toggle** | Access to the Expert Mode switch in the admin interface. When activated, shows advanced fields in device profiles, parameters, services, and other admin forms. |
| **Configuration Profiles** | Create new configuration profiles — advanced device provisioning templates. |
| **Advanced Actions** | In Expert Mode, additional actions become available on models that normally restrict certain operations (e.g., audit records, firmware logs). |
**Recommended For:** Senior engineers and administrators who need access to advanced configuration options. This group should be assigned selectively to users who understand the implications of advanced configuration changes.
## Recommended Group Combinations by Role
Users are typically assigned **combinations of groups** that together define their operational role. The following combinations provide templates for common organizational roles:
### Monitoring and Read-Only Roles
| Role | Recommended Groups | Description |
|------|-------------------|-------------|
| **Basic Monitoring** | • CONTROL API Logs read-only • CONTROL portal admins | View the admin interface and manage the customer portal. Suitable for NOC operators focused on monitoring. |
| **Monitoring + Inventory** | • CONTROL API Logs read-only • CONTROL inventory users • CONTROL portal admins | Monitoring with additional inventory management capabilities. |
### Operations Roles
| Role | Recommended Groups | Description |
|------|-------------------|-------------|
| **Standard Operations** | • CONTROL account admins • CONTROL API Logs read-only • CONTROL inventory users | Account and inventory management for daily operational tasks. |
| **Operations + Security** | • CONTROL account admins • CONTROL API Logs read-only • CONTROL inventory users • SecureDNS admins | Full operational access including DNS-based security management. |
| **Operations + Scripting** | • CONTROL account admins • CONTROL API Logs read-only • CONTROL inventory scripting • CONTROL inventory users | Operational access with script execution capabilities for bulk device operations. |
### Engineering Roles
| Role | Recommended Groups | Description |
|------|-------------------|-------------|
| **Engineering** | • CONTROL account admins • CONTROL API Logs read-only • CONTROL inventory users • Users: Expert mode | Full configuration access with advanced/expert features enabled. |
| **Engineering + Links** | • CONTROL account admins • CONTROL API Logs read-only • CONTROL inventory users • Link read-only users • Users: Expert mode | Engineering access with network link visibility. |
### Administrative Roles
| Role | Recommended Groups | Description |
|------|-------------------|-------------|
| **Full Administrator** | • CONTROL account admins • CONTROL API Logs read-only • CONTROL inventory admins • CONTROL portal admins • Users: Expert mode | Full access to all CONTROL modules with expert capabilities. |
| **SONDA Administrator** | • SONDA admins • SONDA reports | Full access to user experience monitoring and reporting. |
| **SecureDNS Administrator** | • SecureDNS admins • SecureDNS reports | Full access to DNS security management and reporting. |
### Minimal Access Roles
| Role | Recommended Groups | Description |
|------|-------------------|-------------|
| **Portal-only User** | • Users | Basic self-service access only (profile, password). |
| **API Auditor** | • CONTROL API Logs read-only | Read-only access to API transaction logs for auditing purposes. |
> **Note:** These are recommended starting points. Adjust group assignments based on your organization's specific needs and security policies.
## Organization-Based Access Control
In addition to group-based permissions, the CONTROL platform enforces **organization-based data isolation**:
- **Organization Membership:** Each user belongs to a specific **Organization**.
- **Data Visibility:** Users can only see and manage data (devices, services, reports, etc.) that belongs to their own organization and its sub-organizations.
- **Public Groups:** Groups marked as "public" are shared across sub-organizations, allowing parent organizations to define standard roles for all child organizations.
- **Isolation Enforcement:** This organizational boundary is enforced independently of group permissions.
This means two users with identical group assignments but different organizations will see different sets of devices and data, ensuring proper data isolation in multi-tenant environments.
## Best Practices
### Security and Access Management
1. **Principle of Least Privilege**
- Assign only the groups necessary for each user's role
- Start with minimum required groups and add more as needed
- Regularly review and remove unnecessary permissions
2. **Expert Mode Caution**
- Only assign "Users: Expert mode" group to users who understand the implications of advanced configuration changes
- Document which users have Expert Mode access and why
3. **Regular Audits**
- Periodically review user-to-group assignments to ensure they match current job responsibilities
- Audit organization assignments and data access patterns
- Review and clean up unused or inactive user accounts
### Role Management
4. **Use Standard Combinations**
- Follow the recommended role patterns documented above to maintain consistency across your organization
- Create standardized role definitions that can be applied consistently
5. **Document User Roles**
- Use the user "klass" (class/role) field to document each user's organizational role
- Maintain documentation of group combinations used for different job functions
- Keep records of why specific permission combinations were granted
### Multi-Organization Deployments
6. **Leverage Public Groups**
- Use public groups for standard roles shared across sub-organizations
- Define parent-level role templates that can be inherited by child organizations
- Maintain consistent role definitions across organizational boundaries
## Platform Modules Reference
| Module | Description | Administrative Groups | Reporting Groups |
|--------|-------------|----------------------|------------------|
| **CONTROL Inventory** | Device management, profiles, parameters, settings, and monitoring | • CONTROL account admins • CONTROL inventory admins • CONTROL inventory users | • CONTROL inventory read-only users • CONTROL inventory read-only basic users |
| **CONTROL Portal** | Customer-facing portal for end-user access | • CONTROL portal admins | — |
| **CONTROL Scripting** | Automated script execution against devices | • CONTROL inventory scripting | — |
| **CONTROL API** | API transaction monitoring and auditing | — | • CONTROL API Logs read-only |
| **Link Management** | Network link and device interconnection management | • Link admin users | • Link read-only users |
| **SecureDNS** | DNS-based security filtering | • SecureDNS admins | • SecureDNS reports |
| **SONDA** | User experience monitoring (QoE tests, probes) | • SONDA admins | • SONDA reports |
| **General** | User profile and expert mode access | — | • Users • Users: Expert mode |
# Configuration
# Automatic Onboarding
## Overview
Many agent-based standard protocols used to manage networking devices recommend using unique credentials (username/password, keys, etc.) for each managed device. This recommendation enhances security and enables individual device identification during message exchanges. However, it introduces additional complexity, as each managed device must be pre-provisioned with unique credentials before deployment.
The **Automatic Onboarding** feature in CONTROL simplifies this pre-configuration process. It allows devices to initially connect using a common set of credentials, which are then automatically replaced with individual credentials after the first successful connection.
## Accessing Automatic Onboarding Settings
**Automatic Onboarding** options are configured per **Device Profile / Type** and can be accessed through:
**Inventory** > **Profile / type**
[](https://docs.zequenze.com/uploads/images/gallery/2020-04/wWoEoIPix5B3GXzW-image-1587160794119.png)
For detailed information about accessing **Device Profile / Type** configuration screens, refer to the [**Device Profile / Type** configuration](/books/control/page/device-profile-configuration/) section.
## Configuration
### Enabling Automatic Onboarding
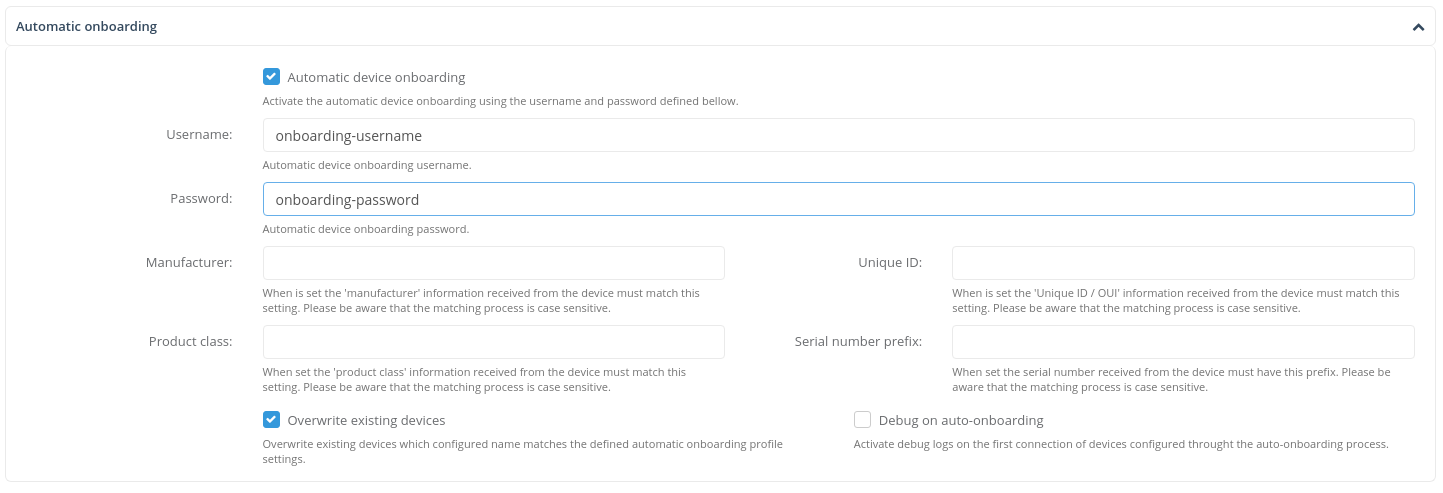
To configure and activate **Automatic Onboarding** for a specific **Device Profile / Type**:
1. Navigate to the **Device Profile / Type** configuration screen
2. Locate the **Automatic onboarding section**
3. Enable the *Automatic device onboarding* checkbox
4. Populate the following required fields:
- **Username**: The pre-defined username that devices will use during initial authentication
- **Password**: The pre-defined password that devices will use during initial authentication
Once configured, any device connecting to the platform with these credentials will be automatically onboarded and assigned to the corresponding **Device Profile / Type**.
### Device Identification Fields
The following optional fields provide additional validation and identification criteria for connecting devices:
- **Manufacturer**: Filters devices by manufacturer name
- **Unique ID**: Specifies a unique identifier for device matching
- **Product class**: Filters devices by product class designation
- **Serial number prefix**: Matches against the beginning characters of the device serial number
#### Identification Rules
- **Case sensitivity**: All identification field matching is case-sensitive
- **Prefix matching**: For *Serial number prefix*, the system matches the specified text against the left-most characters of the received serial number
- **Protocol dependency**: Identification fields are management protocol-dependent and must be provided in the first message from the managed device (e.g., the *Inform* message for devices managed through *TR-069*)
#### Example
If the *Manufacturer* field is set to `Zequenze`, the **Automatic Onboarding** process for this **Device Profile / Type** will only apply to devices that identify themselves with `Zequenze` in their manufacturer field.
## Advanced Configuration
Additional **Automatic Onboarding** configurations can be customized through:
- **Connection Profile** objects for each **Device Profile / Type**
- **Connection service** objects for each **Device Profile / Type**
TBC
# CONTROL Configuration basics
## Overview
Enabling devices to be managed by the CONTROL platform can be accomplished through a few simple steps. This guide covers the basic configuration requirements to onboard devices into CONTROL.
## Configuration Steps
### Step 1: Create a Device Profile
Before adding devices, you must first create a Device Profile (also called Device Type) that defines the characteristics of the devices you want to manage.
**Required fields:**
- CPE Profile/Type name
- CPE class
- Protocol
**Optional fields:**
- Auto-onboarding
### Step 2: Create the Device
If auto-onboarding is not enabled, you need to manually create each device that will be managed by CONTROL.
**Required fields:**
- CPE name
- CPE Profile/Type
- Username
- Password
**Note:** This step can be skipped if auto-onboarding is enabled in the Device Profile.
## Next Steps
Once you have completed these configuration tasks, proceed to [configure the CPE to become managed by the CONTROL platform](https://docs.zequenze.com/books/control/page/how-to-configure-a-cpe-to-become-managed-by-control).
## Understanding Device Profiles
### First-Time Device Onboarding
When onboarding a device type for the first time, you must create and customize a Device Profile (Profile/Type) that will serve as a template for all devices of the same type.
### Profile Reusability
Once a Device Profile is created, it can be reused for all new devices of the same type. Devices can be added to CONTROL through:
- Manual creation in the platform
- Batch creation
- Auto-onboarding (if enabled)
All devices will automatically use the appropriate Device Profile based on their type.
### Profile Updates
Any changes made to a Device Profile—such as improvements or fixes—will be automatically applied to all devices that use that Profile/Type. This ensures consistent configuration across all devices of the same type without requiring individual device updates.
# Device Profile configuration
## Overview
In the CONTROL platform, every device defined in the **Inventory** is assigned to a specific **Device Profile/Type**. These profiles function as shared templates that define the characteristics and behavior of devices. Device Profiles streamline device management by establishing consistent configurations across multiple devices.
## Key Components
A Device Profile/Type defines the following core features related to device configuration and behavior:
### Connection Profile
Specifies the management protocol and associated settings used to communicate with and manage devices assigned to this profile.
### Default Firmware
Defines the predetermined firmware version that can be used to update managed devices to a specific software version. This ensures consistent firmware deployment across devices sharing the same profile.
### Automatic Onboarding
Configures automatic onboarding rules specific to this Device Profile/Type. These rules streamline the process of adding new devices to the system by applying predefined settings automatically.
### Parameter Groups
Contains the collection of **Parameters** defined in this profile template, including their individual settings and configurations. Parameter Groups organize device-specific settings into logical categories for easier management.
## Purpose
Device Profiles serve as reusable templates that standardize device configuration, simplify management workflows, and ensure consistency across your device inventory.
# Firmware Management
## Overview
CONTROL ACS provides comprehensive **Firmware Management** functionality to automate firmware updates across your device fleet. The system is configured through two main areas:
- **Device Profile / Types** (`Inventory > Profile / types`)
- **Firmware Library** (`Firmware > Images`)
This page explains how to configure and use these features to manage firmware versions automatically.
---
## Device Profiles / Types
Navigate to **Inventory > Profiles / types** to configure firmware management settings for each device type.
### Enabling Automatic Firmware Upgrades
Within any **Device Profile / Type** definition, you can activate automatic firmware upgrades by enabling the **Automatic Firmware Upgrades** checkbox:
### How It Works
Once the **Automatic Firmware Upgrades** checkbox is enabled, CONTROL ACS will automatically manage firmware updates based on your configuration:
**With Default Firmware Image specified:**
- CONTROL ACS checks if a device matches the criteria and selection parameters of the configured *Default firmware* image
- If matched, the system initiates a firmware upgrade (or downgrade) automatically
**Without Default Firmware Image:**
- CONTROL ACS searches the **Firmware Library** (`Firmware > Images`) for applicable firmware images
- Advanced rules and policies configured in the library determine which firmware to apply
---
## Firmware Library
The Firmware Library (`Firmware > Images`) allows you to manage firmware images with granular control over distribution and applicability.
### Firmware Image Configuration
Each firmware image in the library can be configured with the following settings:
- **Image mnemonic** — Friendly name and description for the image
- **Image location** — Storage location options:
- ACS platform (suitable for smaller deployments)
- Local HTTP/FTP server (recommended for large-scale distributions)
- **Firmware applicability rules** — Control when firmware applies based on:
- Device hardware version
- Current device firmware version
- Release date
- Additional criteria
### Adding a Firmware Image
1. Click the **Add Image** button at the top right of the interface:
2. Configure the image settings on the **Add Image** page:
### Firmware Image Parameters
| Parameter | Description |
|-----------|-------------|
| **Name** | Mnemonic identifier for the firmware image |
| **Version** | Version number of the firmware image |
| **Device Profile** | Select the Device Profile this image applies to from the dropdown menu |
| **Upgrade Profile** | *To be confirmed* |
| **File or URL** | Upload the firmware file through the GUI or specify an HTTP/FTP URL where the image is located **Note:** Using a local Service Provider HTTP/FTP server is **STRONGLY recommended** for massive firmware updates |
| **Release Date** | Optional. If specified, automatic updates will only be applied after this date |
| **Apply to Selector** | Comparison method used when matching the device's software version against the 'Apply to' version Default: 'Equal to' |
| **Apply to (version)** | Target device software version for this firmware Leave blank to apply to devices with any version |
| **Hardware Version** | Target device hardware version for this firmware Leave blank to apply to devices with any hardware version |
---
## Version Comparison Algorithm
CONTROL ACS uses a direct character-by-character comparison algorithm to determine version precedence.
### Comparison Examples
The algorithm evaluates versions as follows:
- `v1.0.1` is a **lower** version than `v1.0.10`
- `v1.0.1a` is a **lower** version than `v1.0.1b`
- `v1.0.1a` is a **greater** version than `v1.0.1`
### Important Consideration
The algorithm treats `v1.0.1a` as a higher version than `v1.0.1`, which may not be the desired behavior in all scenarios.
**Workaround:** Add an underscore character to ensure correct version ordering:
- `v1.0.1_` is a **lower** version than `v1.0.1a`
This allows you to maintain the expected version hierarchy when alphabetic suffixes are used.
---
## Firmware Selection Logic
*To be confirmed*
---
## Upgrade Profiles
Navigate to **Firmware > Profiles** to manage upgrade profiles.
*To be confirmed*
# Parameter configuration
## Overview
The Parameter configuration screen allows you to define and manage all parameters associated with a specific Device Profile/Type or template in CONTROL.
## Accessing the Parameter Configuration Screen
There are two ways to access the Parameter configuration screen:
### Method 1: Via the Inventory Menu
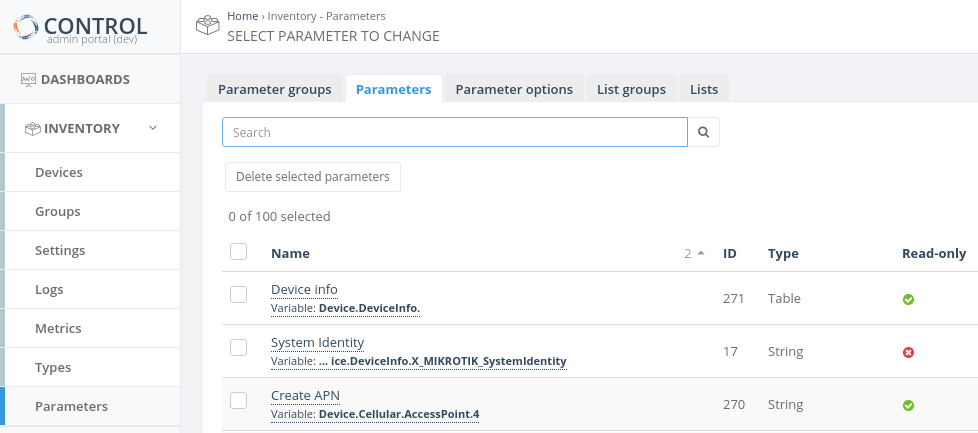
Navigate to **Inventory** > **Parameters** from the main menu.
[](https://docs.zequenze.com/uploads/images/gallery/2020-03/CJD3QjD9gW30bmS0-image-1585057914708.png)
**Note:** Click on the parameter name in the first column to access the Parameter configuration screen.
### Method 2: Via Device Profile/Type
1. Navigate to **Inventory** > **Profile/Type**
2. Select the desired Profile/Type object
3. Locate the corresponding Group
[](https://docs.zequenze.com/uploads/images/gallery/2020-03/9uu5AuY0h9jFPQ6c-image-1585612515164.png)
4. Click the edit button ([](https://docs.zequenze.com/uploads/images/gallery/2020-03/H4oW2yNJeHm8Aq0e-image-1585614107767.png)) for the group you want to configure
[](https://docs.zequenze.com/uploads/images/gallery/2020-03/UMtVOu8y3qybQ0Nz-image-1585613937369.png)
5. A popup window will display the Parameter list for the selected group
[](https://docs.zequenze.com/uploads/images/gallery/2020-03/vaVefH1DtWAr8B2d-image-1585615613868.png)
6. Click the **edit** link on the left side of the Parameter table to access the configuration screen
## Configuration Screen Structure
The Parameter configuration screen is organized into two main sections:
### General Settings
Contains the basic configuration options required to define the fundamental characteristics of the Parameter that will be managed by the platform.
### Advanced Settings
Provides optional configuration options for advanced Parameter management features.
## Required and Important Settings
*To be completed.*
# Connection Retries & Time-Out
## Descripción General
Esta documentación describe cómo configurar los parámetros de **tiempo de espera (timeout)** y **reintentos (retries)** para Connection Request en la plataforma ACS CONTROL de Zequenze.
### Contexto del Cambio
En versiones anteriores, estos parámetros estaban definidos de forma implícita en el código con los siguientes valores:
- **Timeout:** 3 segundos
- **Reintentos:** 2 intentos
Con la implementación actual, estos parámetros pueden configurarse por perfil de conexión, permitiendo ajustarlos según las necesidades específicas de cada cliente.
---
## Configuración de Parámetros
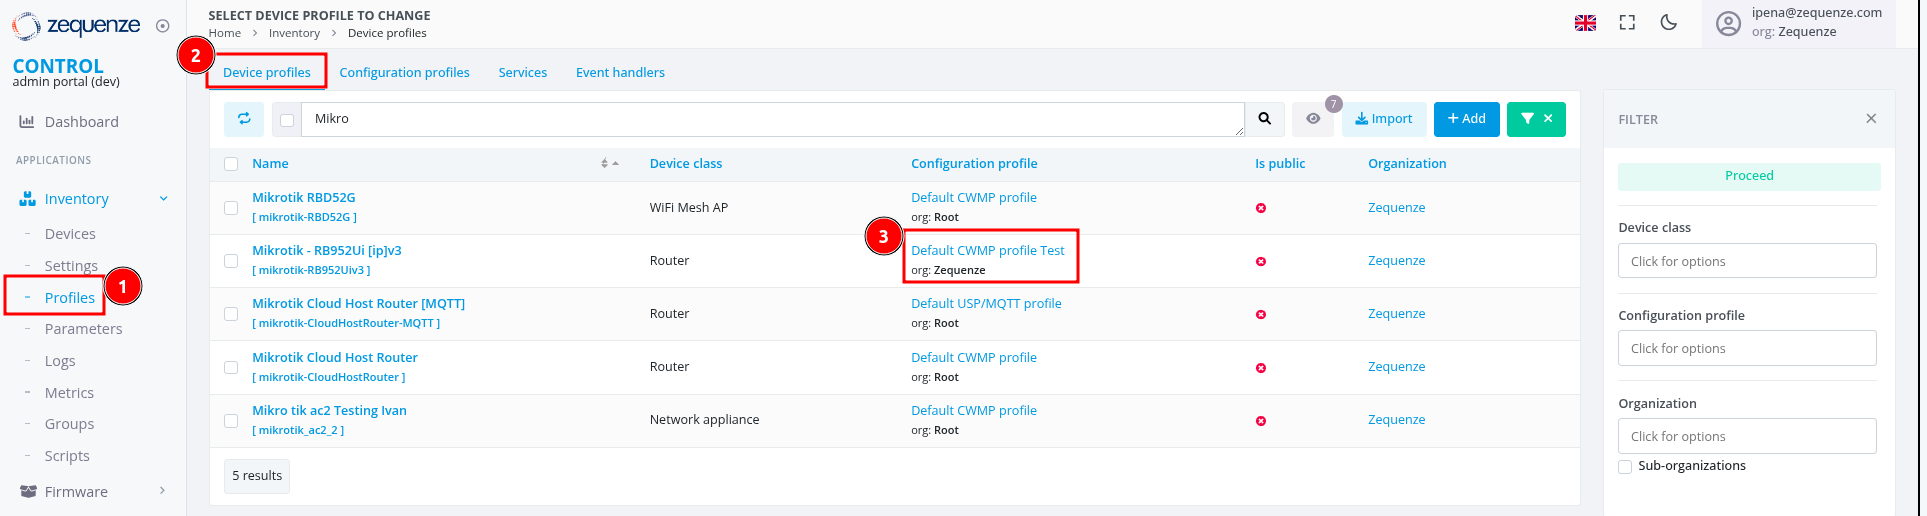
### Paso 1: Acceder a Device Profiles
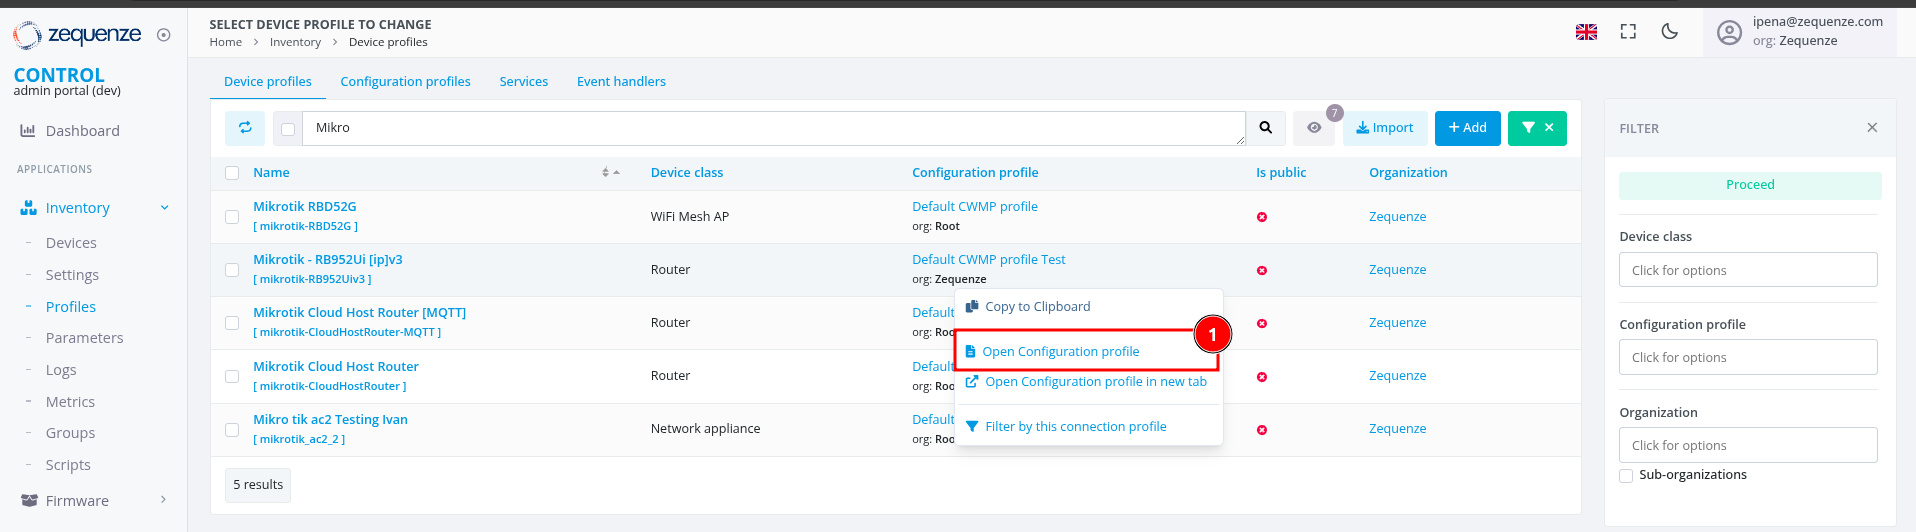
1. En el menú lateral izquierdo, haga clic en **"Profiles"**
2. Verifique que se encuentra en la pestaña **"Device profiles"** (parte superior de la pantalla)
3. Localice el perfil que desea modificar en la columna **"Configuration profile"**
4. Pase el cursor sobre el nombre del perfil
5. Haga clic en el ícono de menú que aparece para abrir las opciones disponibles
[](https://docs.zequenze.com/uploads/images/gallery/2025-10/53omjPpASbbQB0Ke-1-profile-1-zqz.png)
---
### Paso 2: Abrir el Configuration Profile
1. En el menú contextual, seleccione **"Open Configuration profile"**
[](https://docs.zequenze.com/uploads/images/gallery/2025-10/FbhEkumm4X8HKrkG-1-profile-2-zqz.png)
Se abrirá la pantalla de configuración del perfil seleccionado.
---
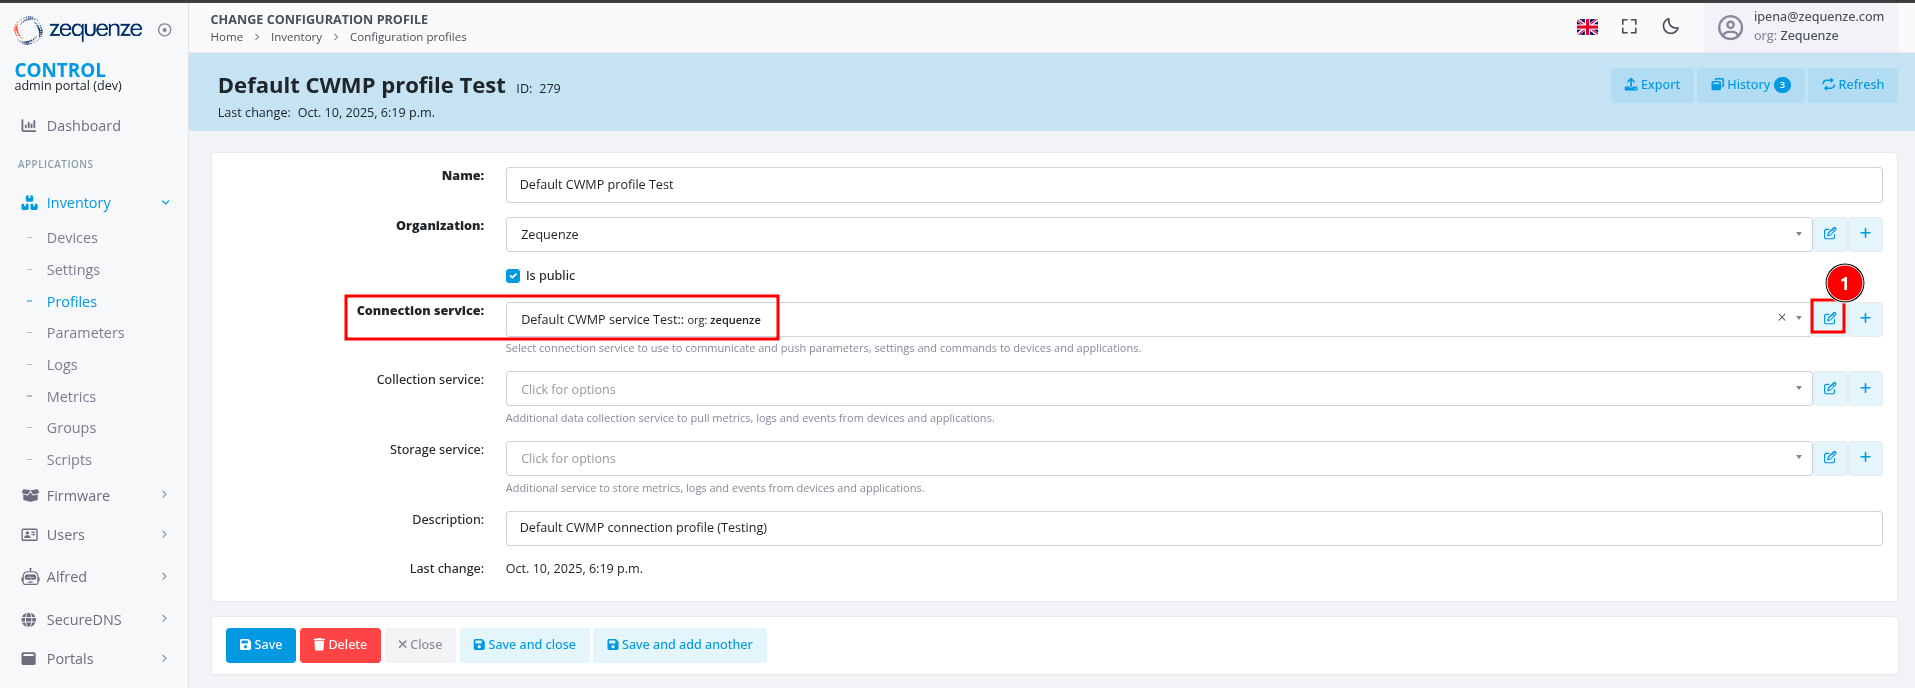
### Paso 3: Editar el Connection Service
1. Localice la línea **"Connection service"**
2. Haga clic en el ícono de **lápiz** (editar) ubicado al final de la línea
3. Se abrirá una ventana con las opciones de configuración del servicio de conexión
[](https://docs.zequenze.com/uploads/images/gallery/2025-10/1K4wc2fcD0GAUPar-3-connec-service-1-zqz.png)
---
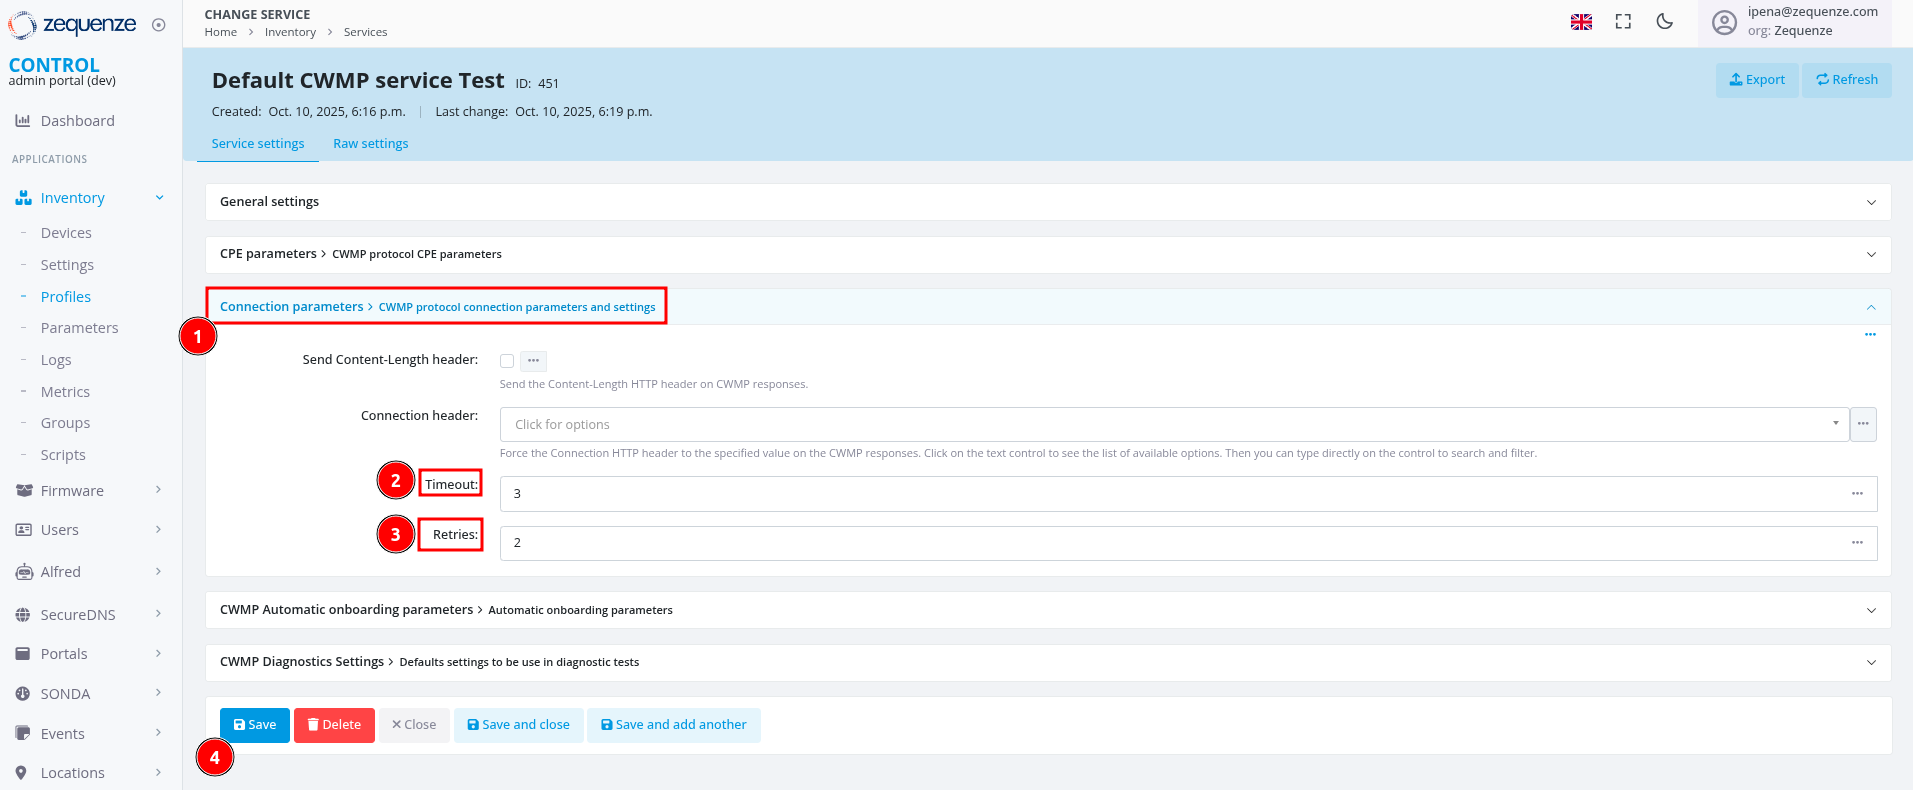
### Paso 4: Configurar los Parámetros de Connection Request
1. Busque el grupo **"Connection parameters > CWMP protocol connection parameters and settings"**
2. Expanda este grupo para visualizar las opciones disponibles
3. Configure los parámetros según sus necesidades (ver descripciones a continuación)
4. Haga clic en **"Save"** para guardar los cambios
5. Continúe haciendo clic en **"Save"** en cada ventana anterior para asegurar que todos los cambios queden aplicados
[](https://docs.zequenze.com/uploads/images/gallery/2025-10/Lgxuk4zHV6lJQ3q8-4-timeout-and-retries-zqz.png)
---
## Descripción de Parámetros
### Timeout
Define el tiempo máximo de espera (en segundos) que el sistema aguardará por una respuesta del dispositivo CPE antes de considerar que la solicitud de conexión ha fallado.
Este valor permite ajustar la tolerancia del sistema según las condiciones de red y características de los dispositivos gestionados.
**Valor recomendado:** Entre 5 y 30 segundos, dependiendo de la latencia de la red.
### Retries
Especifica el número de intentos que el sistema realizará para establecer la conexión con el dispositivo CPE cuando el intento inicial falle.
Este parámetro mejora la confiabilidad de la comunicación en escenarios con conectividad intermitente o inestable.
**Valor recomendado:** Entre 2 y 5 reintentos.
---
## Consideraciones Importantes
**Configuración de valores:**
- Configure los valores de **Timeout** y **Retries** considerando las características específicas de su red y dispositivos
- Valores muy altos de timeout pueden generar demoras innecesarias en la detección de fallas
- Valores muy altos de retries pueden sobrecargar el sistema cuando hay dispositivos con problemas persistentes de conectividad
**Validación:**
- Se recomienda realizar pruebas después de modificar estos parámetros para validar el comportamiento esperado
# Advanced topics
# CONTROL High Availability Architecture
## Overview
To achieve a robust high-availability (HA) architecture for CONTROL Device Management, Service Providers must comprehensively address both application implementation and operational requirements within their network infrastructure. This includes identifying critical points of failure and implementing appropriate HA strategies to mitigate them.
## High-Availability Architecture Overview
The primary objective of an HA architecture is to guarantee uninterrupted application service in the event of component failure within the solution.
The standard CONTROL Device Management application architecture is illustrated below:
[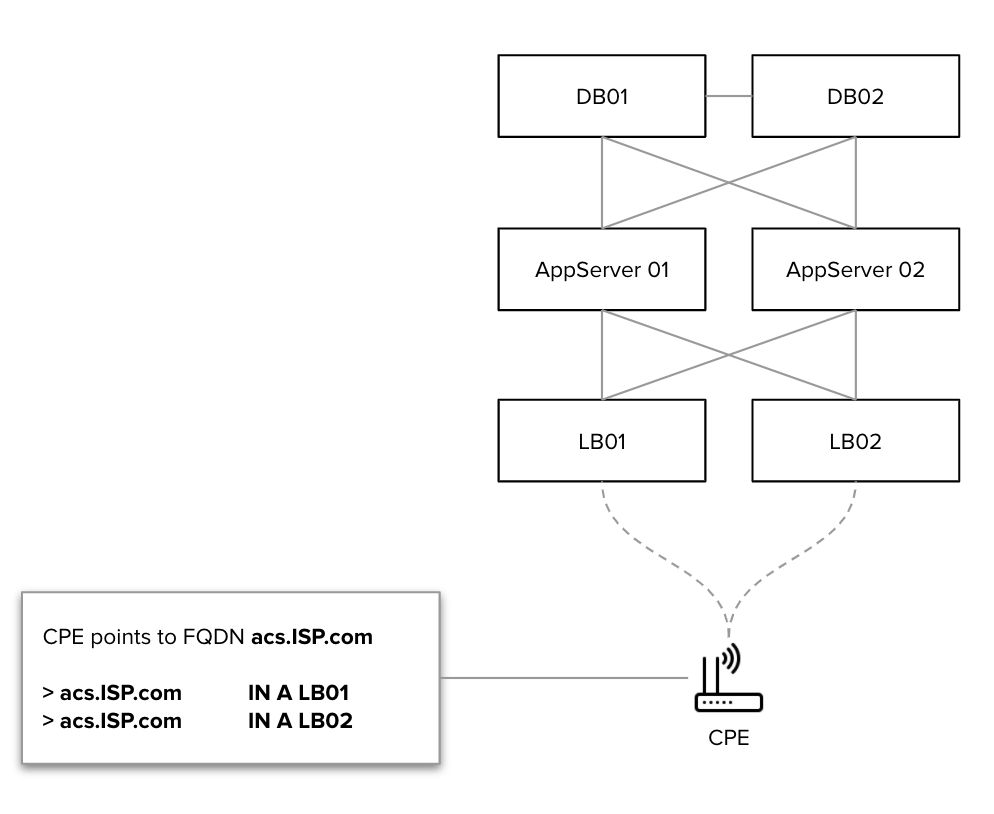](https://docs.zequenze.com/uploads/images/gallery/2020-07/7DpIVzJSY5M4SZb2-dev-mgmt-HA-architecture2.png)
## Architecture Prerequisites
The CONTROL HA architecture is designed with the following key requirements:
- **Active-Active Configuration**: Ensures predictable HA operation and optimal resource utilization
- **Cluster Capacity**: Each individual cluster must be capable of handling 100% of the **average** load
- **Deployment Flexibility**: HA clusters can be deployed either co-located or geographically distributed (typically requires site-to-site latency below 250 ms)
## Principles of Operation
The HA architecture operates based on the following mechanisms:
- **DNS Resolution**: Customer Premises Equipment (CPE) points to a Fully Qualified Domain Name (FQDN) that resolves to the load balancer array
- **DNS Health Checks**: DNS periodically verifies load balancer array availability using HTTP health checks
- **Load Balancer Health Checks**: Load balancers periodically verify Auto Configuration Server (ACS) service availability through HTTP/API methods
## Failure Scenarios
The following failure scenarios describe system behavior in a geographically-distributed HA deployment:
### Complete Site or Load Balancer Failure
When DNS detects a failure, it automatically removes the failing load balancer from the DNS group, redirecting traffic to healthy sites.
### Application Server Failure
When the load balancer detects an application server failure, it automatically removes the failing application server from the load balancer group, distributing traffic among remaining healthy servers.
### Database Failure
In the event of a database failure, both application servers automatically fail over to the surviving database instance, ensuring continuous operation.
# Conversion and units for parameters
## Overview
Units of measurement and value conversions can be configured for any parameter in CONTROL. This allows you to standardize how data is displayed and automatically convert values between compatible units (e.g., Bytes to Megabytes).
---
## Configuring Parameter Units
You can assign a unit of measurement to any parameter (such as Bits, Bytes, Megabytes, etc.) through the Parameter configuration screen.
### How to Set a Unit
1. Navigate to the Parameter configuration screen
2. Select the desired unit from the `Unit` dropdown field
[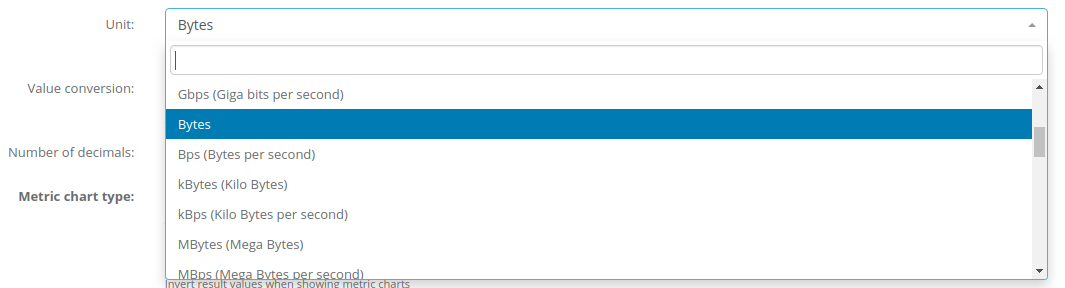](https://docs.zequenze.com/uploads/images/gallery/2020-04/1QLrFTDJLQB3jhVO-parameter_unit.png)
### Display Location
Once a unit is configured, it will be displayed on the device's main screen at the beginning of the corresponding parameter value.
[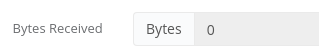](https://docs.zequenze.com/uploads/images/gallery/2020-04/c8qCbIhmVO6IFQqP-units.png)
---
## Value Conversions
In addition to displaying units, CONTROL can automatically convert values from one unit to another. This is useful when the device reports data in one unit but you need to display it in another.
### How to Configure Conversions
To enable automatic conversion between compatible units:
1. Set the source unit in the `Unit` field
2. Set the target unit in the `Value conversion` field
### Example: Converting Bytes to Megabytes
The following configuration will convert values received from the device in Bytes to Megabytes:
[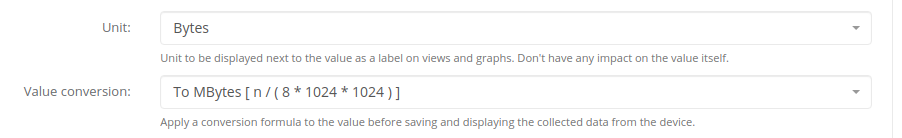](https://docs.zequenze.com/uploads/images/gallery/2020-04/evNfr0rrjosBcEtz-value_conversion.png)
### Important Notes
- **Compatible units required**: The `Unit` and `Value conversion` fields must contain compatible unit types for automatic conversion to work (e.g., both must be data size units like Bytes, Kilobytes, Megabytes).
- **Custom conversions**: For custom conversion logic or conversions between incompatible unit types, use the processing script option instead.
# Dynamic value substitution
## Overview
Dynamic value substitution allows you to use variables as placeholders in CONTROL configuration settings. Variables are enclosed in double curly braces (e.g., `{{ variable_name }}`) and are automatically replaced with their actual values when applied to devices.
You can use dynamic value substitution in the following contexts:
- Default values for **Parameters** in Device Profile/Type configurations
- **Device Settings** values in Device Profile/Type configurations
- Integration service configurations for event handlers and other integrations
## How Variables Work
Variables and their values are defined under the **Groups** menu. They can be:
- **Custom variables**: Manually defined within Groups
- **System variables**: Dynamically generated from Device object information and settings
For detailed information about configuring Groups and their variables, see the [Inventory Groups section](/books/control/page/inventory-groups/).
## Using Variables in Configuration
When a Device belongs to a Group that includes a defined variable, CONTROL automatically substitutes any matching variable placeholder with its actual value.
**Example:**
If a Device belongs to a Group with a variable named `network_name` set to `Zequenze`, then:
- Any setting configured as `{{ network_name }}` will be replaced with `Zequenze`
- If a Parameter's default value in a Device Profile/Type is set to `{{ network_name }}`, the platform will use `Zequenze` when generating the device's default configuration
## Variable Precedence and Weight
When multiple Groups define the same variable name, CONTROL uses the **Weight** value to determine precedence:
- Variables configured with **higher weights** take precedence over those with lower weights
- If a Device belongs to multiple Groups that define the same variable, the value from the variable with the highest weight will be used
[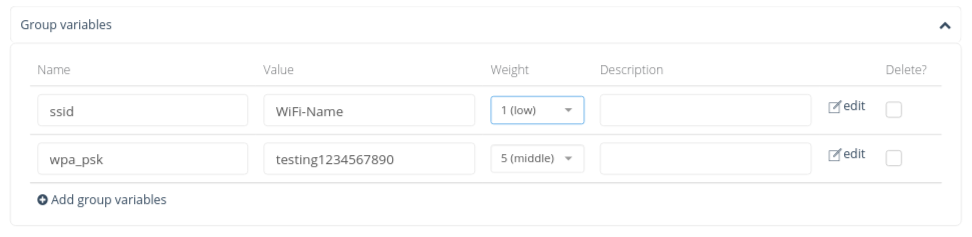](https://docs.zequenze.com/uploads/images/gallery/2020-05/EfGjNQw5cFwkzo4W-image-1589426567125.png)
## System-Generated Device Variables
The following variables are automatically generated from Device object properties and are available for use in dynamic value substitution:
| Variable Name | Description |
|---------------|-------------|
| `device.name` | Name of the device |
| `device.description` | 1st description of the device |
| `device.description2` | 2nd description of the device |
| `device.description3` | 3rd description of the device |
| `device.description4` | 4th description of the device |
| `device.serial_number` | Serial number of the device |
| `device.serial_number_alt` | Alternate serial number of the device |
| `device.organization` | Name of the Device's assigned Organization |
| `device.organization_id` | ID of the Device's assigned Organization |
| `device.type_id` | ID of the Device's Type/Profile |
| `device.type.name` | Name of the Device's Type/Profile |
| `device.type.short_name` | Short name configured on the Type/Profile |
| `device.type.klass` | Class of device configured on the Type/Profile |
| `device.manufacturer` | Manufacturer of the device |
| `device.unique_identifier` | Manufacturer Unique ID |
| `device.product_class` | Product class |
| `device.software_version` | Software version of the device |
| `device.hardware_version` | Hardware version of the device |
| `device.location_name` | Location name configured for the device (not normalized) |
| `device.location_id` | ID of the Location assigned to the device (normalized) |
| `device.location.name` | Name of the Location assigned to the device (normalized) |
| `device.location.short_name` | Short-name of the Location assigned to the device (normalized) |
| `device.longitude` | Longitude of the device |
| `device.latitude` | Latitude of the device |
| `device.username` | Device's management agent username |
| `device.password` | Device's management agent password |
| `device.update_frequency` | Update frequency interval configured on the device |
| `device.mac` | MAC address of the device |
| `device.address` | Management address of the device |
| `device.gateway_address` | Management gateway address or hostname |
## Examples
### Example 1: Device Settings Substitution
If a device is configured with the following settings:
[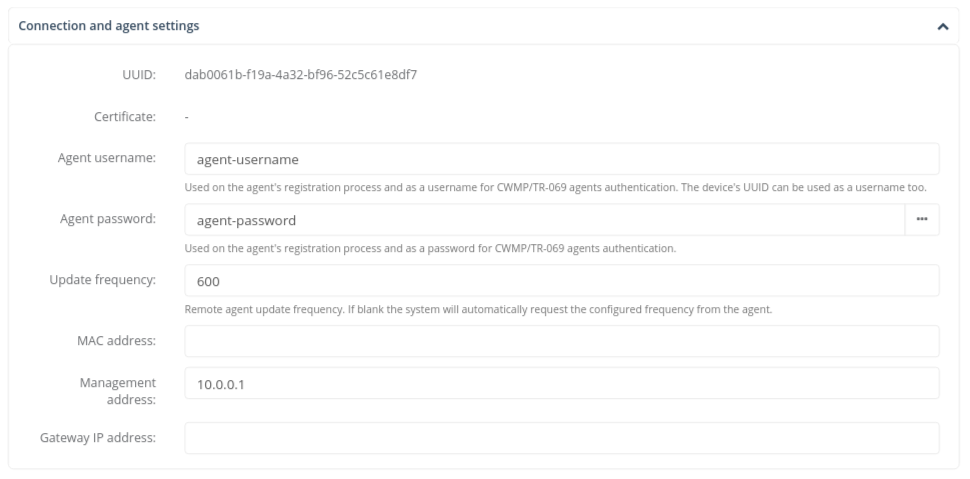](https://docs.zequenze.com/uploads/images/gallery/2020-05/J9eUjSPp2drNZEPs-image-1589427943710.png)
The following variable substitutions will be performed:
- `{{ device.username }}` → `agent-username`
- `{{ device.password }}` → `agent-password`
- `{{ device.update_frequency }}` → `600`
- `{{ device.address }}` → `10.0.0.1`
### Example 2: Parameter Default Value
The following example shows dynamic value substitution configured as the default value of a Parameter:
[](https://docs.zequenze.com/uploads/images/gallery/2021-02/4rxRTsxWAwzhQSZV-image-1613402002535.png)
# Grouped management
## Overview
**Grouped management** is a feature that controls how CONTROL retrieves and sets parameter values from managed devices.
By default, CONTROL optimizes communication by retrieving and setting parameter values using the smallest number of operations possible. This approach minimizes communication overhead and reduces processing utilization between the platform and managed devices.
However, certain management flows and conditions require operations to be grouped into logical blocks rather than executed as a single batch. CONTROL uses **Parameter groups** as these logical blocks, which are configured in the **Device Profile / Type** configuration screens.
When **Grouped management** is enabled, the system performs `get` operations separated into blocks of **Parameters** as defined by each **Parameter group**.
## How Grouped Management Works
### Behavior for Get Operations
When **Grouped management** is active, CONTROL executes `get` operations in the following sequence:
1. **First phase**: The system retrieves **Parameter** values from managed devices for all **Parameter groups** that do NOT have the **Grouped management** setting enabled
2. **Second phase**: The platform retrieves **Parameter** values using one separate `get` operation for each **Parameter group** that HAS the **Grouped management** setting enabled
This two-phase approach ensures that parameters requiring grouped retrieval are processed separately while maintaining efficiency for standard parameter groups.
## Configuration
Configuration instructions to be completed.
# Interconnection Gateway architecture
## Architecture Overview
Connectivity between the Service Provider's network and Zequenze's cloud-based platforms is established through a fully redundant VPN connection architecture.
[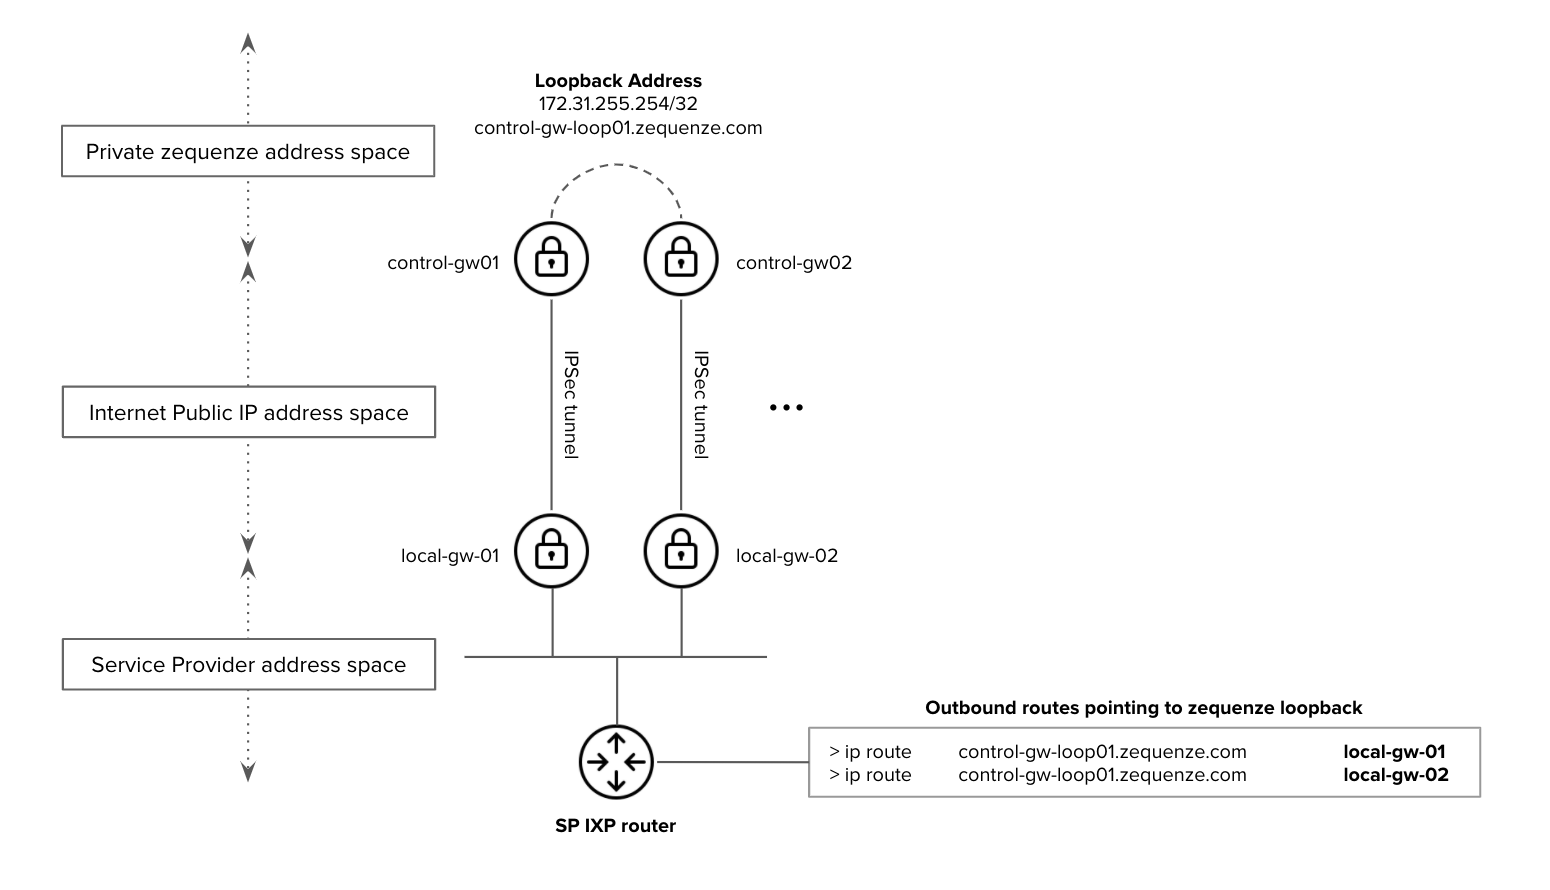](https://docs.zequenze.com/uploads/images/gallery/2020-05/pCYUjqvvzbTGy5Em-edge-gw.png)
**Figure 1. Zequenze Application-VPN architecture - interconnection with the Service Provider network**
### Distributed Gateway Architecture
Zequenze's cloud architecture implements a distributed application model that integrates both VPN and edge-application functionalities within the same gateway infrastructure. This design eliminates the need to propagate Service Provider IP prefixes throughout Zequenze's cloud infrastructure.
### Device Configuration
Service Providers need to configure their customer premises equipment (CPE) to communicate with the edge-application gateways. Supported device types include:
- WiFi Access Points
- DSL modems
- FTTH ONT (Optical Network Terminals)
- eMTA (embedded Multimedia Terminal Adapters)
- LTE/5G routers
Once devices are pointed to the edge-application gateways, all internal communications within Zequenze's cloud architecture are handled automatically.
### Simplified Routing Configuration
To maximize simplicity and resiliency, Service Provider devices only need to be configured with a single loopback FQDN/IP address. This loopback address remains active across all edge-application gateways in the array.
**Example:** `control-gw-loop01.zequenze.com` (as shown in Figure 1)
#### Service Provider Requirements
From a routing perspective, the Service Provider must ensure:
- IP reachability to the loopback FQDN/IP address from their border/IXP peering router
- Proper route advertisement as detailed in Figure 1
## Resiliency and High Availability
### Active-Active Gateway Operation
All edge-application gateways operate in always-active mode (1:1 or 1:N configurations). This allows traffic to be routed to any edge-application gateway in the array at any time without service interruption.
### Traffic Flow Management
All responses from Zequenze to the Service Provider are sent through the same edge-application gateway that received the initial request. This approach ensures:
- Compatibility with active-standby scenarios within the Service Provider's network
- Prevention of asymmetric traffic routing issues
### Failure Handling
Service Providers must implement proper failure detection mechanisms to prevent traffic black-holes in their VPN gateways when connectivity issues occur with Zequenze edge-application gateways.
[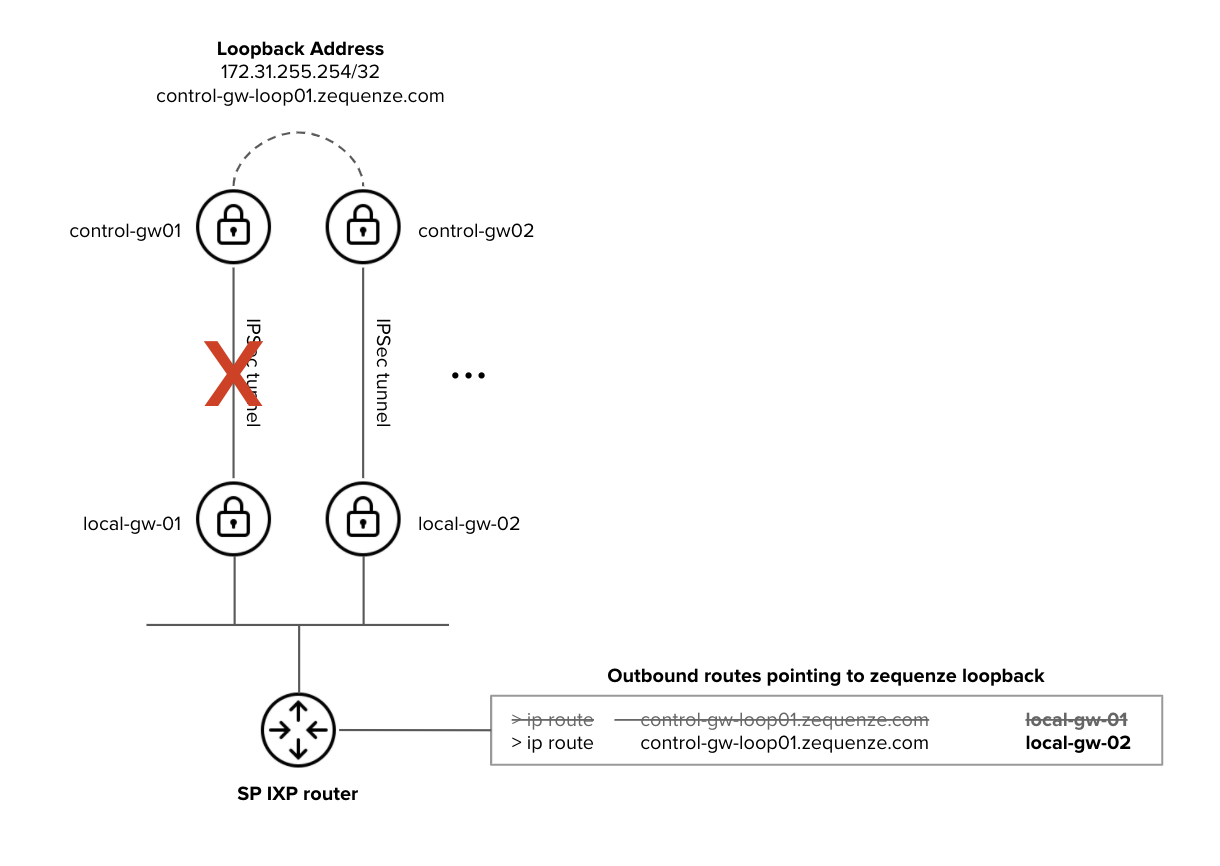](https://docs.zequenze.com/uploads/images/gallery/2020-05/JIAqW8AHzdqpYLus-edge-gw-failure.png)
**Figure 2. Zequenze Application-VPN architecture - High Availability considerations**
#### Failure Scenario Example
In the failure scenario illustrated in Figure 2:
- The SP IXP router must be notified that the Zequenze edge-application gateway (`control-gw-loop01.zequenze.com`) is no longer reachable via `local-gw-01`
- Traffic must be automatically redirected to `local-gw-02` to maintain service continuity
This requires proper routing protocol configuration or health-check mechanisms on the Service Provider's infrastructure to detect and respond to gateway failures.
# Inventory scripts
## Overview
**Inventory scripts** are Python-based automation tools that execute operations on managed **Devices** in CONTROL. These scripts can target devices through user-configured filters or process data from CSV files. Use inventory scripts to gather device information or perform batch operations across multiple devices.
Scripts can be executed:
- **Manually** by users through the CONTROL interface
- **Automatically** via triggers configured in **Device Profiles**
## Accessing Inventory Scripts
Navigate to the **Inventory scripts** configuration screen from the main menu:
**Inventory** → **Scripts**
[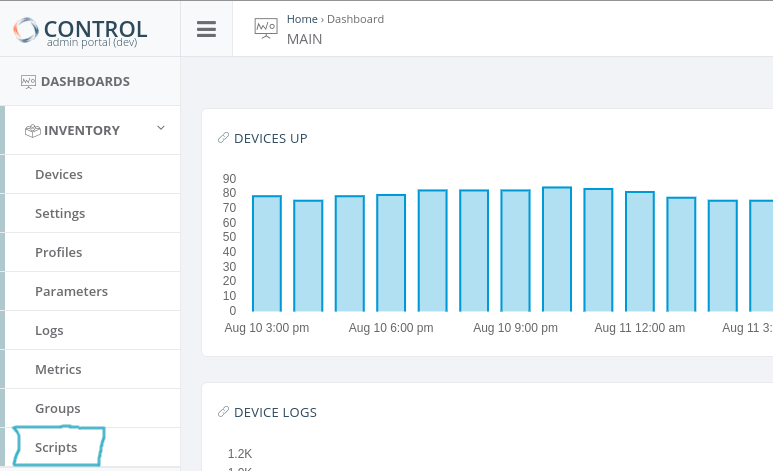](https://docs.zequenze.com/uploads/images/gallery/2021-08/hMAouKWcZkGr8vIL-script-screen.png)
## Configuration Methods
There are two ways to configure inventory scripts:
### Method 1: Script with Device Filter
This method executes a script across multiple devices based on filter criteria.
**Step 1: Create a New Script**
Click **Add New** in the **Inventory scripts** configuration screen:
[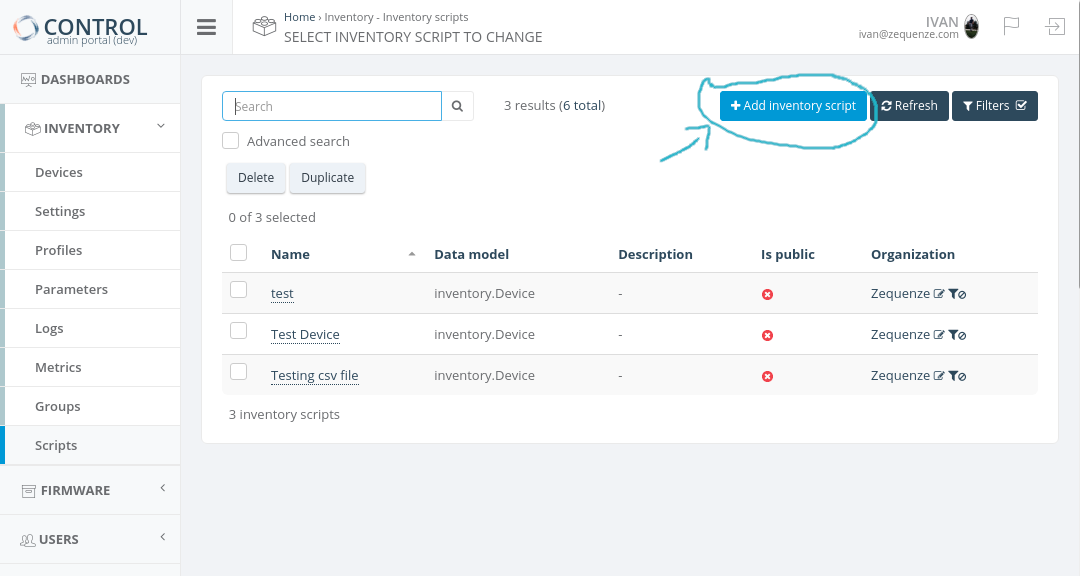](https://docs.zequenze.com/uploads/images/gallery/2021-08/yK05hSqxdknyAqPa-add-new-script-mark.png)
**Step 2: Configure Required Fields**
Complete the following required fields:
1. **Name**: Unique identifier for the script
2. **Data model**: Select "Device"
3. **Organization**: Select the organization (devices will be filtered by this organization)
Click **Save** to continue.
[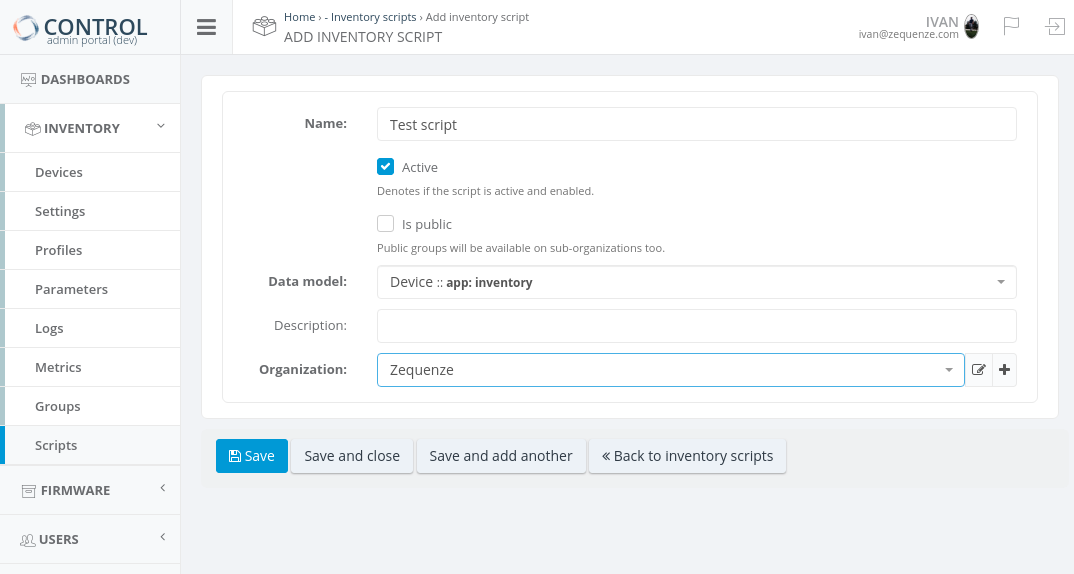](https://docs.zequenze.com/uploads/images/gallery/2021-08/fEaOCtsNT1gHlezP-add-script.png)
**Step 3: Define Script Logic and Filters**
The script editor will appear:
[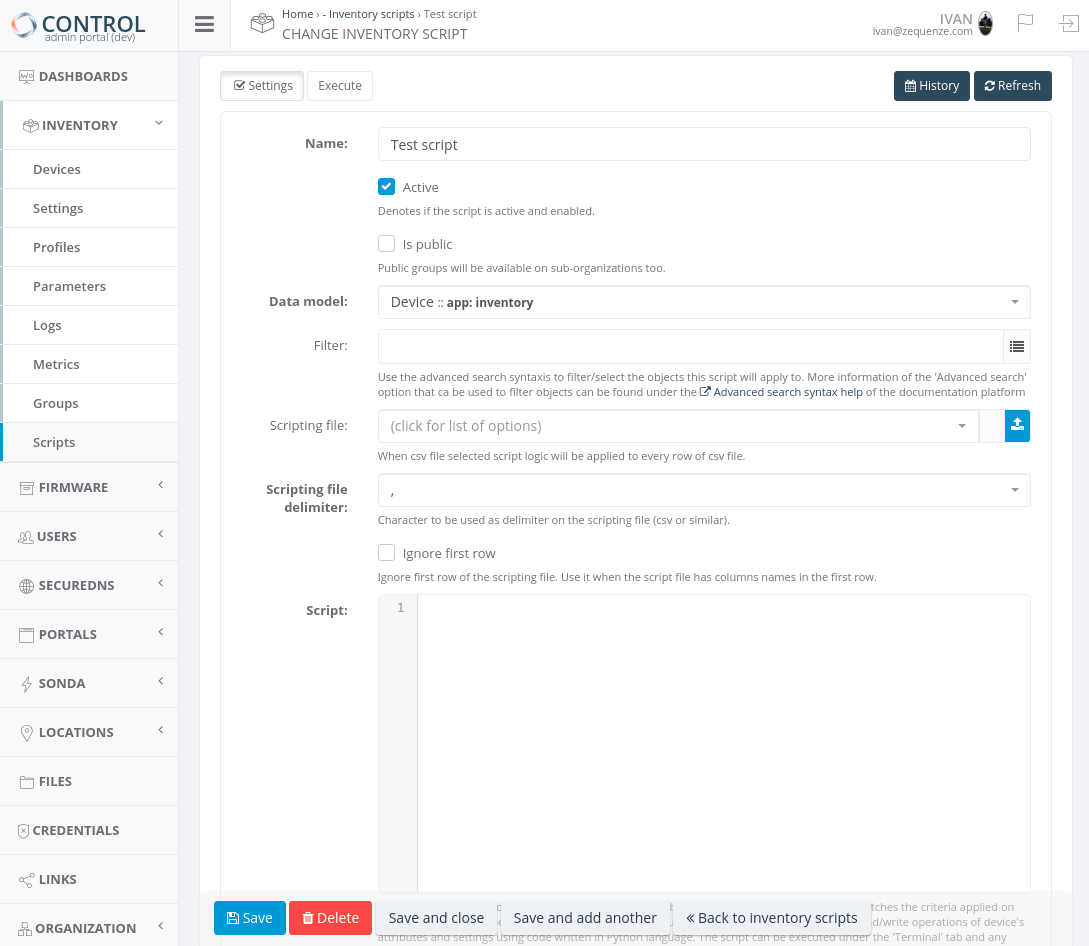](https://docs.zequenze.com/uploads/images/gallery/2021-08/ih6ZjIQcyEy7Akb1-edit-script.png)
- **Script field**: Define your Python code. See [Special Objects for Scripts](https://docs.zequenze.com/books/control/page/special-objects-for-scripts) for examples and available objects.
- **Filter field**: Apply device filters using advanced search syntax. See [Advanced Search Syntax Help](https://docs.zequenze.com/books/zequenze-general/page/advanced-search-syntax-help) for filter configuration details.
### Method 2: Script with CSV File
This method processes devices using data from a CSV file.
**Step 1: Upload or Select CSV File**
In the script configuration screen, locate the **Scripting file** field. Click the blue icon to upload a new CSV file or select an existing one:
[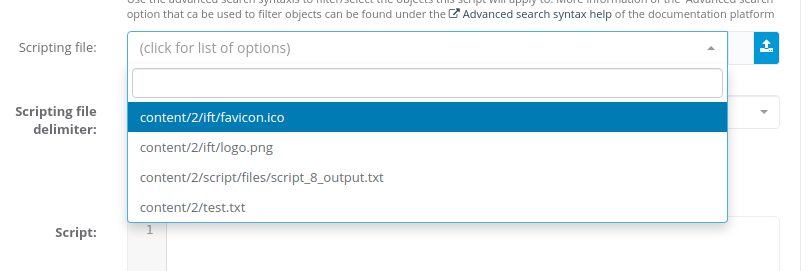](https://docs.zequenze.com/uploads/images/gallery/2021-08/F0qOTQteTNcax4tI-script-file.png)
**Step 2: Configure CSV Settings**
- **Scripting file delimiter**: Specify the delimiter used in your CSV file (comma, semicolon, tab, etc.):
[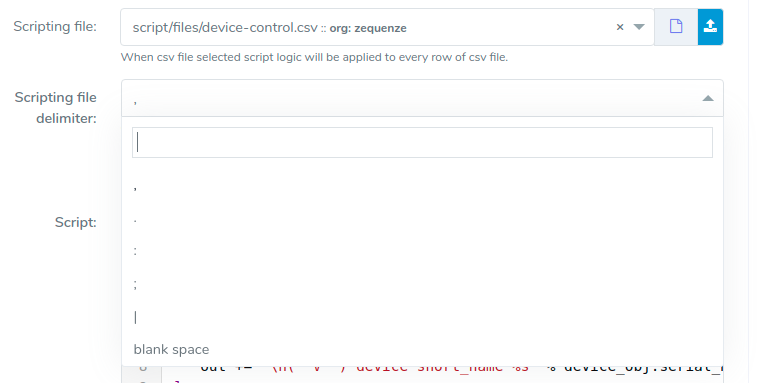](https://docs.zequenze.com/uploads/images/gallery/2021-08/IYtzUqq84Si4vBrc-file-delimiter.png)
- **Ignore first row**: Enable this option if your CSV file contains column headers in the first row:
[](https://docs.zequenze.com/uploads/images/gallery/2021-08/5YTZmjxOHGFYo35m-ignore-file.png)
**Step 3: Write CSV Processing Code**
For information on coding scripts with CSV files, refer to the **csv_row objects** section in [Special Objects for Scripts](https://docs.zequenze.com/books/control/page/special-objects-for-scripts).
## Selecting Devices to Process
TBC
## Script Execution
**Step 1: Access Execution Screen**
Open or create a script, then navigate to the **Execution screen**:
[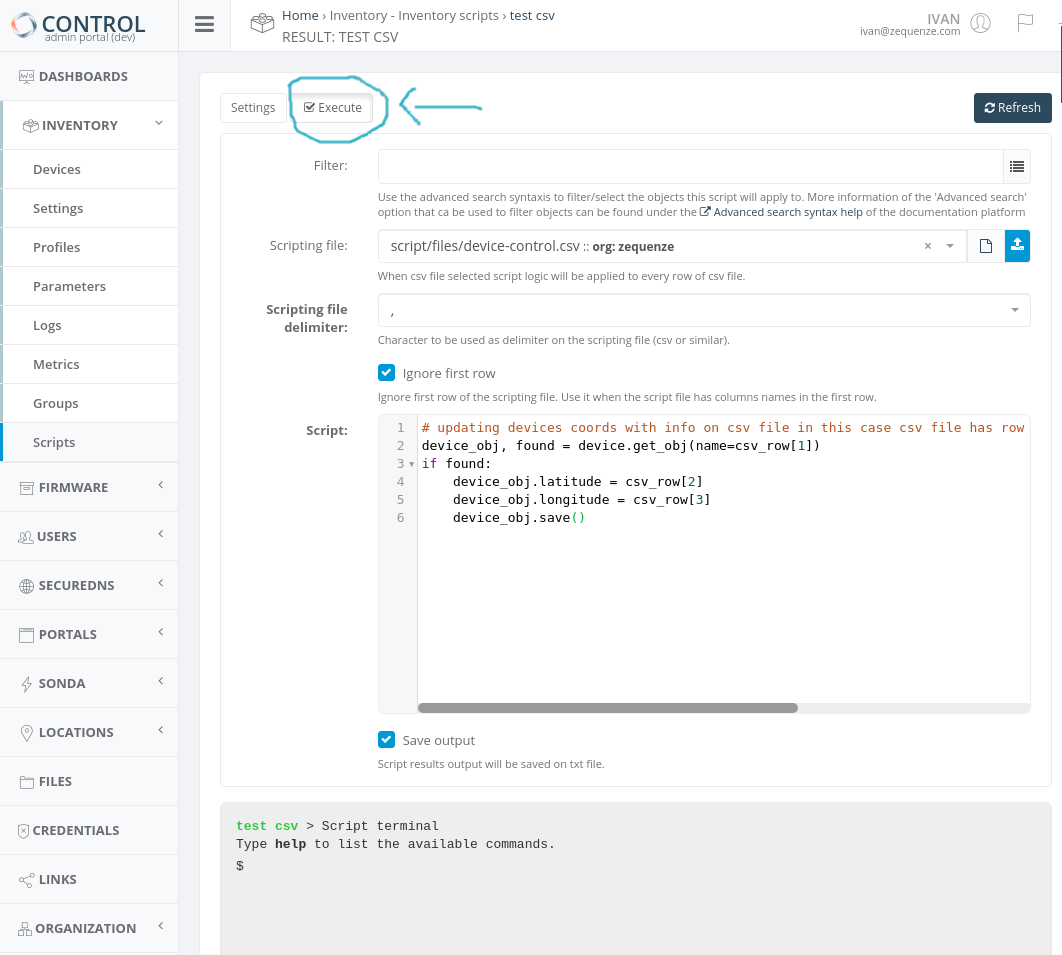](https://docs.zequenze.com/uploads/images/gallery/2021-08/gU5EgW04YY9IQiee-execution-scrren-2.png)
**Step 2: Execute or Manage Script**
At the bottom of the execution screen, use the available buttons:
- **Run**: Execute the script
- **Stop**: Halt script execution
- **Save**: Save changes to the script code
- **Back**: Return to the previous screen
[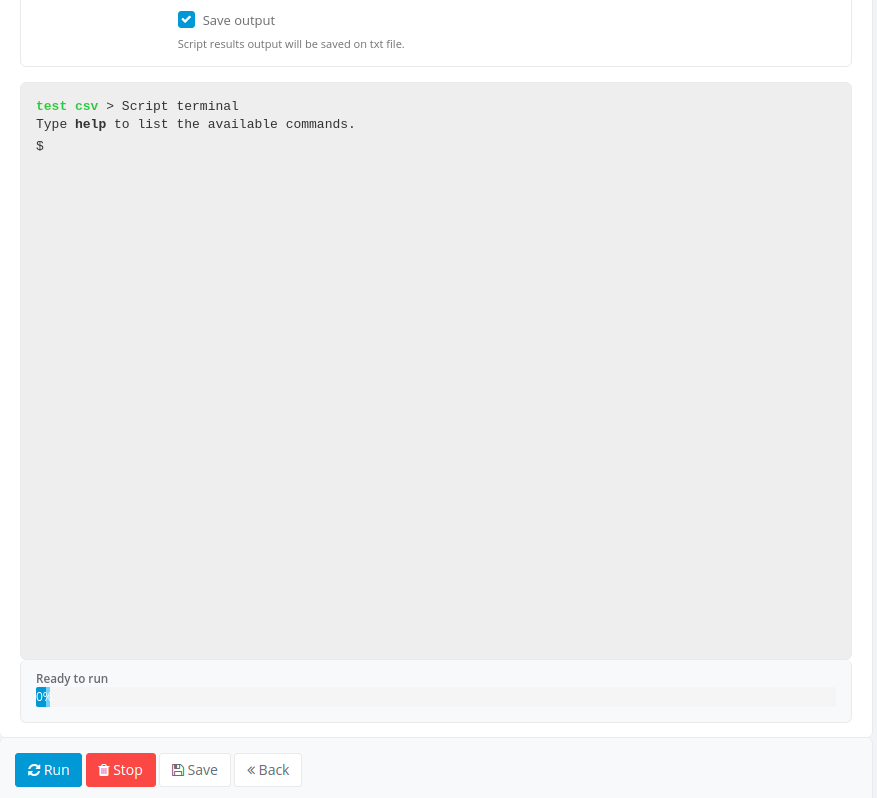](https://docs.zequenze.com/uploads/images/gallery/2021-08/LMtTVCs2ZQN2Wjp7-execute-button.png)
**Step 3: Save Output (Optional)**
Enable the **Save output** option to download execution results as a `.txt` file after the script completes:
[](https://docs.zequenze.com/uploads/images/gallery/2021-08/6XaiwPCFRQhXcHWM-execution.png)
## Python Modules Included
The script execution environment includes the following Python modules by default:
### math
Mathematical functions for advanced calculations.
```python
result = math.log10(value) # Calculate base-10 logarithm of 'value'
result = math.sqrt(value) # Calculate the square root of 'value'
result = math.acos(value) # Calculate the arc cosine of 'value', in radians
result = value * math.pi # Multiply 'value' by the mathematical pi constant
```
More information: [https://docs.python.org/3/library/math.html](https://docs.python.org/3/library/math.html)
### random
Pseudo-random number generation.
```python
result = value + random.randint(1, 10) # Add a random number between 1 and 10 to 'value'
```
More information: [https://docs.python.org/3/library/random.html](https://docs.python.org/3/library/random.html)
### json
JSON encoder and decoder for working with JSON data structures.
```python
result = json.loads(value)['bytes'] # Convert a JSON string to a dictionary and extract the 'bytes' element
```
More information: [https://docs.python.org/3/library/json.html](https://docs.python.org/3/library/json.html)
### version_parser
Software version comparison and validation utilities.
```python
old_version = version_parser('v10.0.0p2')
new_version = version_parser('v10.0.1p1')
if new_version > old_version:
print('Firmware upgrade is necessary')
```
## Special Objects and Actions
The script execution context includes special objects that allow you to:
- Modify **Device** attributes and **Settings**
- Perform device-related operations and actions
For detailed information about available special objects, usage examples, and script processing capabilities, see [Special Objects for Scripts](https://docs.zequenze.com/books/control/page/special-objects-for-scripts).
## Visual Workflow Designer
In some environments, a visual workflow designer is available to build scripts using a graphical interface.
### Disabling Visual Workflow Designer Transformation
To prevent the visual workflow designer from transforming a script, add the following comment on the first line:
```python
# _NO_VWD_
```
## Available Functions and Methods
The following table lists special functions and methods available within inventory scripts:
| Name | Parameters | Description | Example |
|------|------------|-------------|---------|
| **detect_network_entity_info** | `extend` (bool) `device_headers` (dict) `current_val` (dict) `old_val` (dict) `recreate` (bool) `assistant_id` (int) | Retrieves network entity information for a device and extends or returns the current parameter value.
In `device_headers`, specify keys: "mac_address", "dhcp_vendor_class", and "hostname". Defaults to 'MACAddress', 'HostName', and 'VendorClass' if not specified. | ```python previous_table_value, found = device.get(variable_name='beauty_hosts_table') headers = {"mac_address": "MACAddress", "hostname": "HostName", "dhcp_vendor_class": "VendorClassID"} beautify_table = detect_network_entity_info(extend=False, device_headers=headers, current_val=value, old_val=previous_table_value) device.set(variable_name='beauty_hosts_table', value=beautify_table) ``` |
| **device.activate_logs** | None | Enables logging for the device. | `device.activate_logs()` |
| **create_log** | `title` (string) `message` (string) | Creates a script log entry with the specified title and message. | `create_log("Title", "Long description")` |
| **set_result** | `value` (any) | Sets the context parameter value. Equivalent to `result = value`. | `set_result("testvalue")` |
| **set_output_message** | `value` (string) | Sets the output message of the script. | `set_output_message("testvalue")` |
| **extend_output_message** | `value` (string) | Appends the given string to the end of the current output message. | `extend_output_message("testvalue")` |
# Metric collection for Parameters
## Overview
**Metric collection** allows you to store historical information for Parameter values received from managed devices. When enabled, CONTROL automatically captures and stores data points over time, enabling trend analysis and historical reporting.
## Enabling Metric Collection
To activate metric collection for a Parameter:
1. Navigate to the [Parameter configuration screen](/books/control/page/parameter-configuration)
2. Enable the `metric` option
[](https://docs.zequenze.com/uploads/images/gallery/2020-03/Wp89EzDvJnpxeXV9-metric_enable.png)
**Note:** Metric collection is primarily designed for Parameters that return numeric values. For non-numeric Parameters, see the [Non-numeric Parameter Metrics](#bkmrk-non-numeric-metrics) section below.
## Metric Types
CONTROL supports three types of metrics for Parameters: **Absolute** (default), **Counter**, and **Delta**. Each type determines how received values are processed and stored.
[](https://docs.zequenze.com/uploads/images/gallery/2020-03/ETmSgcU4Wl67QJxz-Screenshot-from-2020-03-30-15-49-08.png)
### Absolute Metrics
This metric type stores the exact value received from the device after applying:
- Unit conversions (when configured)
- [Processing scripts](https://docs.zequenze.com/books/control/page/processing-scripts-for-parameters) (when configured)
Use this type when you need to track the actual reported values over time (e.g., temperature, voltage, signal strength).
### Counter Metrics
This metric type stores the **rate of change** between consecutive values. The calculation is:
```
stored_value = (current_value - previous_value) / time_elapsed
```
The calculation is performed after applying:
- Unit conversions (when configured)
- [Processing scripts](https://docs.zequenze.com/books/control/page/processing-scripts-for-parameters) (when configured)
Use this type for continuously incrementing counters where you want to track the rate (e.g., bytes per second, requests per minute).
### Delta Metrics
This metric type stores the **difference** between consecutive values. The calculation is:
```
stored_value = current_value - previous_value
```
The calculation is performed after applying:
- Unit conversions (when configured)
- [Processing scripts](https://docs.zequenze.com/books/control/page/processing-scripts-for-parameters) (when configured)
Use this type when you need to track the absolute change between readings (e.g., change in disk usage, change in user count).
## Visualization of Parameter Metrics
TBC
Non-numeric Parameter Metrics
TBC
# Processing scripts for Parameters
## Overview
**Processing scripts** enable advanced logic integration within communication flows between managed devices and the CONTROL platform. These Python-based scripts implement business logic to transform parameter values before they are processed and stored by the platform.
Processing scripts execute primarily when the CONTROL platform receives a value from the configured parameter. However, they may also run during other operations and actions as detailed below.
## Available Variables
When a processing script executes, the CONTROL platform automatically populates several variables with contextual information:
| Variable | Description |
|----------|-------------|
| `value` | The value of the parameter being received or processed |
| `parameter_name` | The name of the parameter being received or processed |
| `parameter_id` | The unique ID of the parameter being received or processed |
| `variable_name` | The variable name of the parameter being received or processed |
| `operation` | The name of the current operation: `add_object`, `del_object`, or `get_value` |
| `index` | The instance number or index of the object being added |
The platform expects the transformed value to be assigned to a variable named `result`.
### Basic Example
This example applies a mathematical formula to transform the received value:
```python
result = (value - 10) / 10000
```
This script subtracts 10 from the received parameter value, then divides the result by 10,000. The CONTROL platform will use the value stored in `result` instead of the original received value.
## Execution Context
Processing scripts execute in multiple scenarios:
- When the CONTROL platform receives a parameter value from a managed device
- After creating or deleting objects on managed devices
- During operations that modify other parameters and settings
In these contexts, scripts can modify additional parameters, adjust device settings, and trigger management operations as described in the **Special Objects for Scripts** section.
## Python Operators
Processing scripts support standard Python arithmetic operators:
| Operator | Name | Description | Example |
|----------|------|-------------|---------|
| `+` | Addition | Adds values on either side of the operator | `a + b = 30` |
| `-` | Subtraction | Subtracts right-hand operand from left-hand operand | `a - b = -10` |
| `*` | Multiplication | Multiplies values on either side of the operator | `a * b = 200` |
| `/` | Division | Divides left-hand operand by right-hand operand | `b / a = 2` |
| `%` | Modulus | Divides left-hand operand by right-hand operand and returns remainder | `b % a = 0` |
| `**` | Exponent | Performs exponential (power) calculation | `a**2 = 100` |
| `//` | Floor Division | Division where the result is the quotient with digits after the decimal point removed. If one operand is negative, the result is floored (rounded toward negative infinity) | `9//2 = 4`, `9.0//2.0 = 4.0`, `-11//3 = -4`, `-11.0//3 = -4.0` |
**Example variable assignments:**
```python
a = 10
b = 20
```
## Configuration
Processing scripts are configured within the **Parameter** configuration screen. Access this screen by following [these simple steps](https://docs.zequenze.com/books/control/page/parameter-configuration).
### Script Configuration Location
On the **Parameter** configuration screen, locate the script configuration section under **Advanced settings**:
[](https://docs.zequenze.com/uploads/images/gallery/2020-03/8Eax9x1f68NN7nRl-image-1585617863944.png)
## Included Python Modules
The script processing environment includes the following Python modules by default:
### math Module
Provides mathematical functions for advanced calculations.
**Examples:**
```python
result = math.log10(value) # Calculate base-10 logarithm of 'value'
result = math.sqrt(value) # Calculate the square root of 'value'
result = math.acos(value) # Calculate the arc cosine of 'value' in radians
result = value * math.pi # Multiply 'value' by the mathematical pi constant
```
**Reference:** [https://docs.python.org/3/library/math.html](https://docs.python.org/3/library/math.html)
### random Module
Generates pseudo-random numbers.
**Example:**
```python
result = value + random.randint(1, 10) # Add a random number between 1 and 10 to 'value'
```
**Reference:** [https://docs.python.org/3/library/random.html](https://docs.python.org/3/library/random.html)
### json Module
Provides JSON encoding and decoding capabilities.
**Example:**
```python
result = json.loads(value)['bytes'] # Parse JSON string and extract the 'bytes' element
```
**Reference:** [https://docs.python.org/3/library/json.html](https://docs.python.org/3/library/json.html)
## Advanced Capabilities
### Special Objects and Operations
The script execution context includes special objects that allow you to:
- Modify attributes of managed devices
- Update device settings
- Perform related management actions and operations
For detailed information about special objects and usage examples, see the [**Special Objects for Scripts**](https://docs.zequenze.com/books/control/page/special-objects-for-scripts) section.
### Special Functions
| Function | Description | Parameters |
|----------|-------------|------------|
| `detect_network_entity_info` | Retrieves network entity information for a device and optionally extends the current parameter value | `context: dict, extend: bool = False, device_headers: dict or None = None, current_val: str = None, old_val: str = None` |
## Visual Workflow Designer
In certain environments, a visual workflow designer is available to build scripts using a graphical interface.
### Disabling Visual Designer Transformation
To prevent the visual workflow designer from transforming a script, add this comment as the first line:
```python
# _NO_VWD_
```
# Special objects for scripts
## Overview
Special objects are available within processing scripts to provide enhanced management capabilities for **Devices** and their **Settings**. These objects can be referenced directly in your scripts to perform various operations and modify device attributes.
---
## The `device` Object
The script execution context includes a special `device` object that allows you to modify attributes of the managed **Device** and perform related actions and operations.
### Attributes
The `device` object provides the following attributes:
| Name | Type/Access | Description |
|------|-------------|-------------|
| `obj_id` | integer (read-only) | Numeric unique identifier of the current device |
| `name` | string (read-write) | Device name field |
| `customer_id` | string (read-write) | Customer ID field of the current device |
| `type_id` | integer (read-only) | Numeric identifier of the device's profile |
| `organization_id` | integer (read-only) | Numeric identifier of the device's organization |
| `serial_number` | string (read-write) | Serial number field of the current device |
| `serial_number_alt` | string (read-write) | Alternate serial number field of the current device |
| `status` | boolean (read-only) | Operational status of the device |
| `status_change` | datetime (read-only) | Date/time of the last status change |
| `last_connection` | datetime (read-only) | Date/time of the last connection from the device to the platform |
| `update_frequency` | integer (read-write) | Device's update frequency or periodic report interval (in seconds). Changes to this attribute will trigger a connection request |
| `software_version` | string (read-only) | Software version information as reported by the device |
| `hardware_version` | string (read-only) | Hardware version information as reported by the device |
| `address` | string (read-only) | Management address used by the device to connect to the platform |
| `description` | string (read-write) | Description field of the current device |
| `description2` | string (read-write) | Second description field of the current device |
| `description3` | string (read-write) | Third description field of the current device |
| `description4` | string (read-write) | Fourth description field of the current device |
| `reboot` | boolean (read-write) | Activate the 'Reboot' action on the device or detect if a 'Reboot' action is pending |
| `factory` | boolean (read-write) | Activate the 'Factory reset' action on the device or detect if a 'Factory reset' action is pending |
| `device_factory` | boolean (read-write) | Activate the 'Remote (device only) factory reset' action or detect if the action is pending |
| `factory_remote` | boolean (read-write) | Alias for `device_factory`. Activate the 'Remote (device only) factory reset' action or detect if the action is pending |
| `sync` | boolean (read-write) | Activate the configuration 'Synchronization' action with the device or detect if the action is pending |
| `reconf` | boolean (read-write) | Activate the device 'Reconfiguration' action or detect if the action is pending |
| `location_id` | integer (read-write) | Normalized location ID assigned to the device |
| `location_name` | string (read-write) | Non-normalized location name assigned to the device |
| `latitude` | float (read-write) | Latitude geographical coordinate of the device |
| `longitude` | float (read-write) | Longitude geographical coordinate of the device |
| `firmware_image_id` | integer (read-write) | Numeric identifier of the firmware image that can be applied to the device |
| `firmware_image_is_pending` | boolean (read-write) | Indicates whether the configured firmware image will be applied to the managed device |
### Methods
The `device` object provides the following methods:
#### `save()`
Save changes made to the device's read-write attributes.
**Returns:**
- `status` (boolean)
- `message` (string)
**Example:**
```python
status, message = device.save()
```
---
#### `set()`
Change the value of a specified **Parameter** by its `parameter_name`, `variable_name`, or `parameter_id`.
**Parameters:**
- `parameter_name` (string) – Parameter name identifier
- `variable_name` (string) – Variable name identifier
- `parameter_id` (integer) – Numeric parameter identifier
- `value` (string) – New value to set
**Returns:**
- `status` (boolean) – Operation status
- `message` (string) – Operation message
- `created` (boolean) – Whether a new parameter was created
- `changed` (boolean) – Whether the value was changed
- `old_value` (string) – Previous value
**Examples:**
```python
status, message, created, changed, old_value = device.set(parameter_id=100, value='test')
device.set(parameter_name='Device Name', value='test')
device.set(variable_name='Device.SystemID', value='test')
```
---
#### `get()`
Retrieve the value of a specified **Parameter** by its `parameter_name`, `variable_name`, or `parameter_id`.
**Parameters:**
- `parameter_name` (string) – Parameter name identifier
- `variable_name` (string) – Variable name identifier
- `parameter_id` (integer) – Numeric parameter identifier
**Returns:**
- `value` (string) – Parameter value
- `found` (boolean) – Whether the parameter was found
**Examples:**
```python
value, found = device.get(parameter_id=100)
value, _ = device.get(parameter_name="Uptime")
value, _ = device.get(variable_name='Device.SystemID')
```
---
#### `delete()`
Delete a setting from the device database specified by its parameter's `parameter_name`, `variable_name`, or `parameter_id`.
**Parameters:**
- `parameter_name` (string) – Parameter name identifier
- `variable_name` (string) – Variable name identifier
- `parameter_id` (integer) – Numeric parameter identifier
**Returns:**
- `deleted` (boolean) – Whether the parameter was deleted
- `message` (string) – Operation message
**Examples:**
```python
deleted, message = device.delete(parameter_id=100)
device.delete(parameter_name='Uptime')
device.delete(variable_name='Device.SystemID')
```
---
#### `cwmp_set()`
Perform a CWMP SetParameterValues operation on devices managed by CWMP/TR-069.
**Parameters:**
- `variable_name` (string, required) – Variable name to set
- `value` (string, required) – Value to assign
- `variable_type` (string, optional) – Type of parameter (default: `'string'`). Options: `'string'`, `'boolean'`, `'integer'`, `'positive'`
- `log` (boolean, optional) – Enable operation logging (default: `False`)
- `disable_connreq` (boolean, optional) – Disable CWMP connection request after the operation (default: `False`)
**Examples:**
```python
device.cwmp_set(variable_name='Device.SystemID', value='test')
device.cwmp_set(variable_name='Device.SystemID', value='test', variable_type='string', log=True, disable_connreq=True)
```
---
#### `connection_request()`
Perform a connection request to the managed device.
**Parameters:**
- `wait` (boolean, optional) – Wait for connection request response or timeout (default: `False`)
- `sleep_time` (float, optional) – Wait time between operations in seconds (default: `0.05`)
- `type` (string, optional) – Connection request type: `'regular'` or `'light'` (default: `'regular'`)
**Example:**
```python
device.connection_request(wait=False, type='light')
```
---
#### `alert_clear()`
Clear any active alert on the managed device.
**Example:**
```python
device.alert_clear()
```
---
#### `ping()`
Perform an ICMP ping from the platform to the device's management address.
**Parameters:**
- `count` (integer, optional) – Number of packets to send (default: `2`, maximum: `10`)
- `timeout` (integer, optional) – Timeout in seconds (default: `1`, maximum: `10`)
**Returns:**
- `status` (boolean) – Ping operation status
- `message` (string) – Operation message
- `packet_loss` (integer) – Packet loss percentage
**Example:**
```python
status, message, packet_loss = device.ping()
```
---
#### `get_or_create()`
Get or create a device with the specified parameters. Commonly used with the `csv_row` variable.
**Parameters:**
- `name` (string, optional) – Device name
- `serial_number` (string, optional) – Serial number
- `serial_number_alt` (string, optional) – Alternate serial number
- `username` (string, optional) – Username
- `location_id` (integer, optional) – Location ID
**Returns:**
- `device_obj` (device object) – Device object on which you can perform operations
**Examples:**
```python
device_obj = device.get_or_create(name=csv_row[0])
device_obj = device.get_or_create(name="device_name", username="username")
```
---
#### `get_obj()`
Retrieve a device with the specified parameters. Commonly used with the `csv_row` variable.
**Parameters:**
- `name` (string, optional) – Device name
- `serial_number` (string, optional) – Serial number
- `serial_number_alt` (string, optional) – Alternate serial number
- `username` (string, optional) – Username
- `location_id` (integer, optional) – Location ID
- `organization_id` (integer, optional) – Organization ID
**Returns:**
- `found` (boolean) – Whether the device was found
**Note:** When a device is found, the `device` variable is converted to the corresponding device object.
**Examples:**
```python
found = device.get_obj(name=csv_row[0])
found = device.get_obj(name="device_name", username="username")
```
---
#### `delete_obj()`
Delete the current device object.
**Returns:**
- `deleted` (boolean) – Whether the device was deleted
**Example:**
```python
deleted = device.delete_obj()
```
---
#### `update_location()`
Update or clear the device location.
**Parameters:**
- `id` (integer, optional) – Location ID
- `name` (string, optional) – Location name
- `short_name` (string, optional) – Location short name
**Returns:**
- `updated` (boolean) – Whether the location was updated
- `message` (string) – Operation message
**Examples:**
```python
updated, message = device.update_location(name="Location name")
updated, message = device.update_location(short_name="loc-short-name")
# Clear the current location
updated, message = device.update_location()
```
---
#### `group_list()`
List the groups the device belongs to.
**Parameters:**
- `short_name` (boolean, optional) – Return short names instead of IDs (default: `False`)
**Returns:**
- `group_list` (list) – List of group IDs or short names
**Examples:**
```python
group_list = device.group_list()
group_list = device.group_list(short_name=True)
```
---
#### `group_add()`
Add the device to a specified group.
**Parameters:**
- `id` (integer, optional) – Group ID
- `short_name` (string, optional) – Group short name
**Returns:**
- `updated` (boolean) – Whether the device was added to the group
- `message` (string) – Operation message
**Examples:**
```python
updated, message = device.group_add(id=45)
updated, message = device.group_add(short_name="group-short-name")
```
---
#### `group_remove()`
Remove the device from a specified group.
**Parameters:**
- `id` (integer, optional) – Group ID
- `short_name` (string, optional) – Group short name
**Returns:**
- `updated` (boolean) – Whether the device was removed from the group
- `message` (string) – Operation message
**Examples:**
```python
updated, message = device.group_remove(id=45)
updated, message = device.group_remove(short_name="group-short-name")
```
---
### Script Examples
**Example 1: Update device description and set parameter**
```python
result = value
device.description = value
device.save()
status, message, created, changed, old_value = device.set(variable_name='Device.SystemID', value=value)
if changed:
device.connection_request()
```
**Example 2: Update alternate serial number based on variable name**
```python
result = value
if variable_name == 'Device.X_LTE_INFO.imei':
device.serial_alt = value
device.save()
```
**Example 3: Build description from multiple parameters**
```python
result = value
if variable_name == 'Device.SystemInfo.Manufacturer':
imsi = device.get(variable_name='Device.X_LTE_INFO.imsi')
if imsi:
device.description2 = '%s - imsi: %s' % (value, imsi)
else:
device.description2 = value
device.save()
```
**Example 4: Conditional connection request based on ping results**
```python
if device.status is False:
ping_status, ping_message, ping_packet_loss = device.ping()
if ping_status is True and ping_packet_loss < 50:
# Send connection request if the device is reachable and packet loss is less than 50%
device.connection_request()
```
---
## The `csv_row` Object
When a script is executed over a CSV file, the code defined in the **script** field is applied to every row of the CSV file. The `csv_row` object (array) is available within the script context, containing the values from the current row.
### CSV Processing Example
The following example demonstrates updating device coordinates from a CSV file with the format: `[device_name, latitude, longitude]`
```python
# Updating device coordinates with info from CSV file
# CSV format: [device_name, latitude, longitude]
# Look up the device using the serial number (or "name")
found = device.get_obj(serial_number=csv_row[0])
latitude = csv_row[1]
longitude = csv_row[2]
if found:
# Set latitude and longitude
device.latitude = latitude
device.longitude = longitude
# Save changes
device.save()
# Show success message
out = "Updated the coordinates on Device: %s" % csv_row[0]
else:
# Device not found
out = "Not found serial_number: %s" % csv_row[0]
```
# Alfred Assitants
## Introduction
An **Assistant** is an advanced AI-based entity capable of performing specific tasks autonomously based on the rules and instructions provided during its configuration. Assistants in CONTROL allow you to define and customize behavior, capabilities, and data interpretation logic, including unique identity, functionalities, and structured response formats.
**OpenAI Integration:** Alfred assistants that use an OpenAI model are synchronized with OpenAI Assistants, automatically creating and updating each instance when required.
---
## Assistant Configuration Fields
[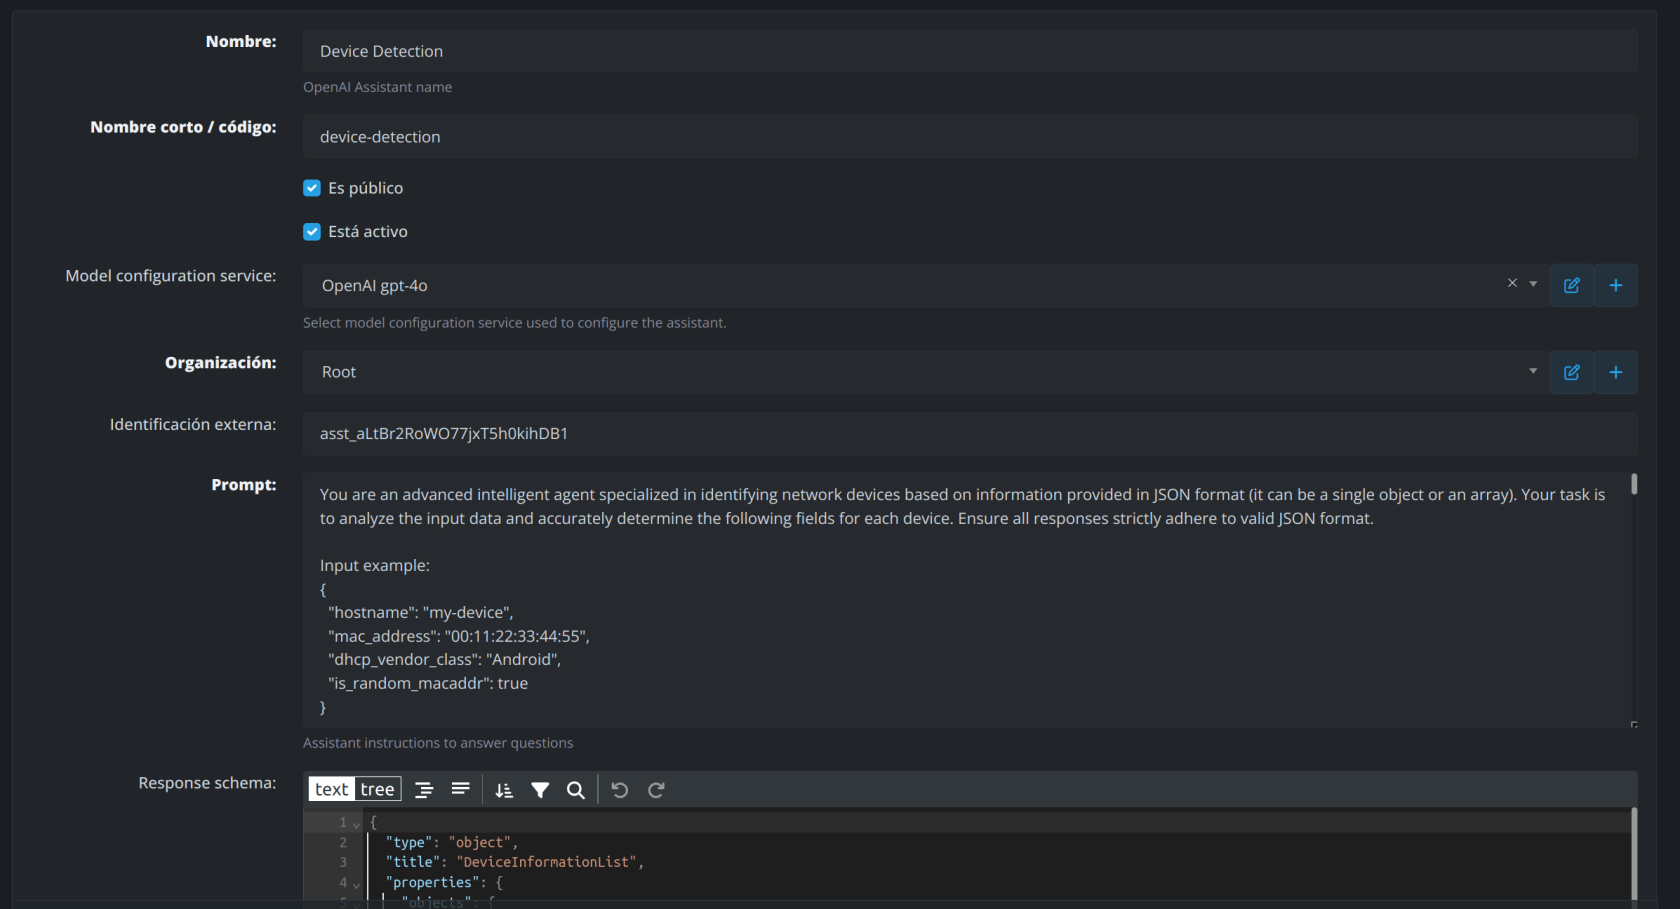](https://docs.zequenze.com/uploads/images/gallery/2024-12/odqYSJzsxLS9YQrz-captura-desde-2024-12-02-21-25-05.png)
### 1. Name
The display name of the assistant, representing its purpose or functionality.
- **Example:** `Device Detection`
### 2. Short Name / Code
A concise identifier or code for the assistant, used for easy reference in systems and API calls.
- **Example:** `device-detection`
### 3. Model Configuration Service
Defines the AI model or engine the assistant utilizes for processing tasks. These are configured as Alfred services.
- **Example:** `OpenAI GPT-4`
### 4. Organization
Specifies the organization or team responsible for the assistant.
- **Example:** `Root`
### 5. External Identification
A unique identifier assigned to the assistant for external integration or tracking purposes.
- **Example:** `asst_altBr2RoWO77jxT5h0kihDB1` (OpenAI Assistant ID)
### 6. Prompt
Instructions provided to the assistant that define its core behavior and task scope. This ensures the assistant interprets and processes data accurately according to your requirements.
- **Example:**
```
You are an intelligent assistant that provides answers about Sports in JSON format
```
### 7. Response Schema
Defines the structure and format of the assistant's output to ensure responses conform to valid JSON or other required formats.
- **Example:**
```json
{
"type": "object",
"title": "DeviceInformationList",
"properties": {
"hostname": {
"type": "string"
},
"mac_address": {
"type": "string"
},
"dhcp_vendor_class": {
"type": "string"
},
"is_random_macaddr": {
"type": "boolean"
}
}
}
```
---
## Integration Guide: `ask_to_assistant` Function
The `ask_to_assistant` function enables communication with AI-powered assistants, allowing developers to query assistants and receive intelligent responses programmatically.
### Function Signature
```python
def ask_to_assistant(
question: str,
id: int = None,
short_name: str = None,
organization_id: int = None,
related_object = None,
related_object_name = None,
related_object_id = None,
check_answers = False
)
```
### Parameters
#### Required Parameter
- **`question`** (`str`)
The query or prompt to send to the assistant.
#### Optional Parameters
- **`id`** (`int`)
The unique ID of the assistant to query.
- **`short_name`** (`str`)
The short name/code of the assistant to query.
- **`organization_id`** (`int`)
The ID of the organization to which the assistant belongs.
- **`related_object`** (`Any`)
An optional object associated with the query (e.g., related to a specific feature or module).
- **`related_object_name`** (`str`)
The name of the related object.
- **`related_object_id`** (`int`)
The ID of the related object.
- **`check_answers`** (`bool`)
If `True`, checks for previously stored answers to avoid duplicate queries and improve performance.
### Return Value
- **`str`** or **`None`**
Returns the assistant's response based on the given query. Returns `None` if no assistant is found.
### How It Works
1. **Retrieve the Assistant**
The function uses `Assistant.objects.get_default_assistant` to fetch the desired assistant based on the provided `id`, `short_name`, or `organization_id`.
2. **Check for Previous Answers** (Optional)
If `check_answers` is set to `True`, the function checks if there is a previously saved answer for the same question. If found, it returns that cached answer.
3. **Log the Request**
A log entry is created using `upsert_log` to track the request details and status.
4. **Call the Appropriate Model Service**
Based on the assistant's configuration:
- **OpenAI models** (`openai-model-config`): Calls `ask_to_openai_assistant` with the assistant's `external_id` and API key.
- **Groq models** (`groq-model-config`): Calls `ask_to_groq_assistant` with the assistant's model settings and API key.
5. **Update the Log**
The log is updated with the assistant's response, tokens used, and execution delay.
6. **Return the Response**
The final answer is returned to the caller.
### Example Usage
#### Querying an Assistant by Short Name
```python
response = ask_to_assistant(
question="What is the weather forecast today?",
short_name="forecast-assistant"
)
```
#### Querying with Related Object Context
```python
response = ask_to_assistant(
question="Analyze this device configuration",
short_name="device-detection",
related_object_name="NetworkDevice",
related_object_id=12345,
check_answers=True
)
```
---
## Alfred Assistant Logs
Each question performed to a specific assistant generates detailed execution logs. These logs allow you to monitor assistant performance, track token usage, and troubleshoot issues.
[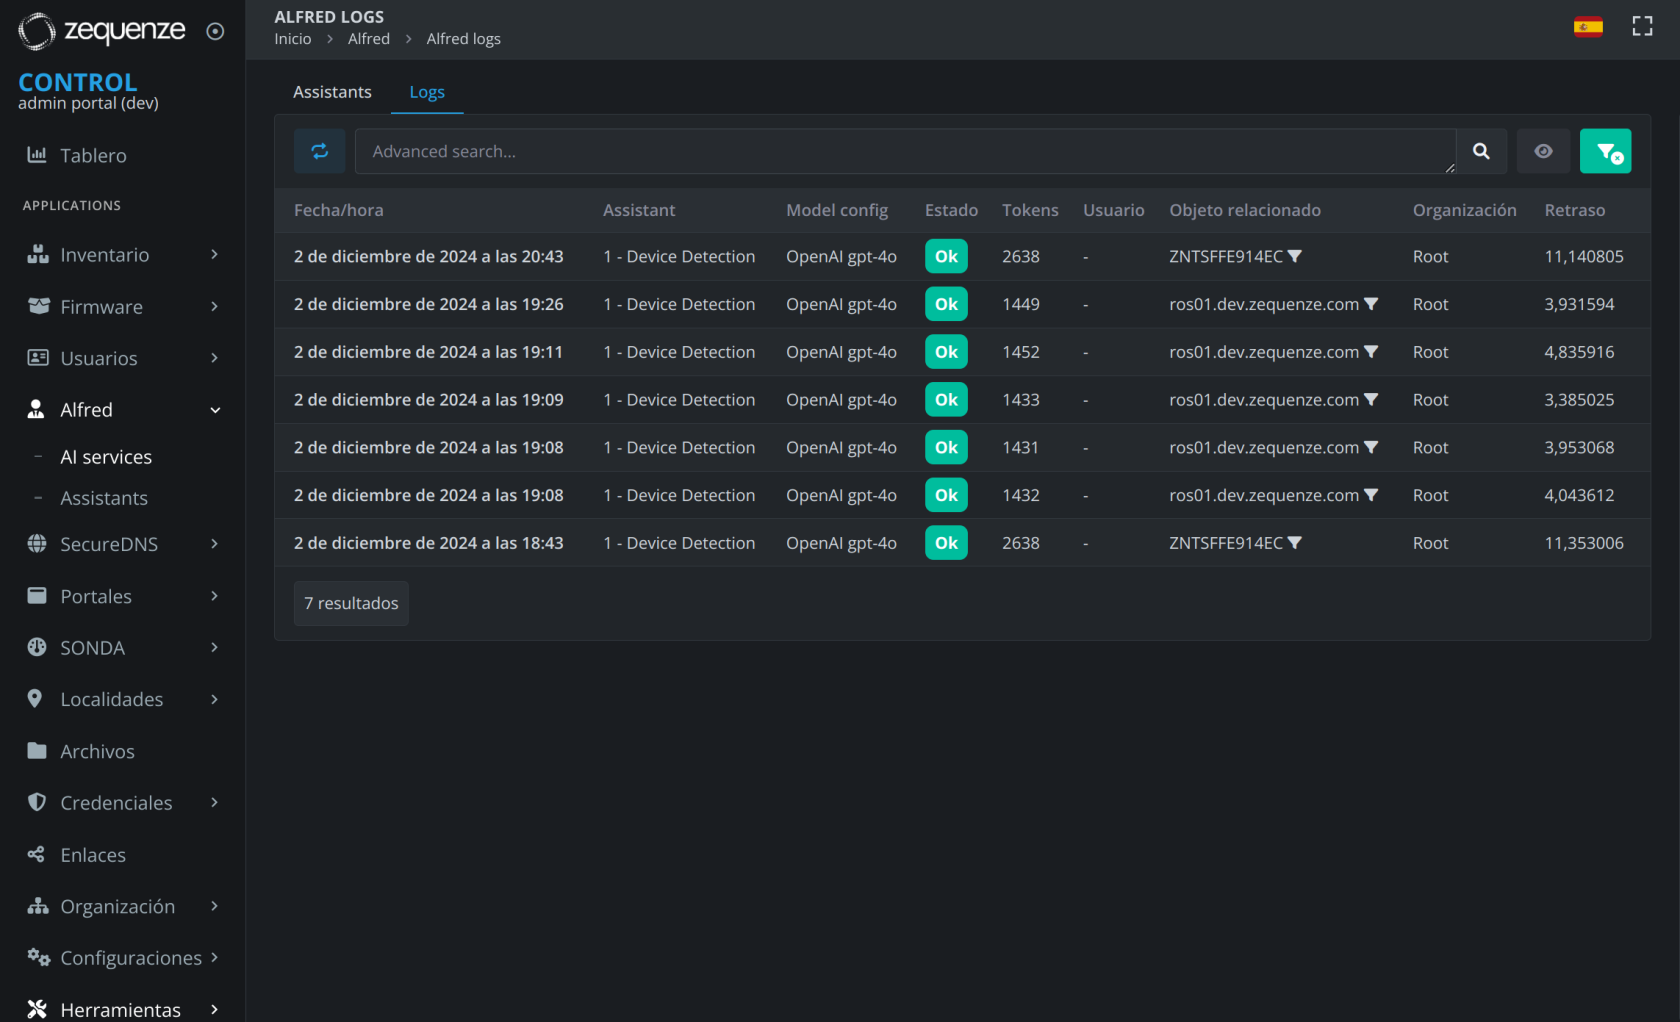](https://docs.zequenze.com/uploads/images/gallery/2024-12/H9rd0JVVvak19Y7U-captura-desde-2024-12-02-21-47-45.png)
[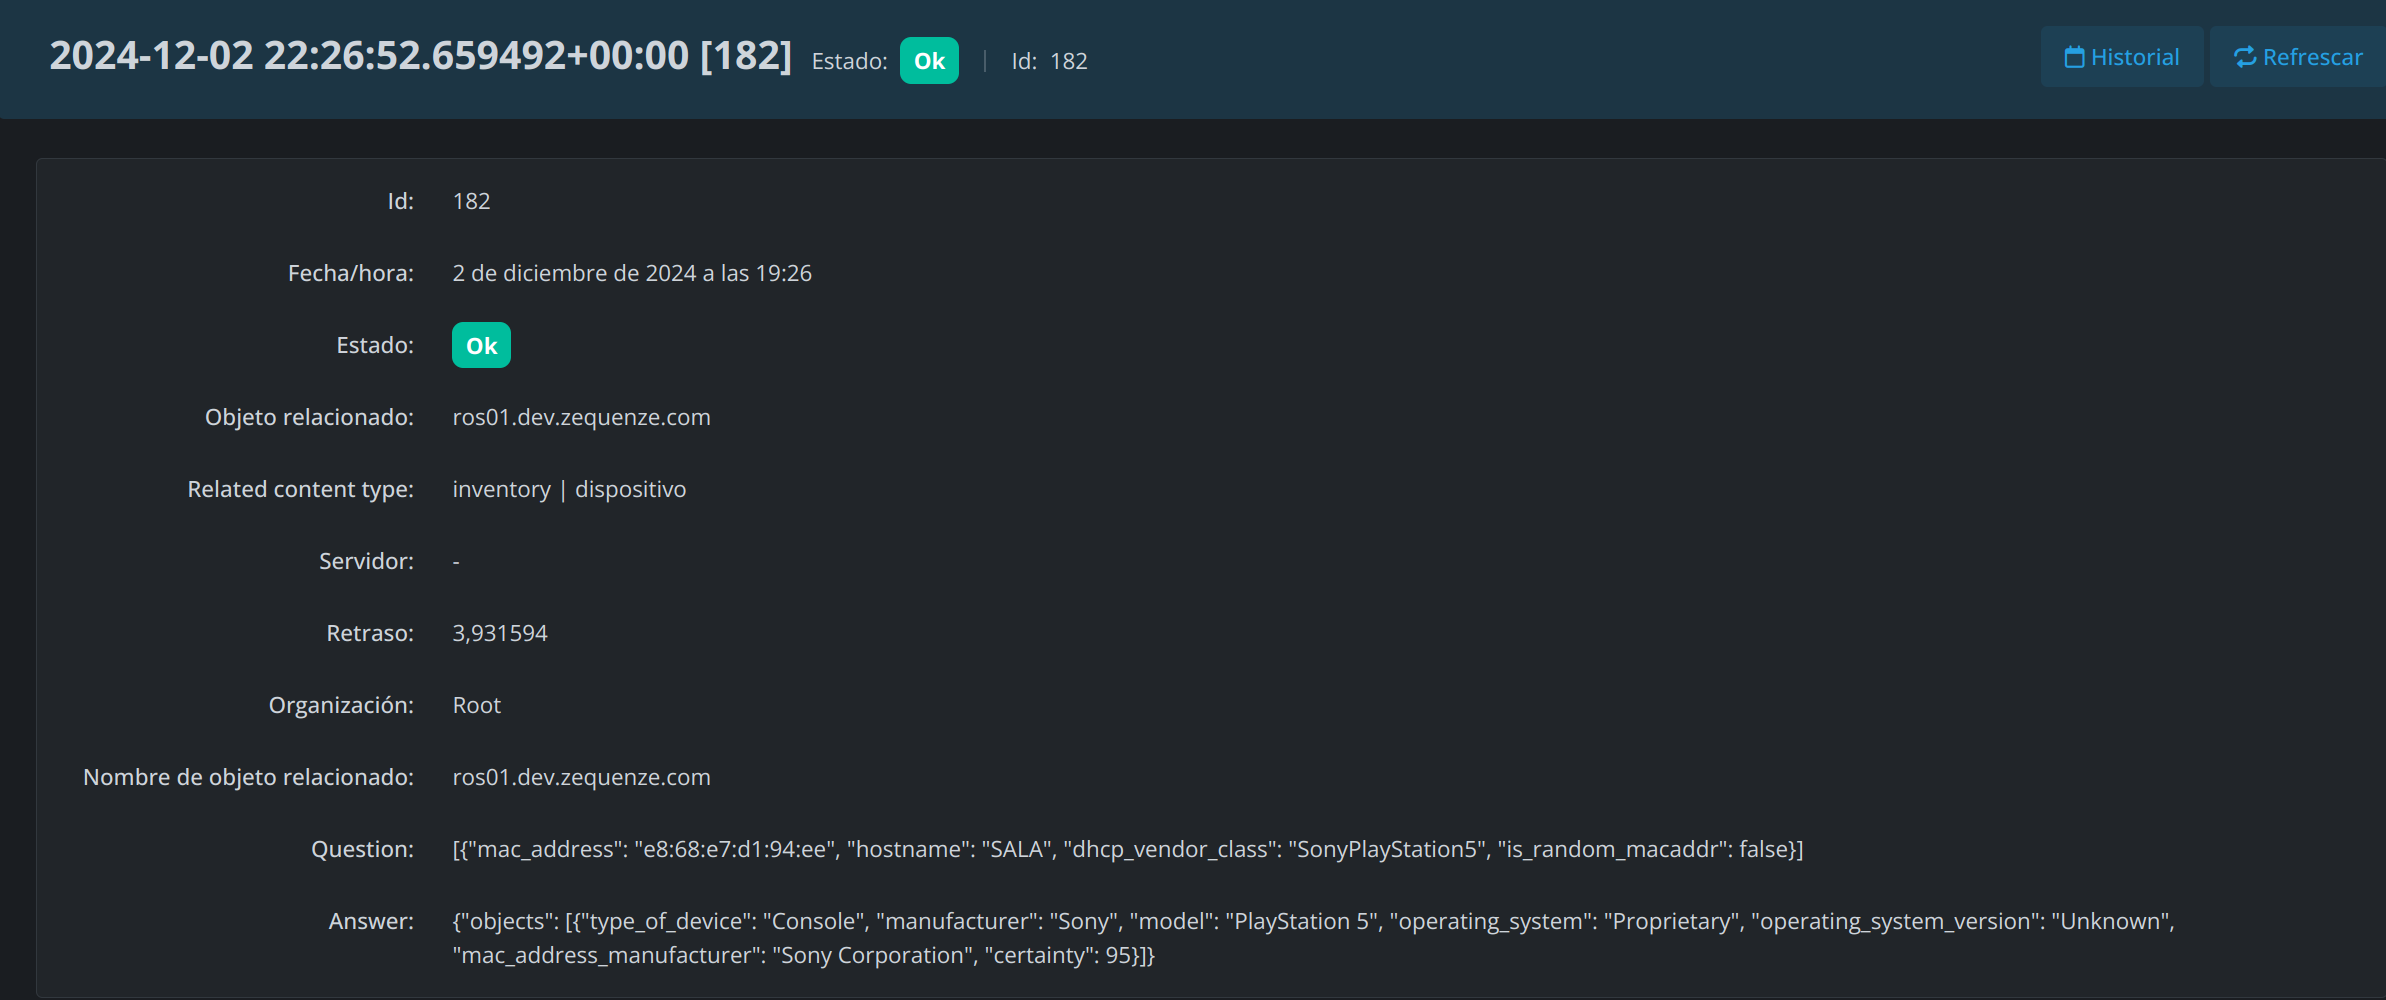](https://docs.zequenze.com/uploads/images/gallery/2024-12/NI3tcxbcuCCLcYTy-captura-desde-2024-12-02-21-48-05.png)
### Log Information
Assistant logs provide visibility into:
- **Request details**: Question asked, assistant used, and timestamp
- **Response data**: Answer provided by the assistant
- **Performance metrics**: Token usage and execution time
- **Related objects**: Associated entities or context for the query
- **Status**: Success or error information
# Service Status Cards
# Service Status Cards
## Overview
The Service Status Cards feature in CONTROL enables real-time monitoring of device services and WAN interface status through customizable dashboard cards. These cards display operational data retrieved from TR-181 or TR-098 parameters, providing instant visibility into your network infrastructure.
*Figure: Services in healthy state*
[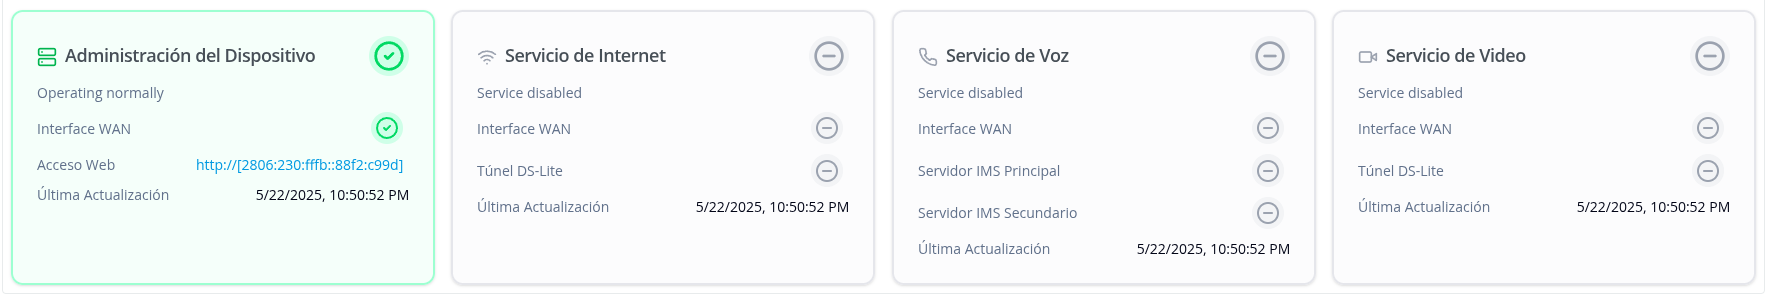](https://docs.zequenze.com/uploads/images/gallery/2025-05/W9uiq7y32VS9KyN9-1-3-services-status-cards.png)
*Figure: Services in disabled state*
[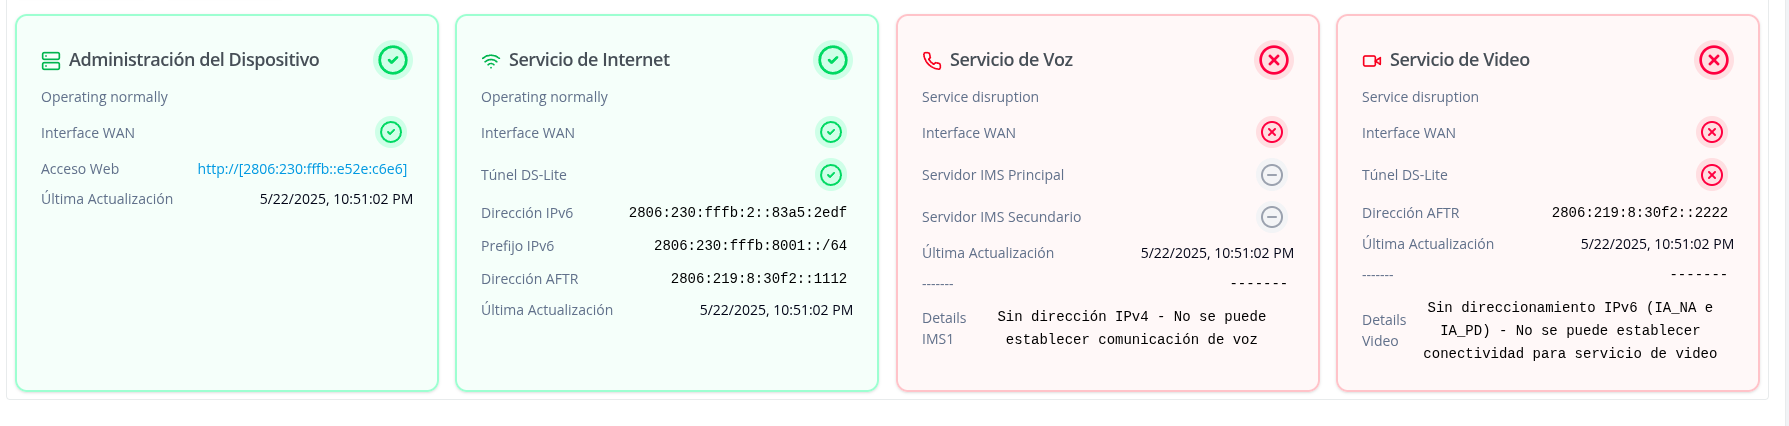](https://docs.zequenze.com/uploads/images/gallery/2025-05/viGoej8yXAQHZaQr-1-2-services-status-cards.png)
*Figure: Services showing disruption or failure*
## Available Service Cards
The platform provides four types of service status cards:
- **Device Management** — Displays device operational status and WAN interface connectivity. Shows IPv6 addressing for ACS communication and provides direct web access to the device interface.
- **Internet Service** — Monitors internet connectivity status with detailed IPv6 addressing (IA_NA and IA_PD) and DS-Lite tunnel configuration for IPv4 connectivity.
- **Voice Service** — Tracks VoIP service status including IMS server configuration (primary and secondary), telephony line registration, and SIP parameters.
- **Video Service** — Monitors video streaming service status with dedicated DS-Lite tunnel and IPv6 configuration separate from internet service.
---
## Configuration Guide
### Step 1: Navigate to Device Profiles
Access the profiles section where you'll configure the monitoring script:
1. From the left navigation menu, click **Inventory**
2. Select **Profiles** from the submenu
3. Locate and select your target profile from the list (e.g., "F689V9-Zequenze")
[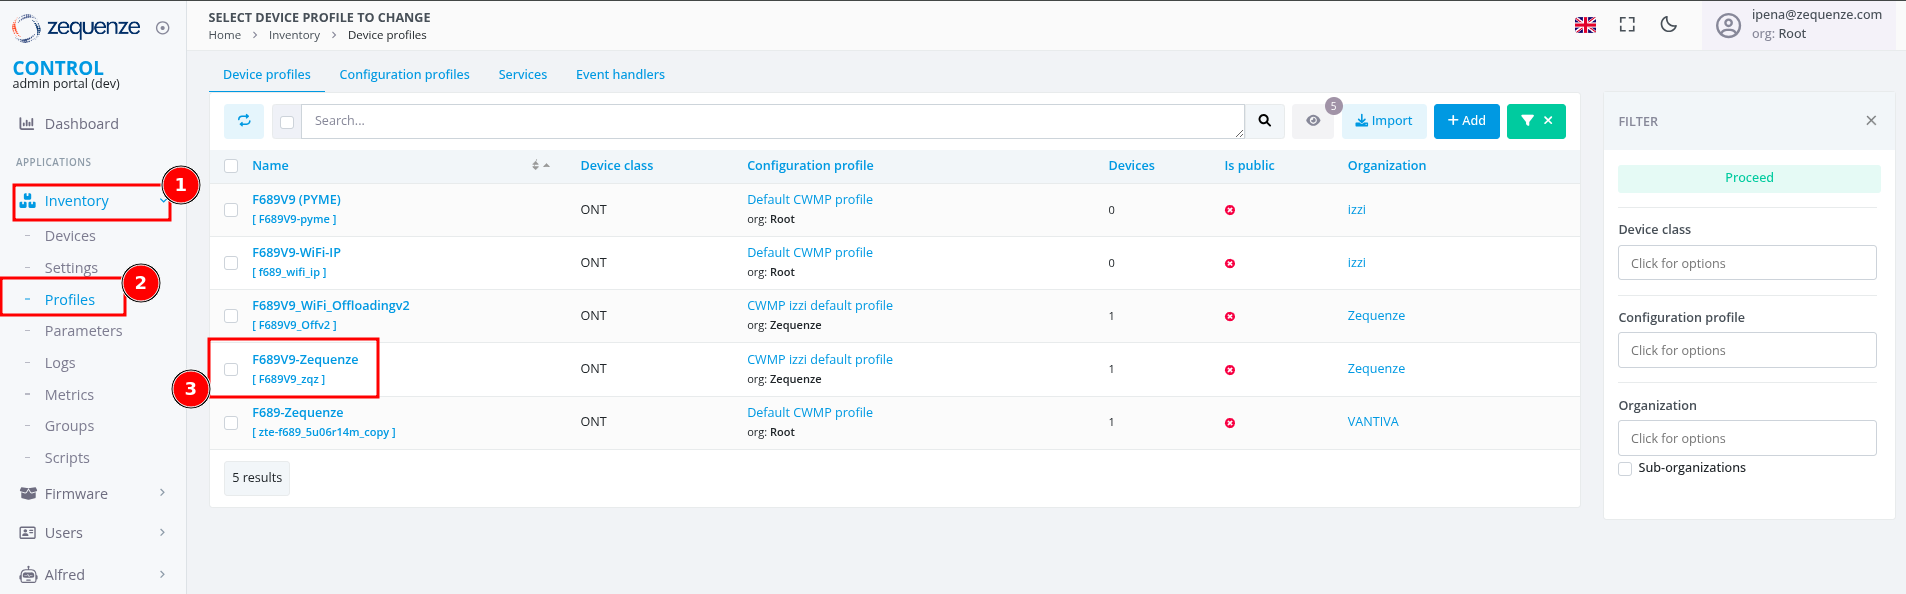](https://docs.zequenze.com/uploads/images/gallery/2025-05/3xQqVScayvEIDaku-1-1-profiles.png)
*Figure 1: Device profile selection interface*
### Step 2: Access Profile Scripts
Locate the script configuration area within the profile:
1. Scroll to the bottom of the profile configuration page
2. Find the **Profile scripts** section
3. Click the **+Add** button to create a new script entry
[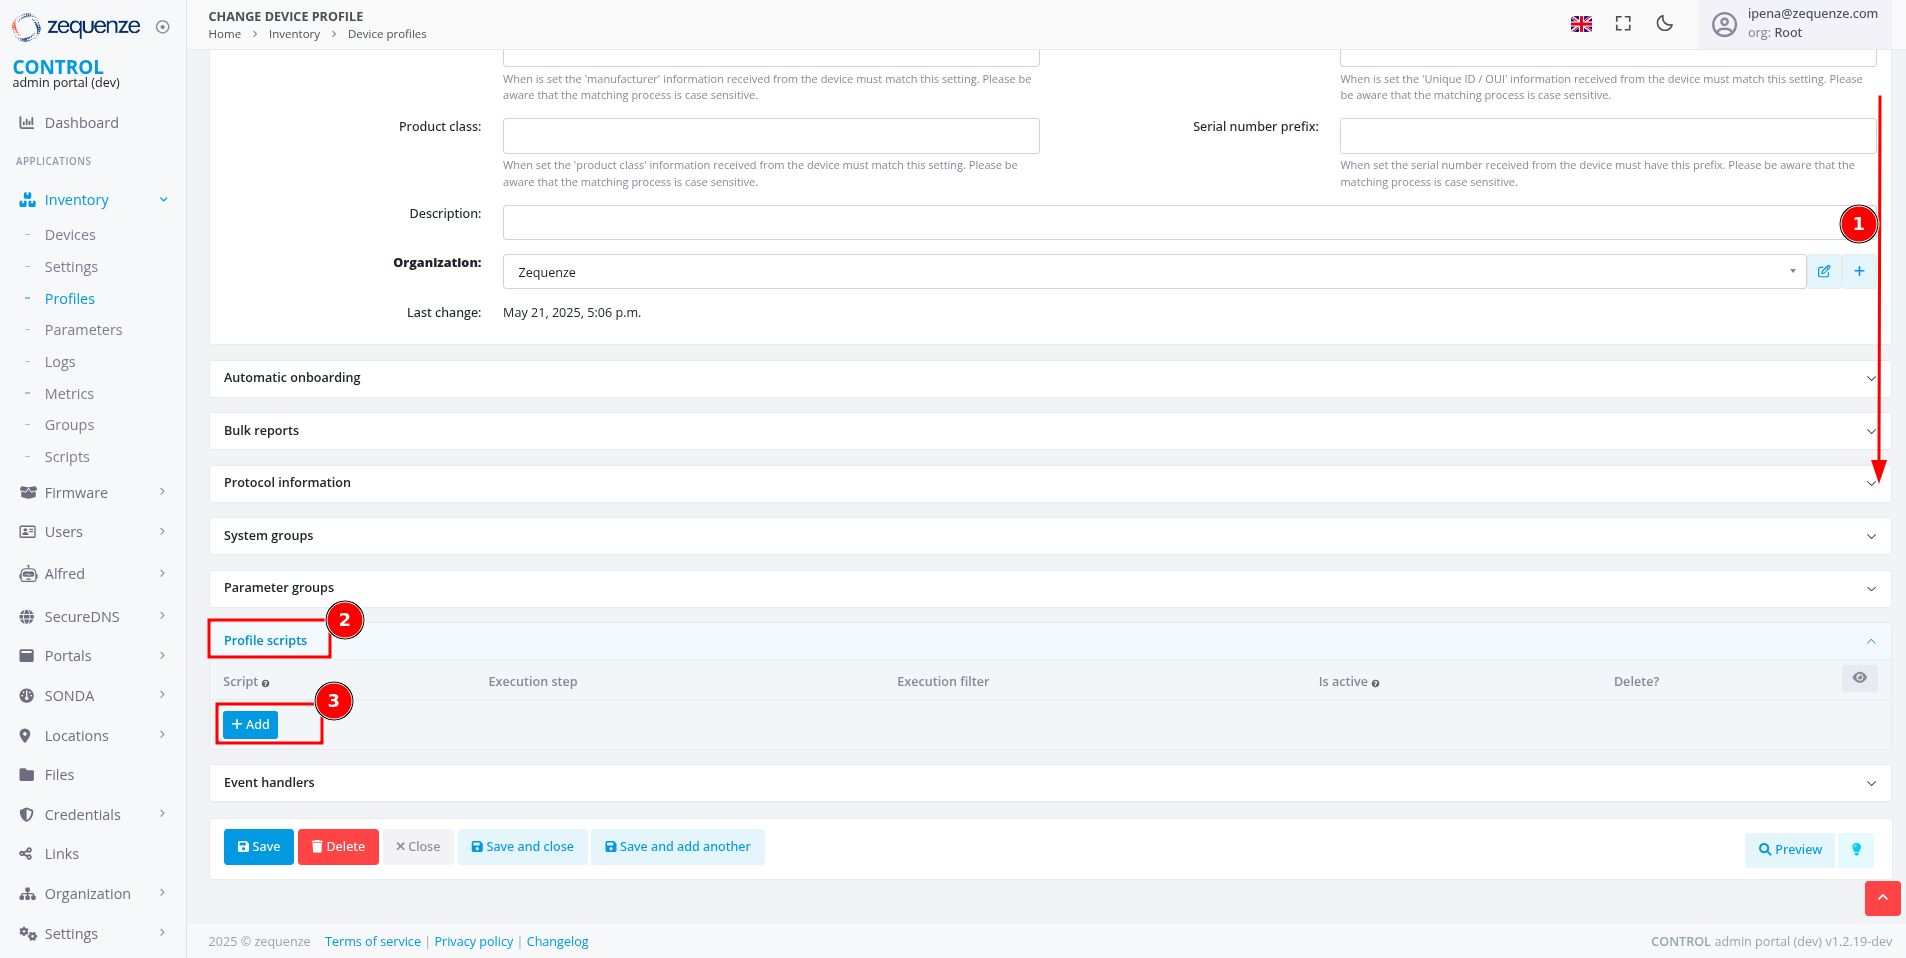](https://docs.zequenze.com/uploads/images/gallery/2025-05/hFXEk7QpLfIAI8ge-1-2-profiles-scripts.png)
*Figure 2: Profile scripts configuration section*
### Step 3: Create New Script Entry
Initialize a new script for service monitoring:
1. In the new script line that appears, click the **+** icon
2. The script creation dialog will open
[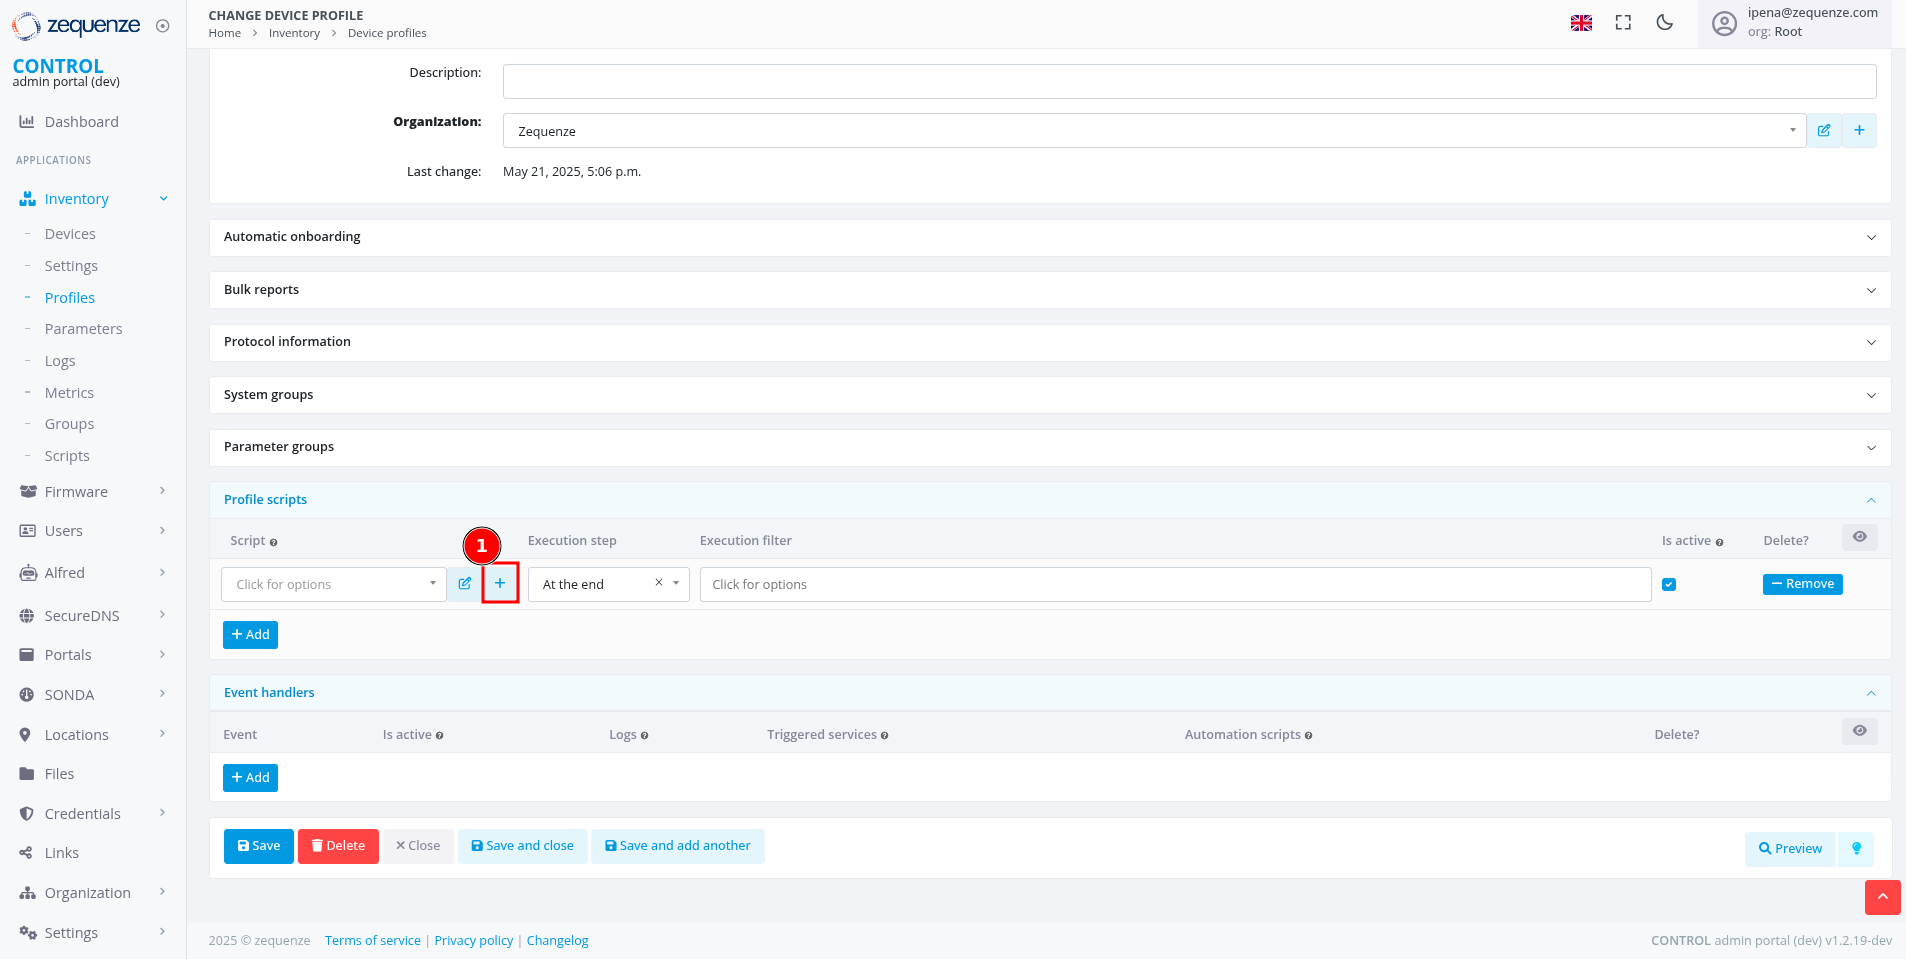](https://docs.zequenze.com/uploads/images/gallery/2025-05/HtngujsYlCFefKgT-1-3-profiles-scripts.png)
*Figure 3: Creating a new script entry*
### Step 4: Configure Script Properties
Define the basic script parameters:
1. **Name**: Enter a descriptive name (e.g., "Script_Global")
2. **Script type**: Select **Profile** from the dropdown
3. **Organization**: Verify the organization matches your profile
4. Click **Save and close**
[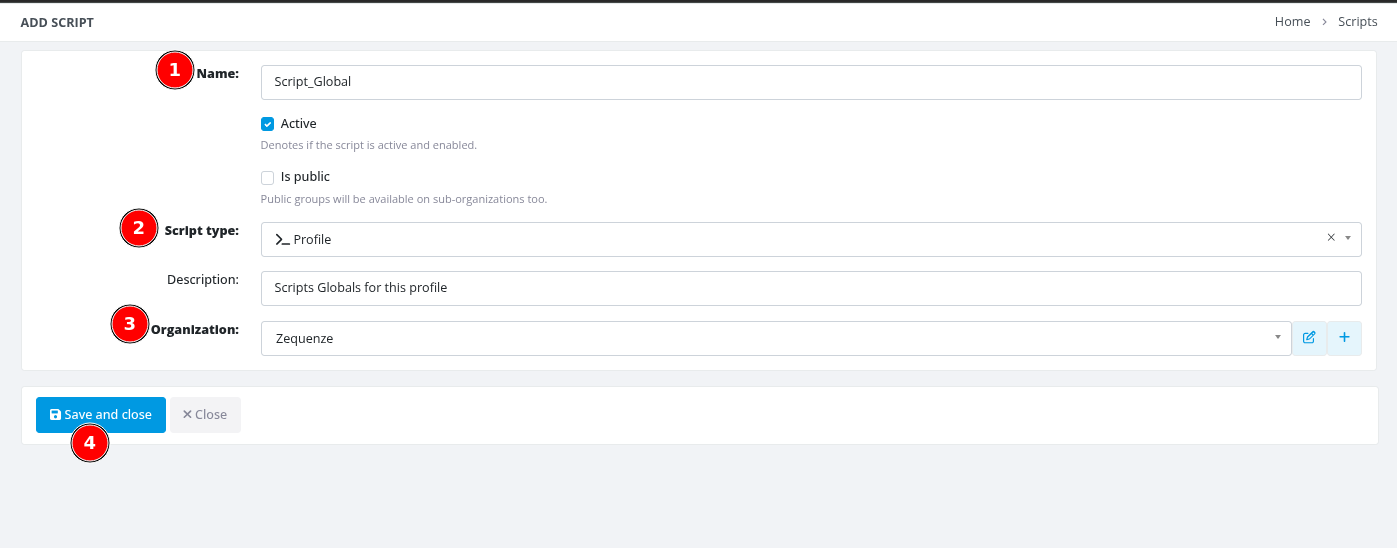](https://docs.zequenze.com/uploads/images/gallery/2025-05/CQ3XerdL4COueyZu-1-4-profiles-scripts.png)
*Figure 4: Script properties configuration dialog*
### Step 5: Save Profile Configuration
Apply the script association to the profile:
1. Return to the main profile configuration page
2. Click **Save** to apply the changes
[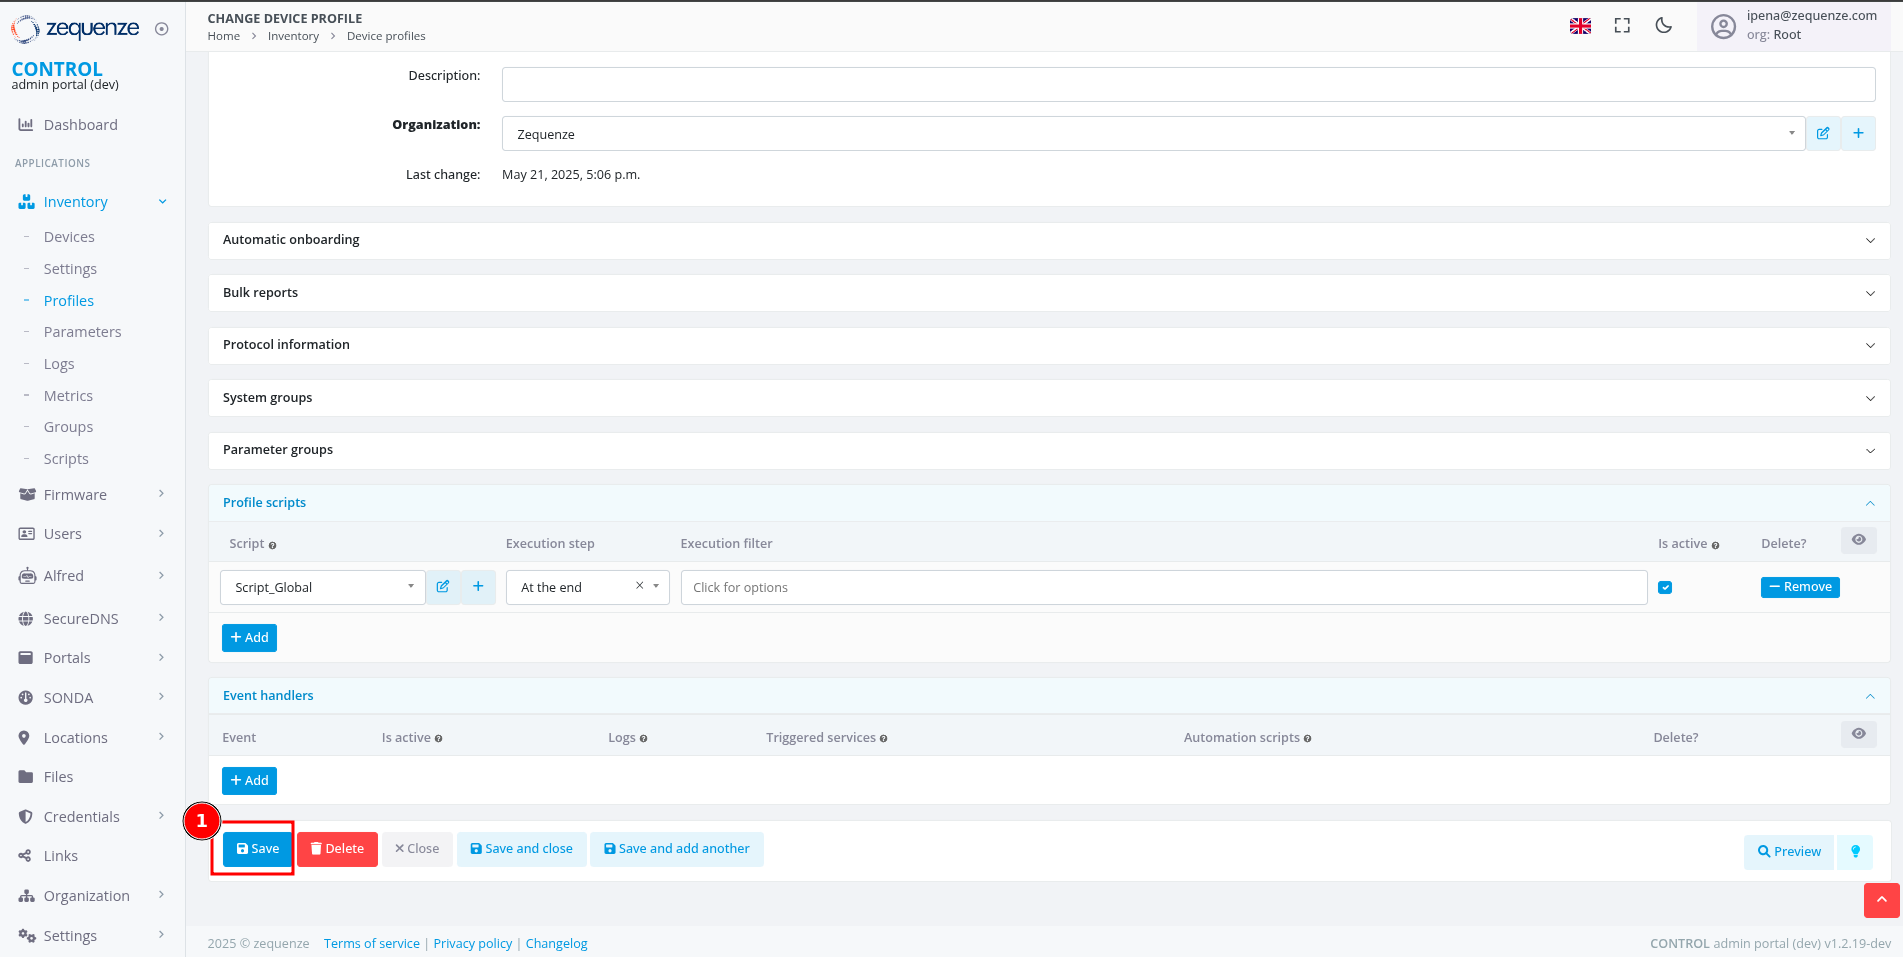](https://docs.zequenze.com/uploads/images/gallery/2025-05/EPMAb1kiEw0PRT2x-1-5-profiles-scripts.png)
*Figure 5: Saving profile configuration*
### Step 6: Access Script Editor
Open the script editor to implement the monitoring logic:
1. Click the **Edit** button (pencil icon) next to your script
2. The script editor interface will open
[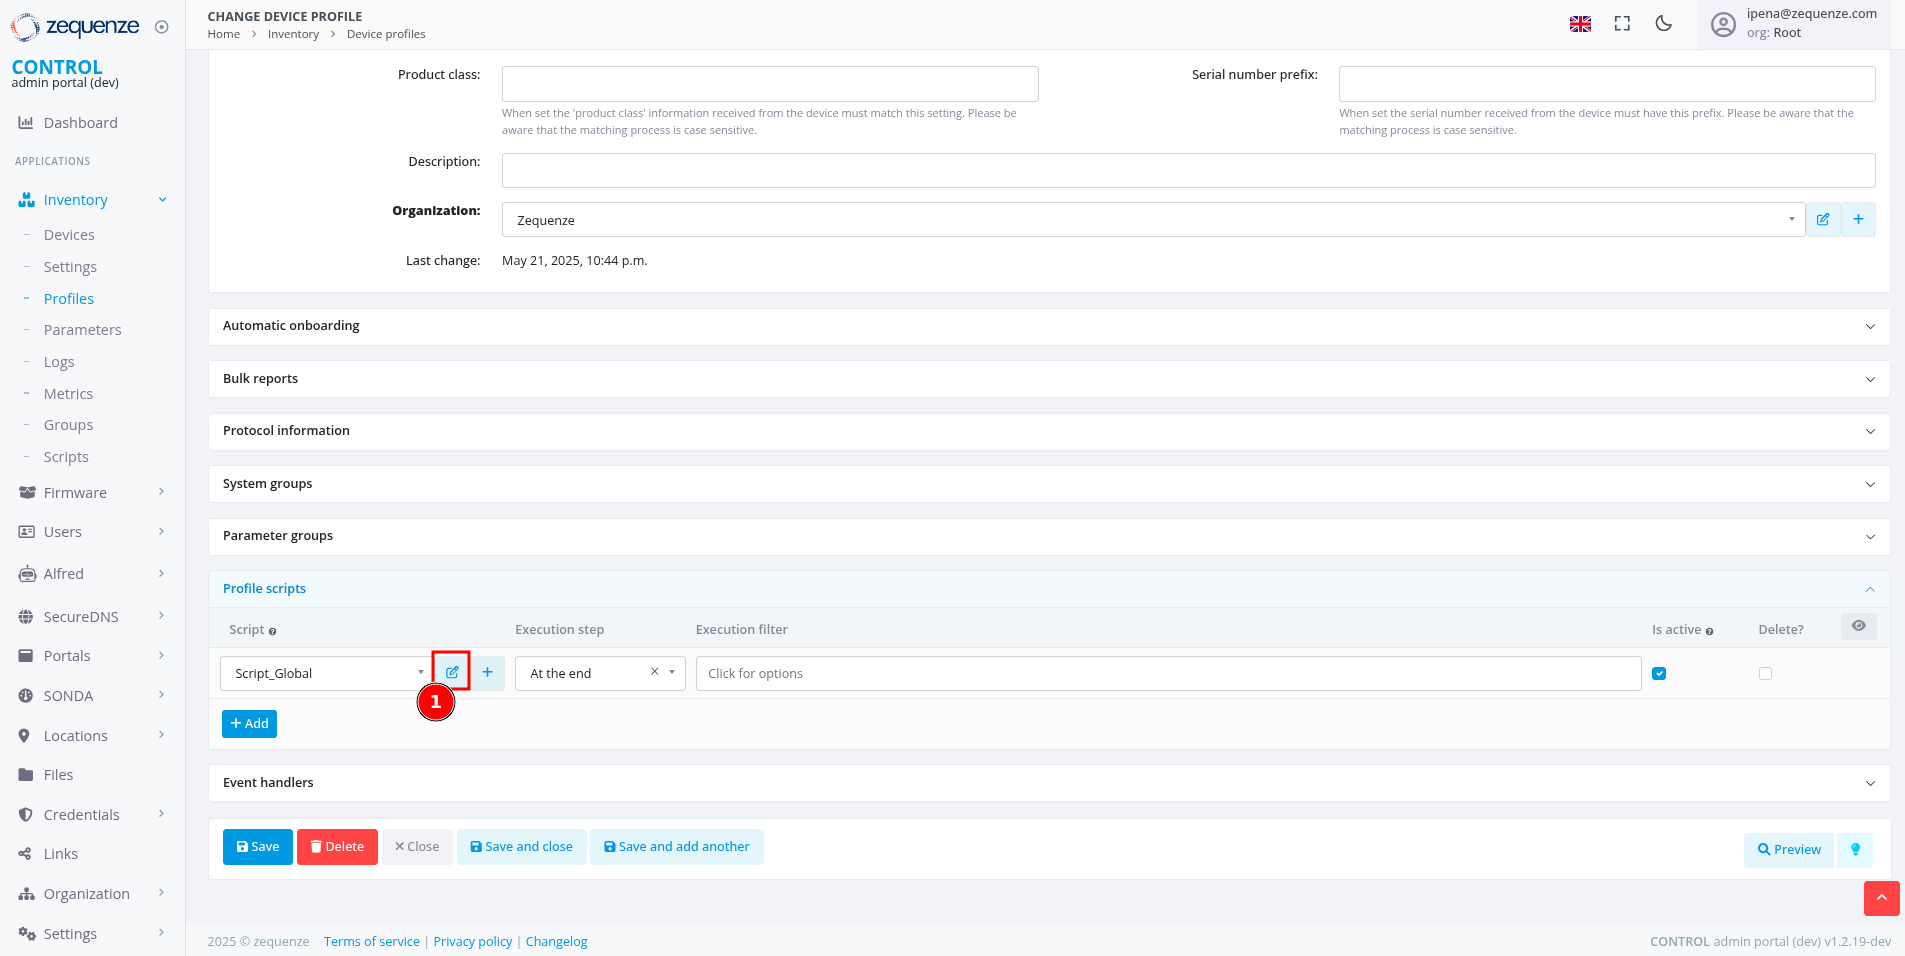](https://docs.zequenze.com/uploads/images/gallery/2025-05/lcTkcY8ULdY3mL4R-1-6-profiles-scripts.png)
*Figure 6: Accessing the script editor*
### Step 7: Implement Service Monitoring Script
Add the monitoring logic to the script editor:
1. In the script editor text area, paste or write your service monitoring code
2. The script should query TR-181/TR-098 parameters for service status
3. Format output as JSON to display service cards with appropriate status indicators
[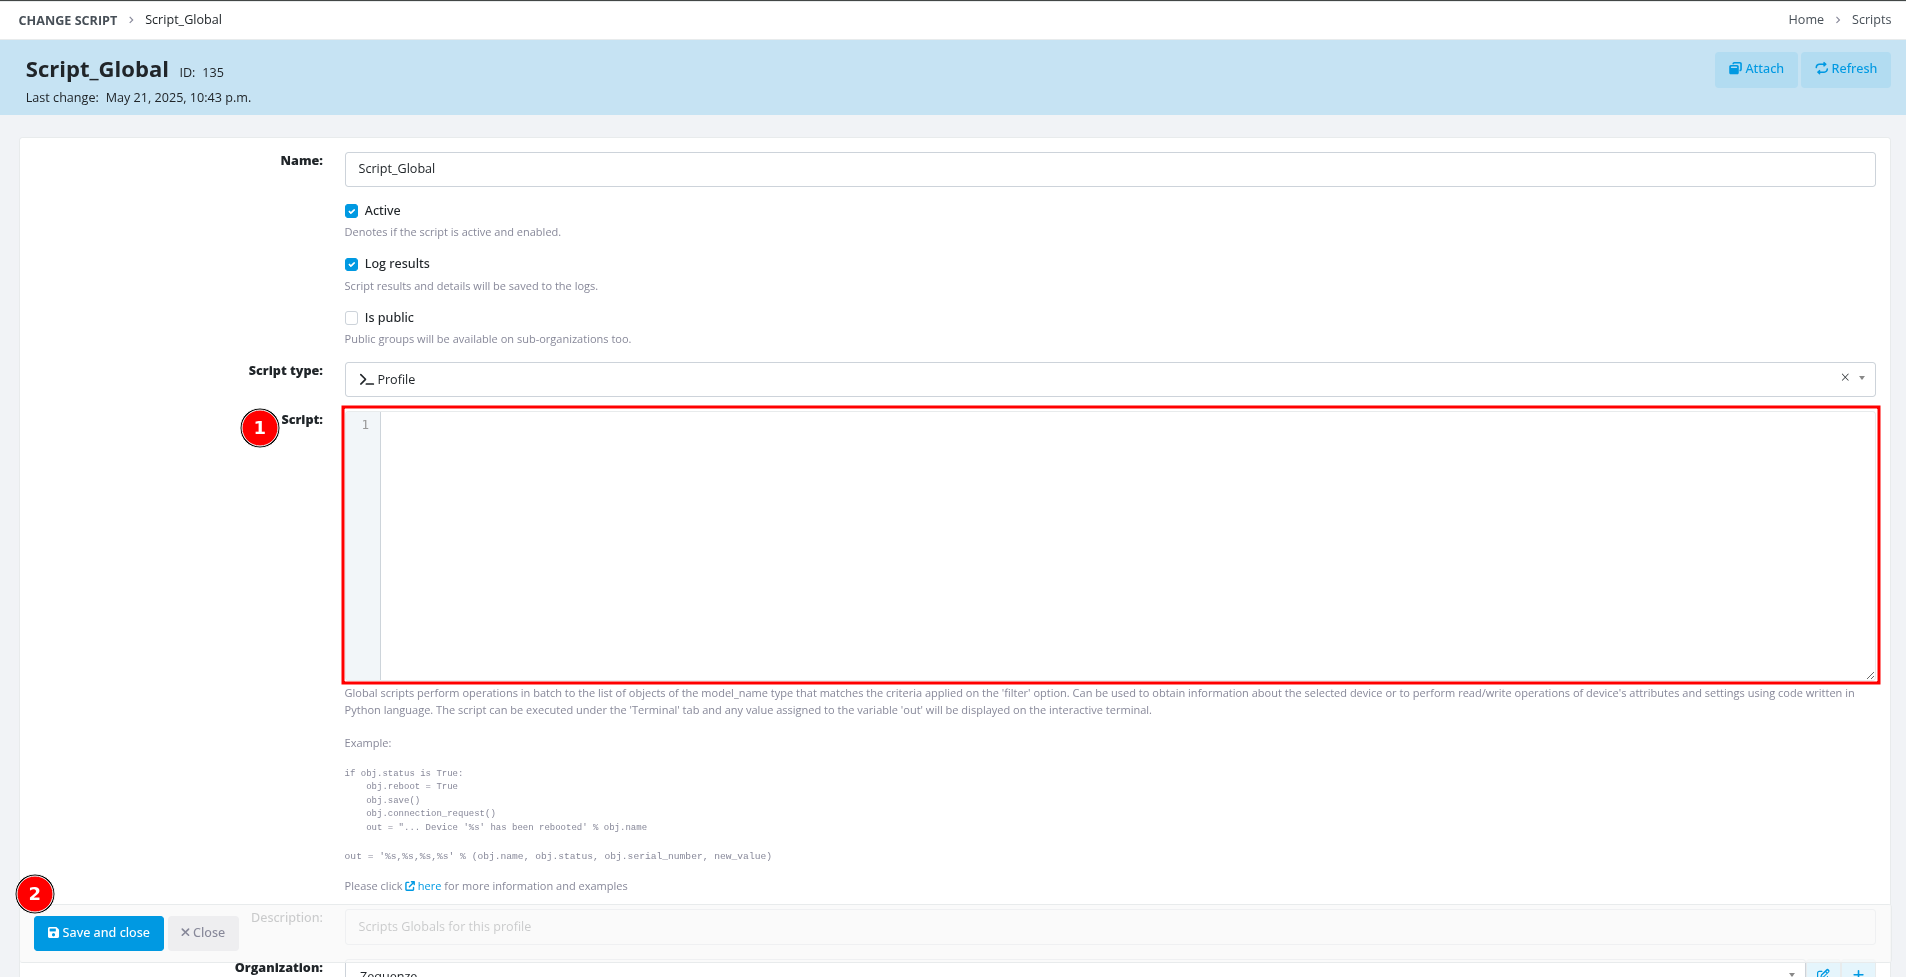](https://docs.zequenze.com/uploads/images/gallery/2025-05/5JpNj9mhC3txbcct-1-7-profiles-scripts.png)
*Figure 7: Script editor interface*
---
## Script Implementation
### Core Helper Functions
The script uses utility functions to process device parameters safely and efficiently.
#### Parameter Processing Function
```python
import json
def process_device_get(value, as_json=False):
"""
Process device parameter values from TR-181 queries.
Args:
value: Tuple containing (value, success) from device.get()
as_json: Boolean flag to parse value as JSON array
Returns:
Processed value as string, JSON object, or default value
"""
if not isinstance(value, tuple) or len(value) != 2:
return [] if as_json else "0"
val, success = value
if not success or val is None or val == "":
return [] if as_json else "0"
if as_json:
try:
return json.loads(val)
except json.JSONDecodeError:
return []
return str(val)
```
### TR-181 Parameter Query Methods
The platform supports two types of parameter queries with different return formats:
**Single Value Parameters** (ending with parameter name):
```python
# Returns direct value as string
hsi_enable = process_device_get(
device.get(variable_name='Device.IP.Interface.4.Enable')
)
dslite1_status = process_device_get(
device.get(variable_name='Device.DSLite.InterfaceSetting.1.Status')
)
```
**Array Parameters** (ending with dot):
```python
# Returns JSON array with multiple parameter objects
hsi_iana = process_device_get(
device.get(variable_name='Device.IP.Interface.4.IPv6Address.'),
as_json=True
)
voice_ipv4 = process_device_get(
device.get(variable_name='Device.IP.Interface.5.IPv4Address.'),
as_json=True
)
```
---
## Service-Specific Implementation
### 1. Device Management Service
Monitors the management interface for ACS connectivity and device access.
#### Input Parameters
```python
# Management interface IPv6 addressing
mgmt_iana = process_device_get(
device.get(variable_name='Device.IP.Interface.3.IPv6Address.'),
as_json=True
)
```
#### Analysis Function
```python
def analyze_management_interface():
"""
Analyze device management service status.
Evaluates IPv6 connectivity for ACS communication.
"""
iana = safe_json_loads(iana)
has_iana = False
iana_address = None
iana_expired = False
# Parse IPv6 address information
if iana and isinstance(iana, list):
for item in iana:
if item.get('Origin') == 'DHCPv6' and item.get('IPAddress'):
has_iana = True
iana_address = item.get('IPAddress')
valid_lifetime = item.get('ValidLifetime')
if valid_lifetime:
iana_expired = is_lifetime_expired(valid_lifetime)
break
# Determine service status
if not has_iana:
service_status = "disabled"
wan_status = "disabled"
elif iana_expired:
service_status = "warning"
wan_status = "warning"
else:
service_status = "healthy"
wan_status = "healthy"
# Build metrics array
metrics = [{
"id": "wan_status",
"label": "Interface WAN",
"type": "status",
"value": wan_status,
"tooltip": "Interface WAN: Connected (you have device access)" if has_iana
else "Interface WAN: Disconnected"
}]
# Add web access link if IPv6 available
if iana_address:
metrics.append({
"id": "ipv6_link",
"label": "Web Access",
"type": "link",
"value": {
"text": f"http://[{iana_address}]",
"href": f"http://[{iana_address}]"
},
"linkTarget": "_blank",
"tooltip": "Access device web interface"
})
return {
"id": "management-service",
"name": "Device Management",
"type": "management",
"status": service_status,
"category": "management",
"metrics": metrics,
"iconSize": "tw-w-7 tw-h-7"
}
```
#### Example Output
```json
{
"id": "management-service",
"name": "Device Management",
"type": "management",
"status": "healthy",
"category": "management",
"metrics": [
{
"id": "wan_status",
"label": "Interface WAN",
"type": "status",
"value": "healthy",
"tooltip": "Interface WAN: Connected (you have device access)"
},
{
"id": "ipv6_link",
"label": "Web Access",
"type": "link",
"value": {
"text": "http://[2806:230:fffb::16e2:6357]",
"href": "http://[2806:230:fffb::16e2:6357]"
},
"linkTarget": "_blank",
"tooltip": "Access device web interface"
}
],
"iconSize": "tw-w-7 tw-h-7"
}
```
---
### 2. Internet Service
Monitors internet connectivity including IPv6 addressing and DS-Lite tunneling for IPv4 support.
#### Input Parameters
```python
# High-Speed Internet (HSI) interface parameters
hsi_enable = process_device_get(
device.get(variable_name='Device.IP.Interface.4.Enable')
)
hsi_iana = process_device_get(
device.get(variable_name='Device.IP.Interface.4.IPv6Address.'),
as_json=True
)
hsi_iapd = process_device_get(
device.get(variable_name='Device.IP.Interface.4.IPv6Prefix.'),
as_json=True
)
# DS-Lite tunnel parameters for IPv4 connectivity
dslite1_enable = process_device_get(
device.get(variable_name='Device.DSLite.InterfaceSetting.1.Enable')
)
dslite1_address = process_device_get(
device.get(variable_name='Device.DSLite.InterfaceSetting.1.EndpointAddress')
)
dslite1_status = process_device_get(
device.get(variable_name='Device.DSLite.InterfaceSetting.1.Status')
)
```
#### Analysis Function
```python
def analyze_data_interface():
"""
Analyze internet service status including IPv6 and DS-Lite configuration.
Evaluates WAN connectivity, IPv6 addressing, and IPv4 tunneling.
"""
# Parse IPv6 addressing information
iana = safe_json_loads(iana) # IPv6 addresses
iapd = safe_json_loads(iapd) # IPv6 prefixes
has_iana = False
has_iapd = False
iana_address = None
iapd_prefix = None
# Check for valid IPv6 address (IA_NA)
if iana and isinstance(iana, list):
for item in iana:
if item.get('Origin') == 'DHCPv6' and item.get('IPAddress'):
has_iana = True
iana_address = item.get('IPAddress')
break
# Check for valid IPv6 prefix delegation (IA_PD)
if iapd and isinstance(iapd, list):
for item in iapd:
if item.get('Origin') == 'PrefixDelegation' and item.get('Prefix'):
has_iapd = True
iapd_prefix = item.get('Prefix')
break
# Analyze DS-Lite tunnel configuration
default_dslite_addresses = {'INTERNET': 'fc00::1', 'VIDEO': 'fc00::2'}
is_default_dslite = dslite_address == default_dslite_addresses.get(service)
has_invalid_dslite = dslite_address and ("@" in dslite_address)
# Determine service status based on all parameters
service_status = "disabled"
if not enable:
service_status = "disabled"
elif not (has_iana and has_iapd):
service_status = "error"
elif not dslite_enable:
service_status = "error"
elif is_default_dslite:
service_status = "warning"
elif has_invalid_dslite:
service_status = "error"
elif dslite_
# Device management through TR-069
# Configuring a CPE to become managed through CWMP/TR-069
## Overview
To configure a Customer Premises Equipment (CPE) device for management through the CWMP/TR-069 protocol, you must enable TR-069 management on your CPE device and configure it to communicate with the CONTROL platform.
## Required CPE Configuration Fields
The following configuration fields are **required** for initial setup and should be available in your CPE device settings:
- **CWMP/TR-069 Server URL**: The URL endpoint of the CWMP/TR-069 Server Platform
- **Periodic Inform Interval**: The reporting frequency (in seconds) for status updates between the CPE and CWMP/TR-069 Server Platform
- **Username**: The username credential used to authenticate the CPE to the CWMP/TR-069 Server Platform
- **Password**: The password credential used to authenticate the CPE to the CWMP/TR-069 Server Platform
## Optional CPE Configuration Fields
Some CPE devices may offer additional TR-069 configuration parameters:
- **Connection Request URL**: The CPE's URL endpoint for receiving connection requests
- **Connection Request Username**: The username for authenticating connection requests to the CPE
- **Connection Request Password**: The password for authenticating connection requests to the CPE
**Note:** These optional parameters are **not required** for initial CPE setup and can be configured later through the CONTROL platform itself.
## Example Configuration
A typical initial TR-069 CPE configuration would look like:
- **URL**: `https://control-dev.zequenze.com/cwmp/`
- **Periodic Inform Interval**: `120` (seconds)
- **Username**: `test-device`
- **Password**: `c0mpl3xpazz`
### Important Authentication Requirements
The **Username** and **Password** fields configured on the CPE must match the credentials defined in the CONTROL platform. These credentials can be configured either:
- For a specific individual device, or
- For a device TYPE (when using auto-onboarding functionality)
## Configuration on CONTROL Platform
TBC
# TR-069 Connection Request
## Overview
TR-069 is a CPE-originated communication protocol, meaning that the CPE (Customer Premises Equipment) initiates connectivity toward the ACS (Auto Configuration Server) using a pre-agreed ACS URL, username, and password.
[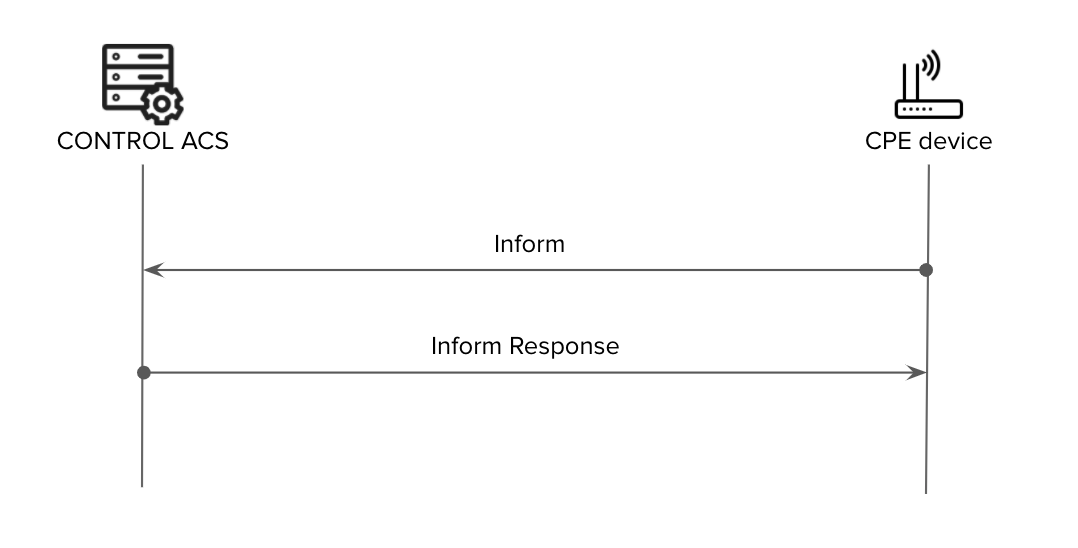](https://docs.zequenze.com/uploads/images/gallery/2020-04/kaPkIzsR74Uw2tYg-acs-normal.png)
In a standard TR-069 communication flow, the CPE connects to the ACS at regular intervals defined by the **Periodic Inform Interval**. However, there are scenarios where the ACS needs to update or modify CPE parameters within a shorter timeframe than the configured interval. For example, a customer support agent may need to change a WiFi password immediately rather than waiting for the next periodic connection.
To address this requirement, the [TR-069 standard](https://www.broadband-forum.org/download/TR-069_Amendment-6.pdf) defines a **Connection Request** functionality.
## What is Connection Request?
**Connection Request** is a mechanism that allows the ACS to proactively request (or "poke") a CPE to initiate a TR-069 session at any time, independent of the Periodic Inform Interval.
### How It Works
1. The ACS sends an HTTP request to the CPE using the **CPE Connection Request URL** with pre-agreed **Connection-Request Username** and **Connection-Request Password**
2. The CPE responds with either:
- **Success**: `HTTP 200 OK` or `HTTP 204 No Content`
- **Failure**: `HTTP 401 Unauthorized`
3. Upon successful acknowledgment, the CPE initiates a standard TR-069 session toward the ACS (beginning with the initial Inform message)
[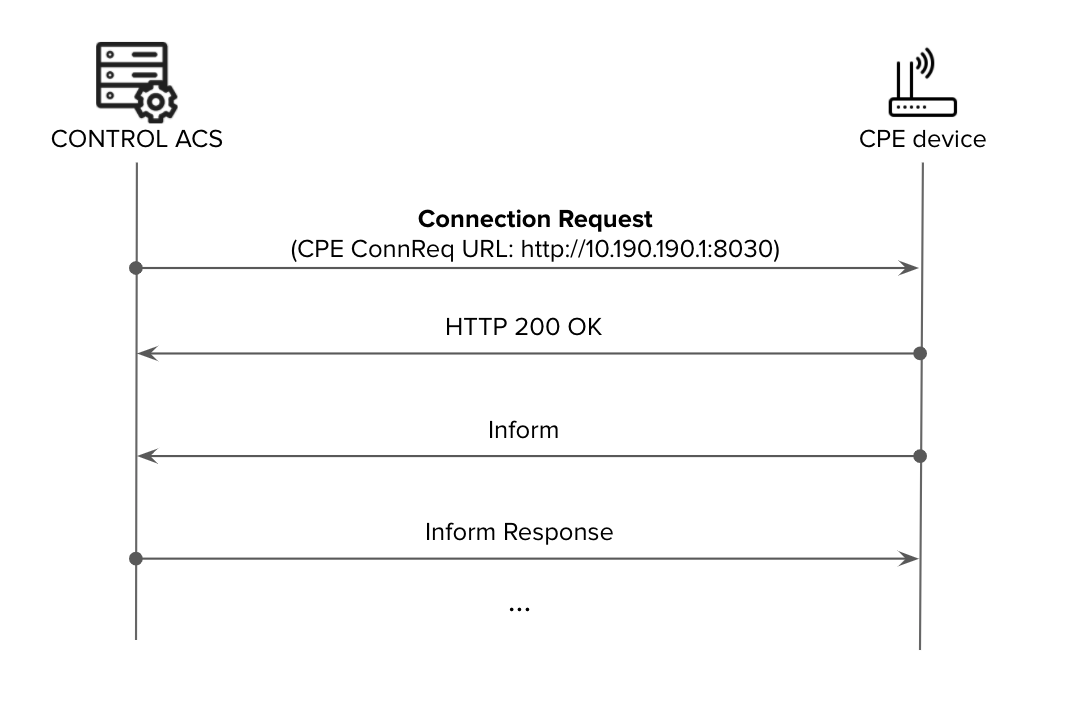](https://docs.zequenze.com/uploads/images/gallery/2020-04/cp6tRA8nYdEx7k9I-acs-connreq.png)
## Benefits of Connection Request
By enabling **Connection Request** between ACS and CPE, service providers can:
- **Reduce network overhead**: Use longer Periodic Inform Intervals to minimize network management traffic and CPE load
- **Maintain flexibility**: Retain the ability to make configuration changes or perform tests on-demand whenever required
- **Improve operational efficiency**: Enable immediate responses to customer support requests without waiting for the next periodic inform
## Implementation Challenges
Implementing Connection Request presents challenges primarily related to enabling inbound HTTP connectivity from the ACS to the CPE. These challenges involve:
- **IP Reachability**: CPE devices are often behind NAT or use private IP addressing, making them unreachable from the ACS
- **Security Concerns**: Opening inbound connections to CPE devices requires careful security considerations
[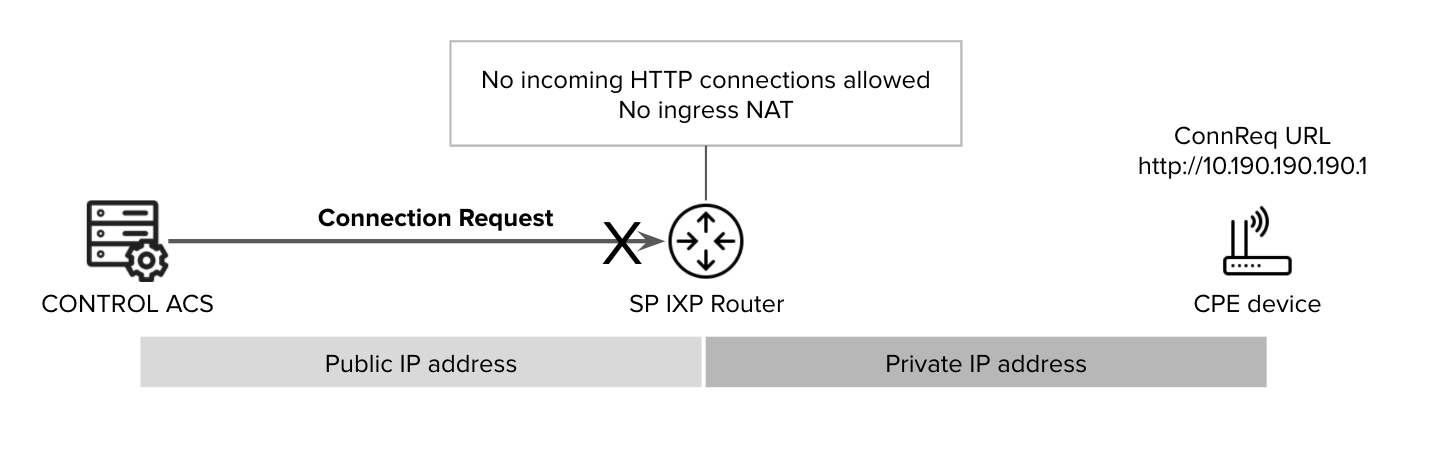](https://docs.zequenze.com/uploads/images/gallery/2020-07/xnNrg7N1FN5TBrMX-conn-req.png)
## Connection Request Methods
Several approaches exist to overcome these implementation challenges. The following are the most widely deployed methods:
### VPN-Based Connection Request
A VPN tunnel can be established to provide direct reachability from the ACS to CPE devices located within the service provider's private IP address space.
[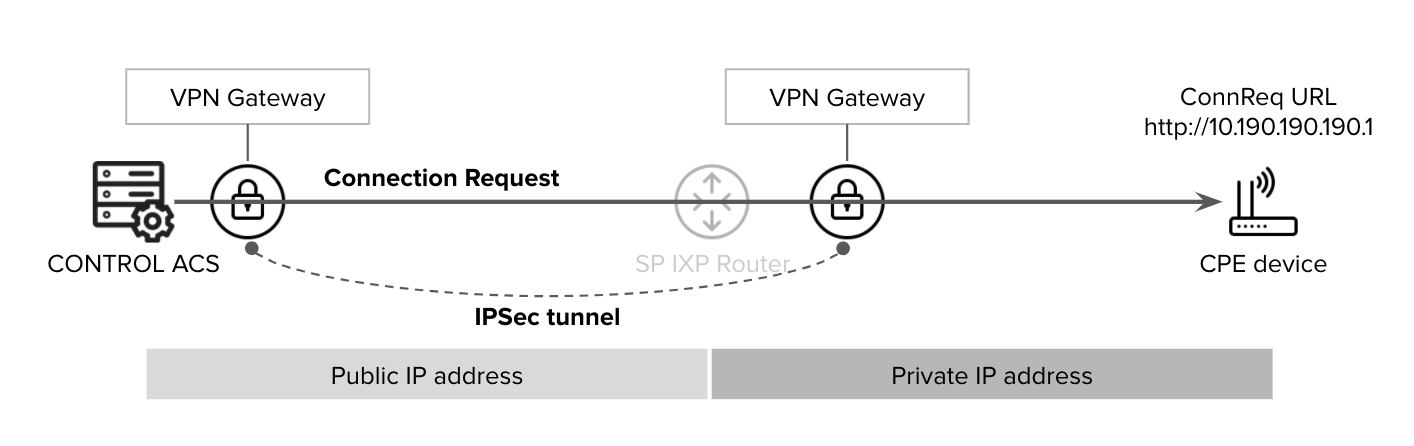](https://docs.zequenze.com/uploads/images/gallery/2020-07/ux6uwYtjrMn7igbP-vpn-connreq.png)
### XMPP-Based Connection Request
This method uses an intermediate XMPP Broker that:
- Can reach CPE devices
- Is reachable by the ACS
- Can be located inside or outside the service provider's network (e.g., in a DMZ)
[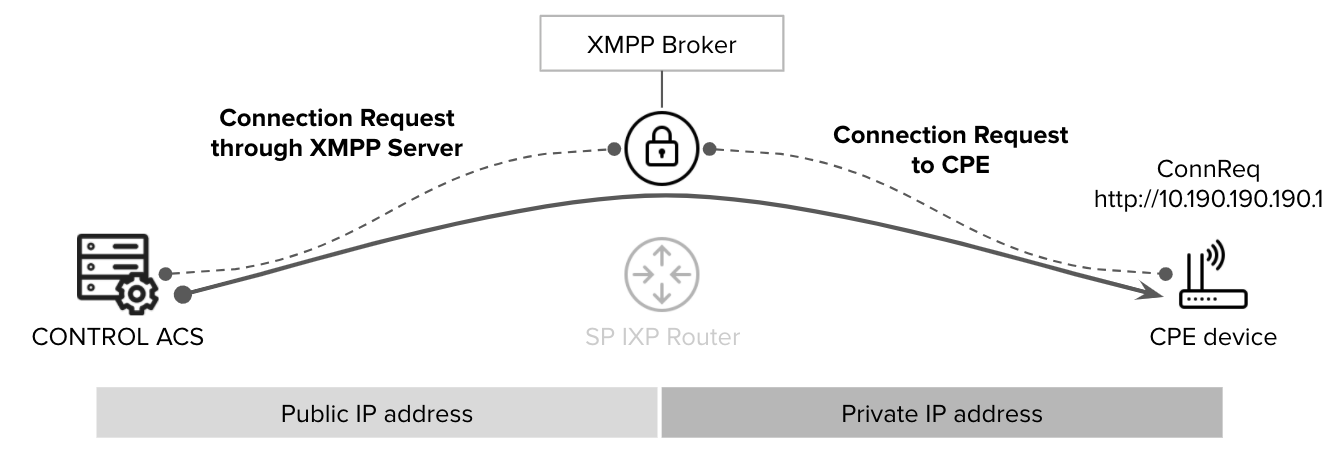](https://docs.zequenze.com/uploads/images/gallery/2020-07/kVwSzpyDyK51FO4Y-xmpp-connreq.png)
**Reference**: [TR-069 Issue 1 Amendment 6 Annex K](https://www.broadband-forum.org/download/TR-069_Amendment-6.pdf) provides detailed specifications for this architecture.
### STUN/UDP-Based Connection Request
This approach uses an intermediate STUN server to enable inbound UDP-based connection requests:
1. The CPE creates a UDP connection (bind) to the STUN server
2. The ACS can reach the CPE through the STUN server using the **UDP Bind address**
3. The STUN server can be located inside or outside the service provider's network (e.g., in a DMZ)
[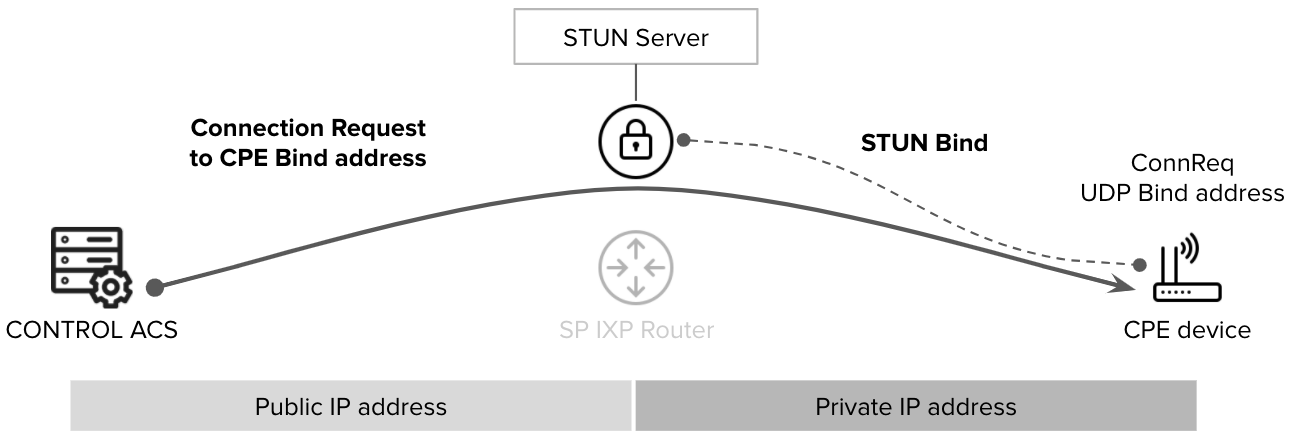](https://docs.zequenze.com/uploads/images/gallery/2020-07/gWjsMKWvtRPhfnaI-STUN-connreq.png)
**Reference**: [TR-069 Issue 1 Amendment 6 Annex G](https://www.broadband-forum.org/download/TR-069_Amendment-6.pdf) provides detailed specifications for this architecture.
---
**Note**: CONTROL ACS supports all of the connection request schemes described above.
# CPE Configuration for XMPP Connection Request
## Overview
The [Connection Request](https://docs.zequenze.com/books/control/page/tr-069-connection-request) feature enables the ACS (Auto Configuration Server) platform to initiate communication with CPE devices to retrieve or modify parameter values and perform OAM (Operations, Administration, and Maintenance) operations.
## Prerequisites
Before configuring XMPP Connection Request, ensure that an XMPP Connection instance has been created on the device at the following data model path:
```
InternetGatewayDevice.XMPP.Connection.1
```
## Configuration Parameters
The following sections detail the required TR-069 parameters for XMPP Connection Request configuration in different environments.
### Development/Testing Environment
Use these configuration values when connecting to the CONTROL development environment:
| TR-069 Parameter | Value/Description | Type | Access |
|:---|:---|:---:|:---:|
| InternetGatewayDevice.XMPP.Connection.1.Enable | 1 | boolean | RW |
| InternetGatewayDevice.XMPP.Connection.1.Domain | control-xmpp-dev.zequenze.com | string | RW |
| InternetGatewayDevice.XMPP.Connection.1.Username | sample_username | string | RW |
| InternetGatewayDevice.XMPP.Connection.1.Password | sample_password | string | RW |
| InternetGatewayDevice.XMPP.Connection.1.Resource | ConnReq | string | RW |
| InternetGatewayDevice.XMPP.Connection.1.UseTLS | 1 | boolean | RW |
| InternetGatewayDevice.XMPP.Connection.1.TLSEstablished | 1 | boolean | RO |
| Device.ManagementServer.ConnReqJabberID | sample_username@control-xmpp-dev.zequenze.com/ConnReq | string | RO |
| Device.XMPP.Connection.1.ServerConnectAlgorithm | DNS-SRV | string | RW |
| Device.XMPP.Connection.1.KeepAliveInterval | 300 | integer | RW |
**Note:** Replace `sample_username` and `sample_password` with your actual credentials.
### Production Environment
Use these configuration values when connecting to the CONTROL production environment:
| TR-069 Parameter | Value/Description | Type | Access |
|:---|:---|:---:|:---:|
| InternetGatewayDevice.XMPP.Connection.1.Enable | 1 | boolean | RW |
| InternetGatewayDevice.XMPP.Connection.1.Domain | control-xmpp.zequenze.com | string | RW |
| InternetGatewayDevice.XMPP.Connection.1.Username | sample_username | string | RW |
| InternetGatewayDevice.XMPP.Connection.1.Password | sample_password | string | RW |
| InternetGatewayDevice.XMPP.Connection.1.Resource | ConnReq | string | RW |
| InternetGatewayDevice.XMPP.Connection.1.UseTLS | 1 | boolean | RW |
| InternetGatewayDevice.XMPP.Connection.1.TLSEstablished | 1 | boolean | RO |
| Device.ManagementServer.ConnReqJabberID | sample_username@control-xmpp.zequenze.com/ConnReq | string | RO |
| Device.XMPP.Connection.1.ServerConnectAlgorithm | DNS-SRV | string | RW |
| Device.XMPP.Connection.1.KeepAliveInterval | 300 | integer | RW |
**Note:** Replace `sample_username` and `sample_password` with your actual credentials.
## Parameter Descriptions
- **Enable**: Activates the XMPP connection (set to `1` for enabled)
- **Domain**: The XMPP server domain for the respective environment
- **Username**: Authentication username for the XMPP connection
- **Password**: Authentication password for the XMPP connection
- **Resource**: XMPP resource identifier (typically `ConnReq` for Connection Request)
- **UseTLS**: Enables TLS encryption for the connection (set to `1` for enabled)
- **TLSEstablished**: Read-only status indicator showing whether TLS is successfully established
- **ConnReqJabberID**: Read-only Jabber ID used for connection requests
- **ServerConnectAlgorithm**: Connection method (DNS-SRV uses DNS service records)
- **KeepAliveInterval**: Time in seconds between keep-alive messages (default: 300)
# Interoperability
# CONTROL ACS - Interoperability List
## Overview
This document lists all customer premises equipment (CPE) devices that have been validated for interoperability with CONTROL ACS as of September 2020.
## Device Categories
The following device types are included in this compatibility list:
- **eMTA** - Embedded Multimedia Terminal Adapter
- **LTE CPE** - Long-Term Evolution Customer Premises Equipment
- **LTE MiFi** - Mobile WiFi Hotspot Device
- **GPON ONT** - Gigabit Passive Optical Network Optical Network Terminal
- **DSL Modem** - Digital Subscriber Line Modem
- **WiFi Mesh/Extender** - Wireless Network Range Extender
- **Router** - Network Routing Device
## Validated Devices
The table below provides a complete list of validated devices, organized by vendor, model, and device type.
| Vendor | Model | Device Type |
|:-------|:------|:------------|
| Adtran | AdTran 301 | eMTA |
| Adtran | AdTran TA324 | eMTA |
| Adtran | AdTran TA414 | eMTA |
| Adtran | AdTran TA434 | eMTA |
| Alcatel | Alcatel HH41 | LTE CPE |
| Alcatel | Alcatel HH42 | LTE CPE |
| Alcatel | Alcatel MW41 | LTE CPE |
| Alcatel | Alcatel MW45 | LTE CPE |
| Arris | Arris VAP4402 | WiFi Mesh/Extender |
| Arris | Arris VAP4641 | WiFi Mesh/Extender |
| Arris | Arris TG1652A | eMTA |
| Blu-Castle | Blu-Castle 502 | LTE CPE |
| Calix | Calix 844G | GPON ONT |
| Compal | Compal CBN CH7369 | eMTA |
| Hitron | Hitron HT-EMN3 | WiFi Mesh/Extender |
| Hitron | Hitron HT-EN3 | WiFi Mesh/Extender |
| Hitron | Hitron CHITA HC1S3 | eMTA |
| Hitron | Hitron CGNV5 | eMTA |
| Huawei | Huawei B2368 | LTE CPE |
| Huawei | Huawei B310 | LTE CPE |
| Huawei | Huawei B311 | LTE CPE |
| Huawei | Huawei B312 | LTE CPE |
| Huawei | Huawei B612 | LTE CPE |
| Huawei | Huawei B612s | LTE CPE |
| Huawei | Huawei HG8245Q2 | GPON ONT |
| Huawei | Huawei HG8245W5-20 | GPON ONT |
| Huawei | Huawei HN8255WS | GPON ONT |
| Huawei | Huawei HQ8247H | GPON ONT |
| Huawei | Huawei ZXHN F680 | GPON ONT |
| Iphotonix | Iphotonix 7279G | GPON ONT |
| Iphotonix | Iphotonix 7259G | GPON ONT |
| Kaon | Kaon CG2200 | eMTA |
| Kaon | Kaon GP2110-EB3 | eMTA |
| Kaon | Kaon GP2110-EB4 | eMTA |
| M4 | M4 C1 | LTE CPE |
| M4 | M4 C2 | LTE CPE |
| M4 | M4 Connect 1L | LTE CPE |
| M4 | M4 Spot Movil 1 | LTE MiFi |
| M4 | M4 WiLink1 | LTE CPE |
| M4 | M4 WiLink5 | LTE CPE |
| Mikrotik | MikrotikOS | Router |
| MindTech | MindTech ON3402A | eMTA |
| MindTech | MindTech ON6404H | eMTA |
| Nokia | G-240W-C | GPON ONT |
| Nokia | G-240W-B | GPON ONT |
| Nokia | G-240W-G | GPON ONT |
| Pincom | Pincom A7500-A1 | DSL modem |
| Quamtum | Access Q1 | LTE CPE |
| Quamtum | Access Q3 | LTE CPE |
| Quamtum | Access Q6 | LTE CPE |
| Sagemcom | Sagemcom F5657 | eMTA |
| Sagemcom | Sagemcom F5688 | eMTA |
| Sagemcom | Sagemcom FAST 3686 | eMTA |
| Sagemcom | Sagemcom FAST 4630 | eMTA |
| Seowon | Seowon SLC-150S07GQ | LTE CPE |
| Skyworth | Skyworth GN541V | eMTA |
| Technicolor | Technicolor 585 E7 | DSL modem |
| Technicolor | Technicolor TG582N | DSL modem |
| Technicolor | Technicolor CGA2121 | eMTA |
| Technicolor | Technicolor FGA2130 | eMTA |
| Thomson | Thomson 585v7 | DSL modem |
| TP-Link | TP-Link-Deco-M4 | WiFi Mesh/Extender |
| TP-Link | TP-Link-Deco-M5 | WiFi Mesh/Extender |
| TP-Link | TP-Link-HC221-G1W | WiFi Mesh/Extender |
| Ubee | Ubee UBC1310 | eMTA |
| ZTE | ZTE ZXHN H108N | DSL modem |
| ZTE | ZTE MF253V | LTE CPE |
| ZTE | ZTE F680 | GPON ONT |
| ZTE | ZXHN F2866S | LTE CPE |
| ZTE | ZTE H196A | WiFi Mesh/Extender |
## Notes
- This list is updated periodically as new devices are validated for use with CONTROL ACS
- Interoperability validation ensures that devices can be properly managed, configured, and monitored through the CONTROL platform
- For questions about specific device compatibility or to request validation of additional models, please contact technical support
---
**Document Version:** September 2020
# RouterOS + tr069 staging process
# Install RouterOS in a virtual machine and connect it to CONTROL
## Overview
This guide walks you through installing RouterOS in a VirtualBox virtual machine and connecting it to CONTROL using the TR-069 protocol.
## Prerequisites
- VirtualBox installed on your system
- Internet connection to download RouterOS files
- Basic familiarity with virtual machine management
---
## Step 1: Download RouterOS
Visit the [MikroTik download page](https://mikrotik.com/download) and download the following files:
- **RouterOS 6.48.6 Long-term x86 ISO image**
- **Extra packages** (contains the TR-069 package)
[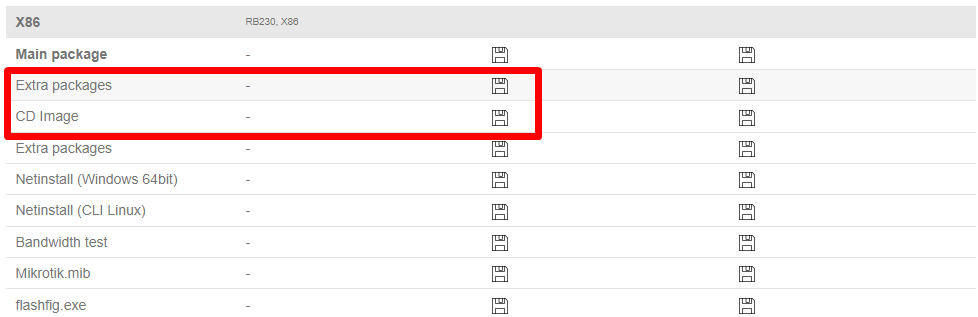](https://docs.zequenze.com/uploads/images/gallery/2022-02/mvEc50XHpoyBlmfN-image-1645563625256.png)
---
## Step 2: Create the Virtual Machine
### Configure VM Settings
1. Open VirtualBox and create a new virtual machine
[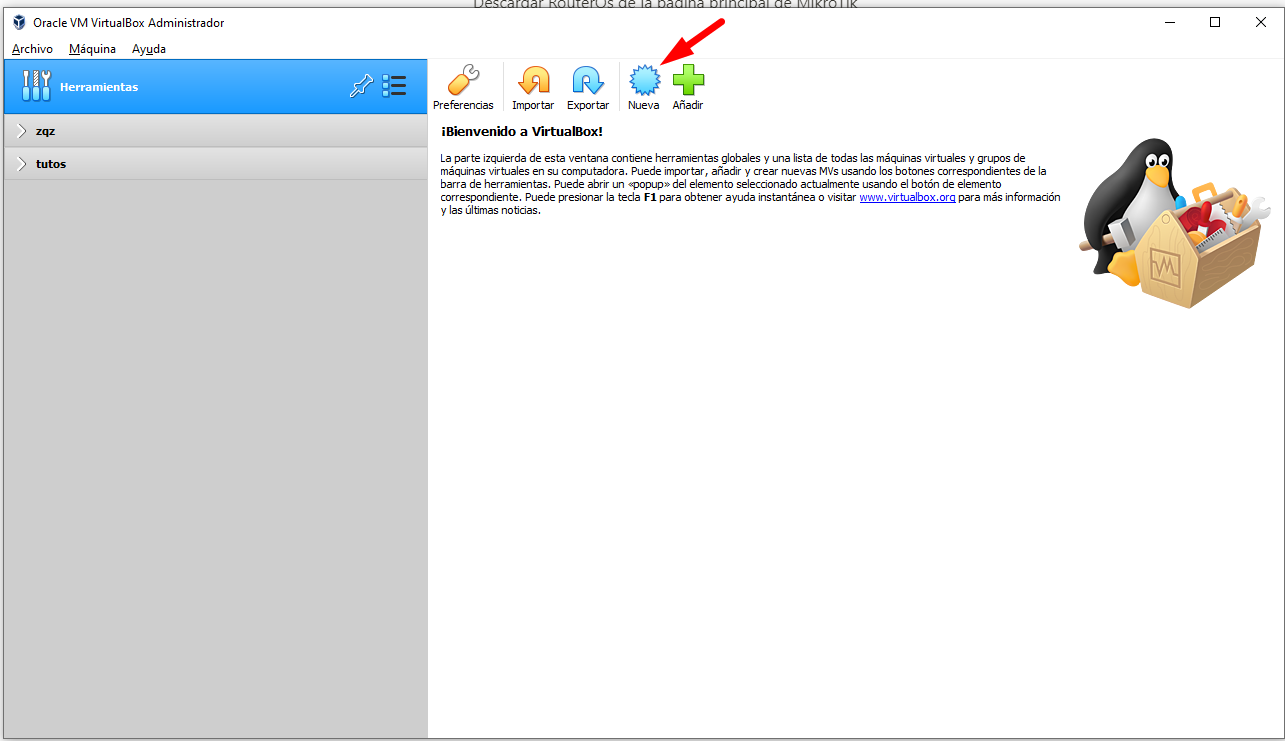](https://docs.zequenze.com/uploads/images/gallery/2022-02/Mv3oDt79NRs9wM3s-image-1645540572569.png)
2. Enter the required information as shown below
[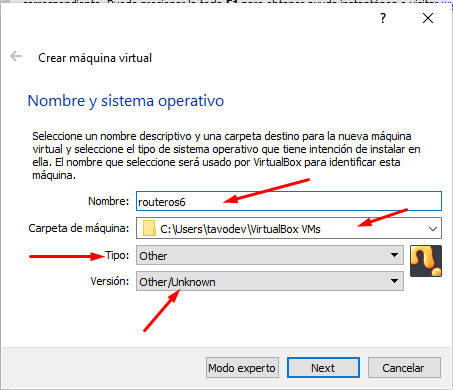](https://docs.zequenze.com/uploads/images/gallery/2022-02/i5esLCZF6cWBfOAg-image-1645540727105.png)
3. Allocate RAM memory (64 MB is sufficient for RouterOS)
[](https://docs.zequenze.com/uploads/images/gallery/2022-02/plVH46RssZbjb007-image-1645540756544.png)
4. Create a virtual hard disk with the following settings:
[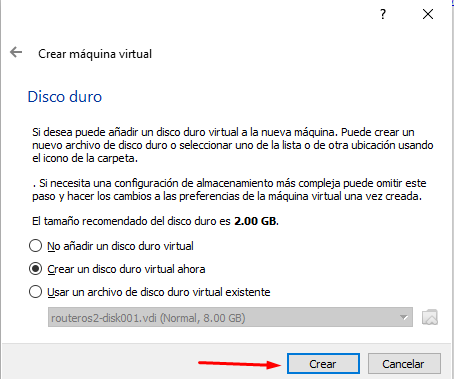](https://docs.zequenze.com/uploads/images/gallery/2022-02/6CfgTqutHS0yi2Ev-image-1645540814470.png)
[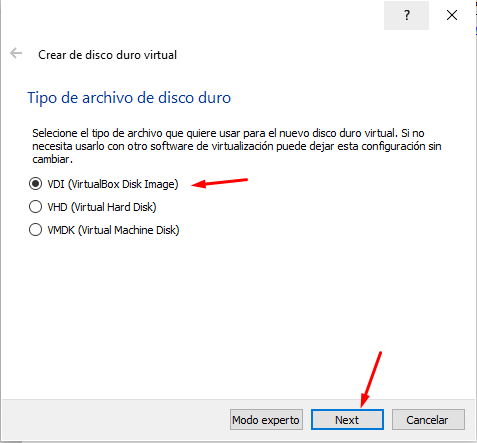](https://docs.zequenze.com/uploads/images/gallery/2022-02/a5wssyxyYP2Qm7H9-image-1645540823381.png)
[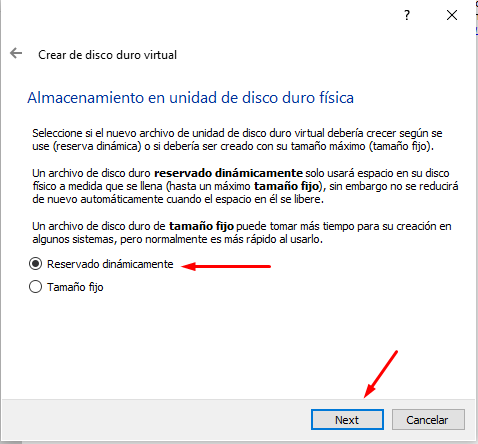](https://docs.zequenze.com/uploads/images/gallery/2022-02/IwXz2cIHSjoozczW-image-1645540843981.png)
[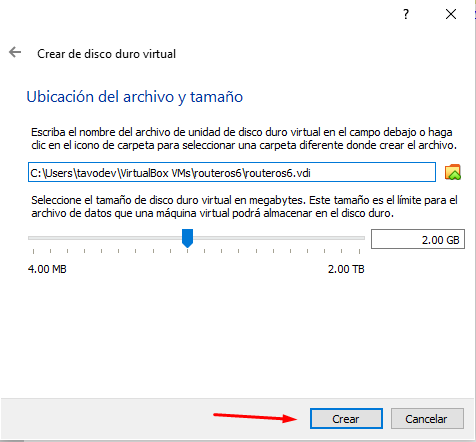](https://docs.zequenze.com/uploads/images/gallery/2022-02/dkQSxSePg1j2hFwM-image-1645540849381.png)
### Configure Network Adapters
5. After the VM is created, add an additional network adapter in the VM settings
[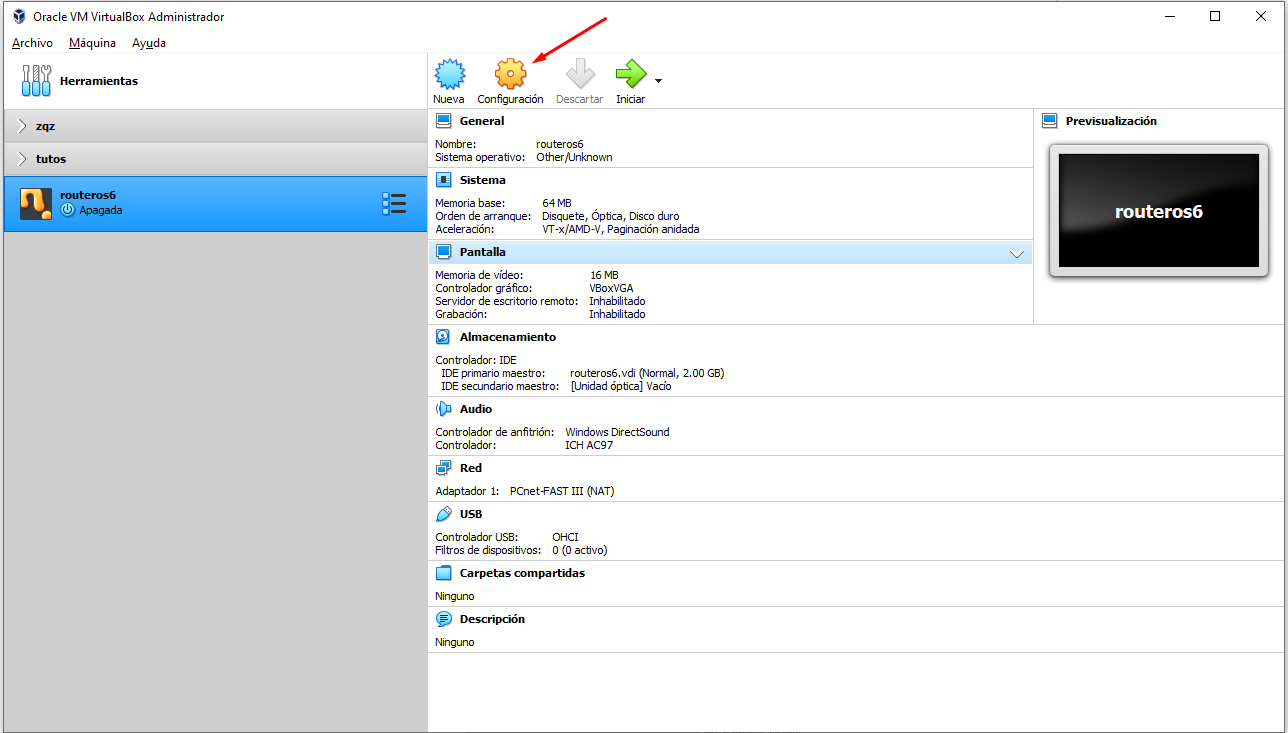](https://docs.zequenze.com/uploads/images/gallery/2022-02/YFc1Xhf8guWfIn2d-image-1645541963736.png)
6. The network configuration should look like this:
[](https://docs.zequenze.com/uploads/images/gallery/2022-02/0NlDdNUBWluKZXnU-image-1645541986896.png)
---
## Step 3: Install RouterOS
### Boot and Installation
1. Start the virtual machine
[](https://docs.zequenze.com/uploads/images/gallery/2022-02/8LfoRYGvfIESust8-image-1645542013174.png)
2. Select the RouterOS ISO image and boot the VM
[](https://docs.zequenze.com/uploads/images/gallery/2022-02/FWlfut4uMtk5LI5V-image-1645542036477.png)
3. When the package selection screen appears, press **A** to select all packages
[](https://docs.zequenze.com/uploads/images/gallery/2022-02/FnaF3ra8nKDGW0iC-image-1645542066394.png)
[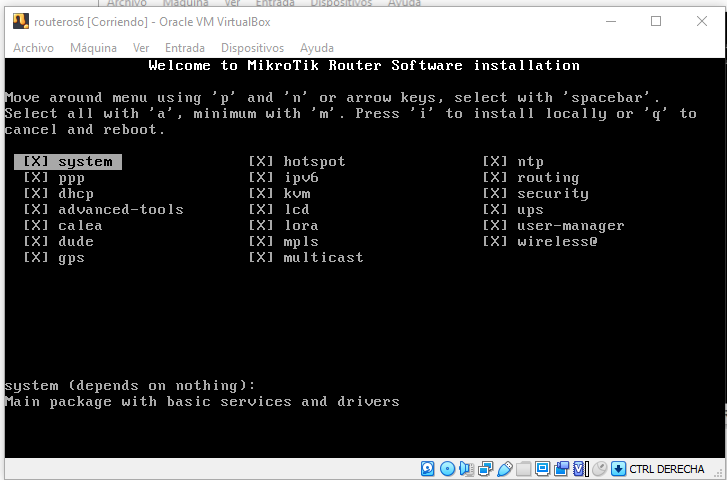](https://docs.zequenze.com/uploads/images/gallery/2022-02/qWZ02CJDJvT9RX7g-image-1645542074001.png)
4. Press **I** to start the installation and confirm when prompted
[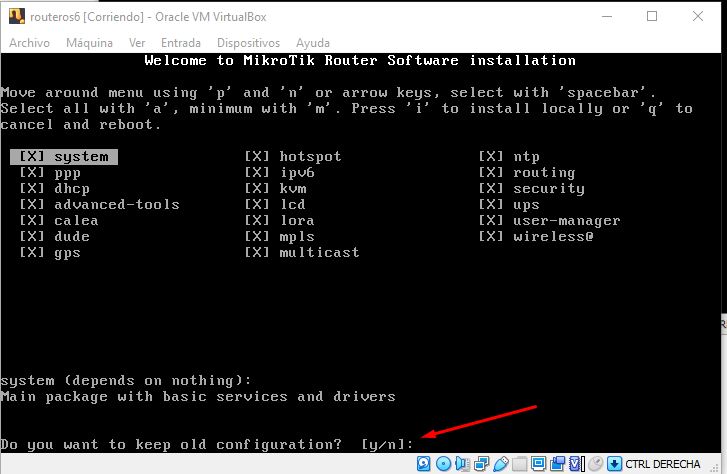](https://docs.zequenze.com/uploads/images/gallery/2022-02/QgDiq5kuy3Orpw0n-image-1645542109056.png)
5. After installation completes, **unmount the ISO image** to prevent the installation wizard from restarting
[](https://docs.zequenze.com/uploads/images/gallery/2022-02/fMhuTbjcDkRs7Sqz-image-1645542125618.png)
---
## Step 4: Initial Configuration
### Login to RouterOS
1. Once the login screen appears, use the default credentials:
- **Username:** `admin`
- **Password:** (leave blank)
[](https://docs.zequenze.com/uploads/images/gallery/2022-02/fGdqNyGSOr4oPccn-image-1645542150525.png)
### Assign IP Address
2. Add an IP address to enable remote access. For this example, we'll use `192.168.1.50`:
```
ip address add address=192.168.1.50/24 interface=ether1
```
[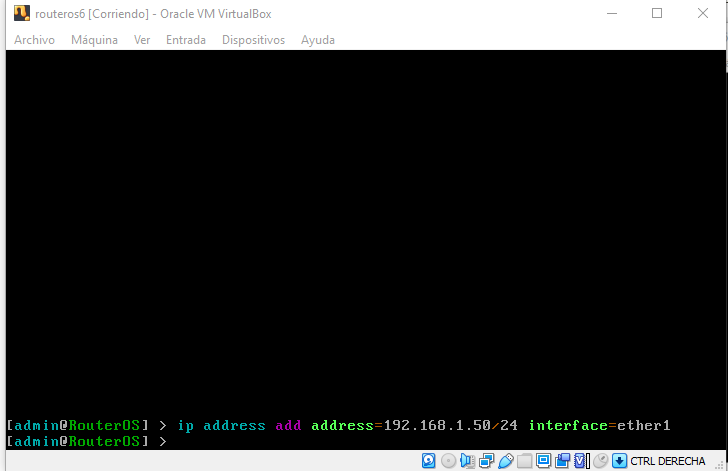](https://docs.zequenze.com/uploads/images/gallery/2022-02/QBpkaJ7zWJ0P0zvw-image-1645563333612.png)
3. Verify the IP address was added correctly:
```
ip address print
```
[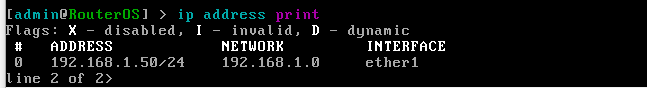](https://docs.zequenze.com/uploads/images/gallery/2022-02/t0QzRo5FoP31CENj-image-1645563369321.png)
### Access Web Interface
4. Open a web browser and navigate to the RouterOS web interface using the IP address you configured:
```
http://192.168.1.50/webfig/
```
[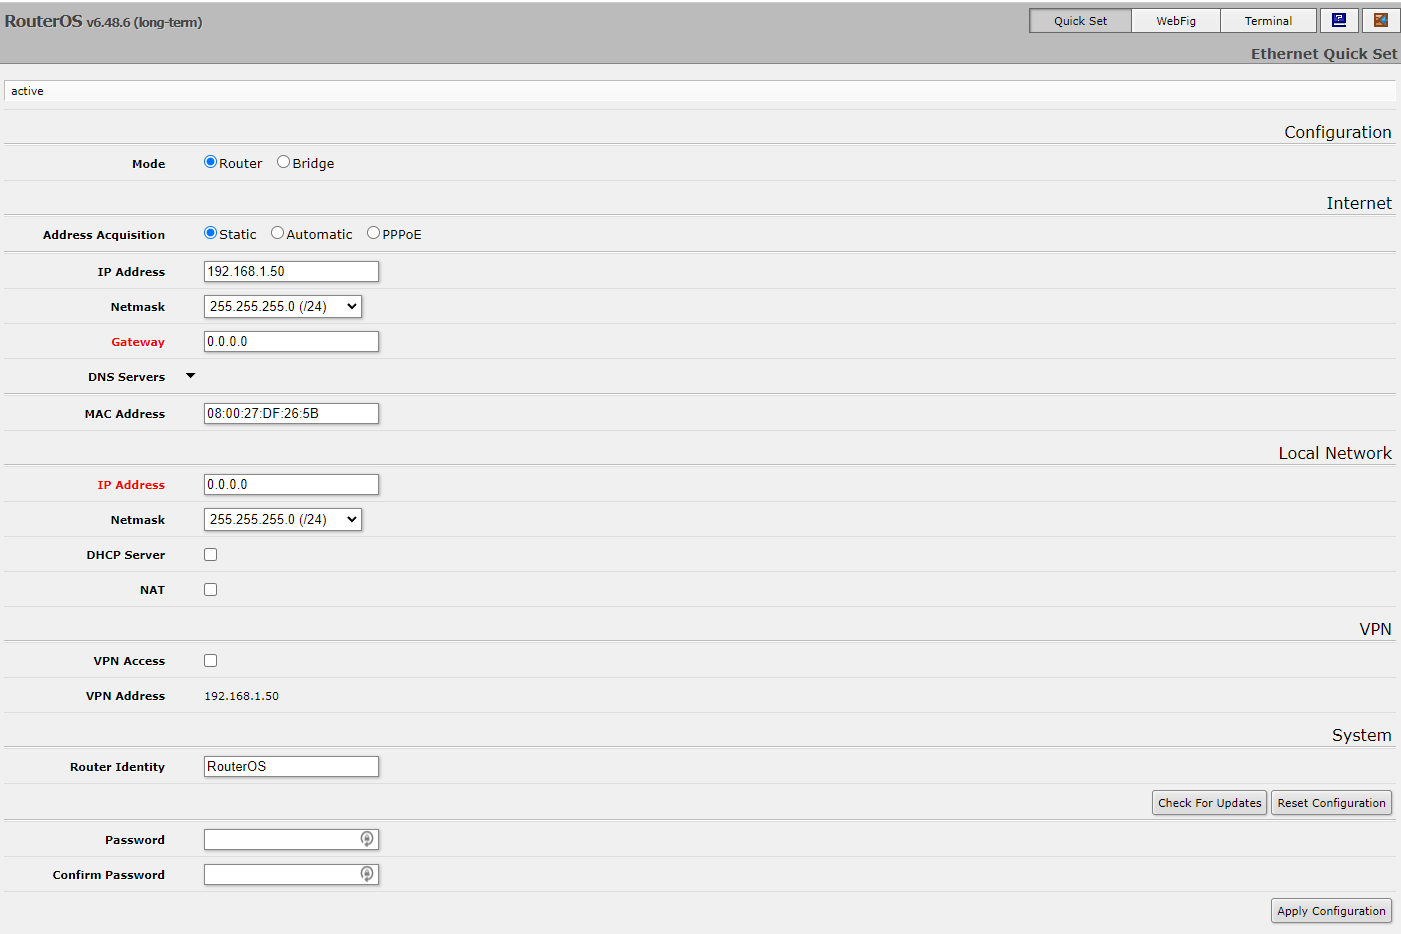](https://docs.zequenze.com/uploads/images/gallery/2022-02/2K0GfMwkPJRwn5IF-image-1645563400046.png)
5. Click on **WebFig** to access the full configuration interface
[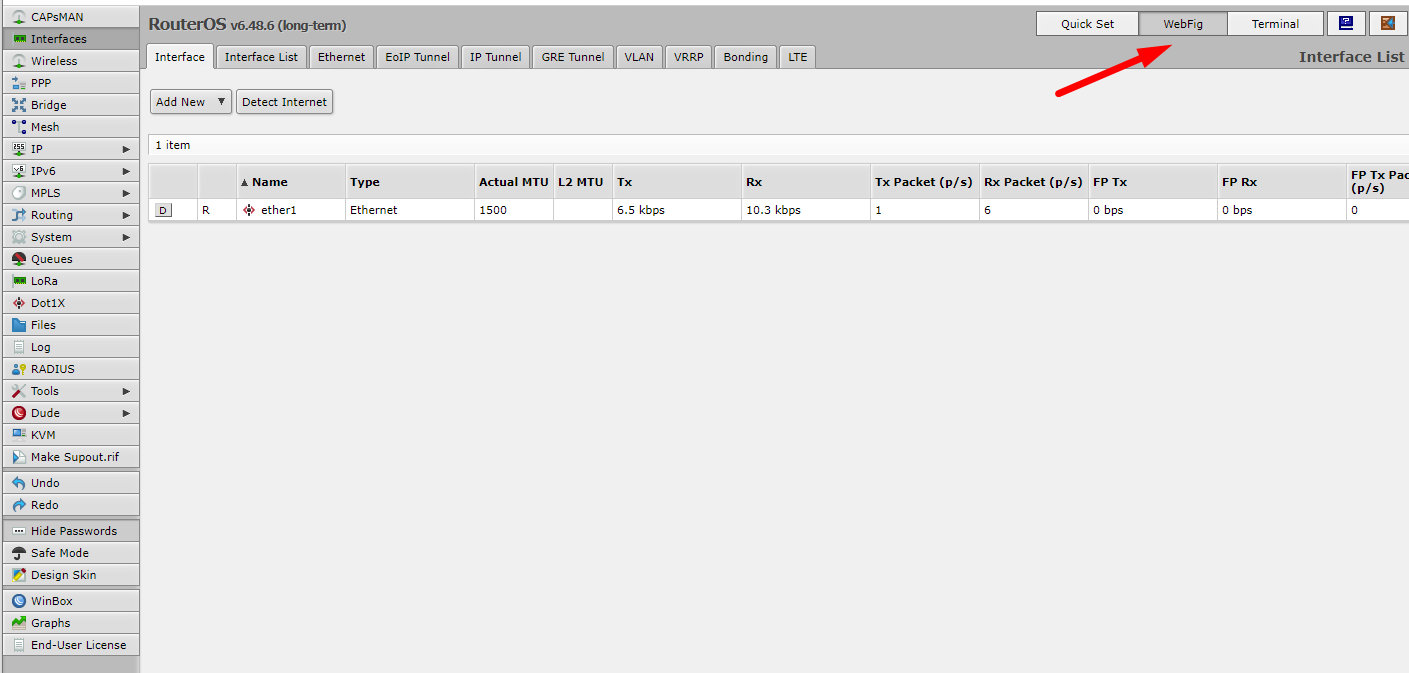](https://docs.zequenze.com/uploads/images/gallery/2022-02/hf41tP5PGFYJZomZ-image-1645563427078.png)
---
## Step 5: Install TR-069 Package
1. Navigate to **Files** in the WebFig interface and upload the TR-069 package
[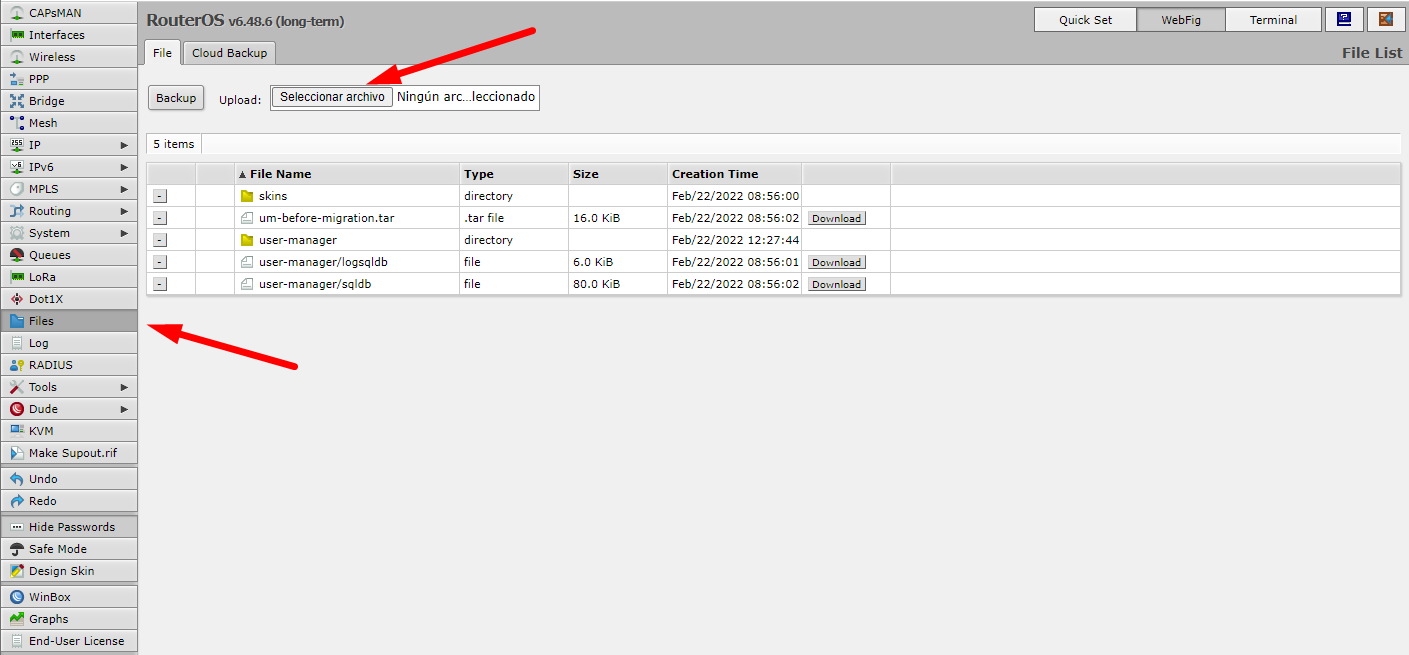](https://docs.zequenze.com/uploads/images/gallery/2022-02/o1VsZ4lB9Z1oPuVq-image-1645563446671.png)
2. Extract the downloaded Extra packages archive and locate the TR-069 package file
[](https://docs.zequenze.com/uploads/images/gallery/2022-02/xX4Yt6RhcNyPC9l2-image-1645563471763.png)
[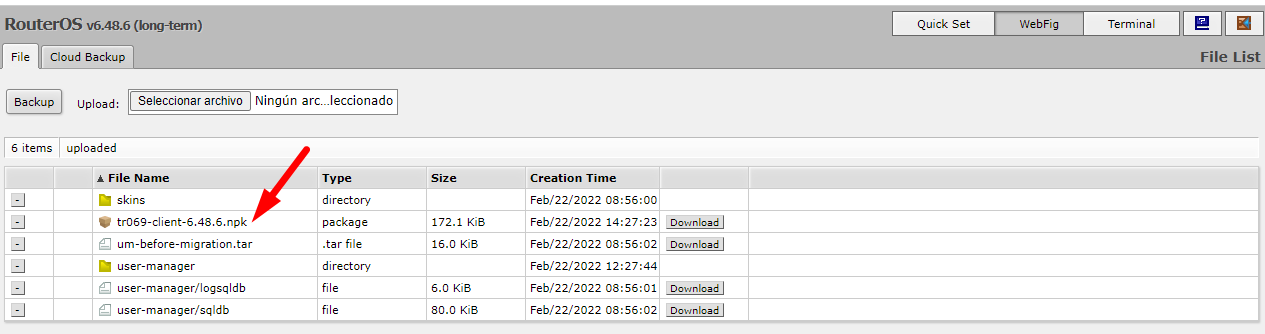](https://docs.zequenze.com/uploads/images/gallery/2022-02/e84Zdqk86j3sQRE7-image-1645563481019.png)
3. Reboot the router to complete the package installation
[](https://docs.zequenze.com/uploads/images/gallery/2022-02/mCKFdZdQrV61gsqO-image-1645563502754.png)
4. After reboot, verify that TR-069 is enabled in the system
[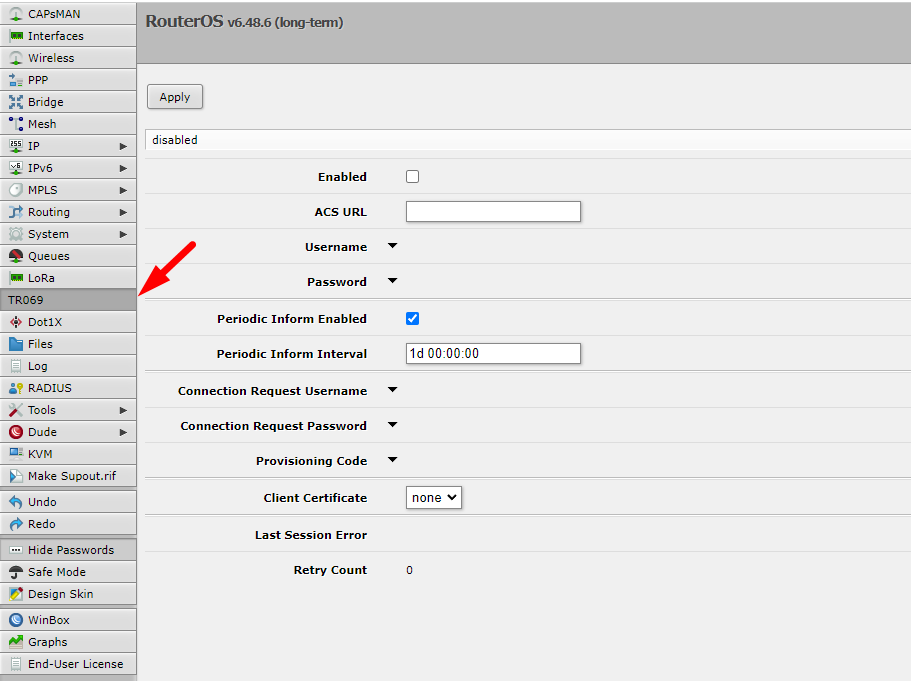](https://docs.zequenze.com/uploads/images/gallery/2022-02/NX3azdMj09hvSmAK-image-1645563525530.png)
---
## Step 6: Obtain RouterOS License
RouterOS displays a warning message indicating you have 24 hours to use the software without a license. You must register to obtain a free demo license.
### Save Software ID
1. Note the **Software ID** displayed in the license warning message
[](https://docs.zequenze.com/uploads/images/gallery/2022-02/5BvjCyM4Z2Z3NLnE-image-1645563554969.png)
### Generate License Key
2. Register for a MikroTik account at the [registration page](https://mikrotik.com/client/register)
3. After logging in, navigate to **MAKE A DEMO KEY**, enter your Software ID, and generate the license
[](https://docs.zequenze.com/uploads/images/gallery/2022-02/A0Oy5zD3L2m5qXb8-image-1645563588494.png)
[](https://docs.zequenze.com/uploads/images/gallery/2022-02/jJPsEw1XviNGVZXf-image-1645563598789.png)
### Activate License
4. Connect to RouterOS via SSH
[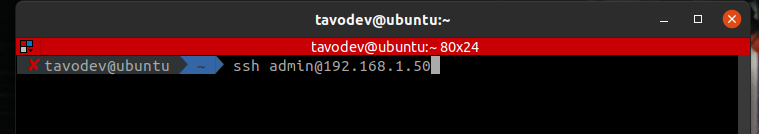](https://docs.zequenze.com/uploads/images/gallery/2022-02/YjhkFhBwsPvc73Jb-image-1645825961461.png)
5. Paste the license key in the terminal and reboot to complete activation
[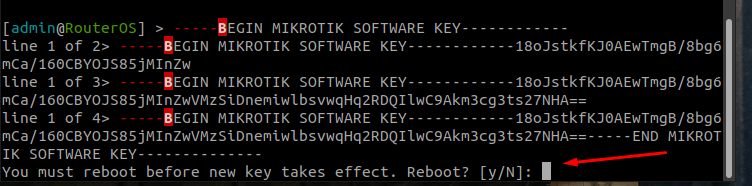](https://docs.zequenze.com/uploads/images/gallery/2022-02/Tu0LgvBlhPYYSxad-image-1645825982230.png)
6. After reboot, a confirmation message indicates the license was successfully activated
[
The profile defines Phase 1 parameters for the IPsec connection.
1. Click the **Profiles** tab in the center panel
2. Click **Add New** to create a new profile
3. Configure the following Phase 1 parameters:
- **Name**: Enter a descriptive name to identify the profile (e.g., "profile-to-ctl01.dev")
- **Hash Algorithms**: Select a hash algorithm that matches the configuration on the remote endpoint
- **Encryption Algorithm**: Choose an encryption algorithm that matches the remote endpoint configuration
- **Lifetime**: Leave the default value (measured in seconds)
- **NAT Traversal**: Enable this option if the router is behind NAT
- **DPD Interval**: Leave the default value for Dead Peer Detection and note this number
- **DPD Maximum Failures**: Leave the default value
4. Click **Apply**, then click **OK**
---
### Step 2: Configure Peers
The peer configuration defines the remote VPN endpoint.
1. Click the **Peers** tab
2. Click **Add New**
3. Configure the following fields:
- **Name**: Enter a name to identify the remote peer
- **Address**: Enter the remote public IP address (e.g., 35.35.35.22/32)
- **Profile**: Select the profile created in Step 1
- **Exchange Mode**: Select the exchange mode (IKE2 is recommended)
4. Click **Apply**, then click **OK**
---
### Step 3: Configure Identities
The identities configuration defines authentication credentials.
1. Click the **Identities** tab
2. Click **Add New**
3. Configure the following fields:
- **Peer**: Select the peer configured in Step 2
- **Auth. Method**: Select "pre shared key"
- **Secret**: Enter the pre-shared key that will be configured on both endpoints
4. Click **Apply**, then click **OK**
---
### Step 4: Configure Proposals (Phase 2)
The proposal defines Phase 2 parameters for the IPsec connection.
1. Click the **Proposals** tab
2. Click **Add New**
3. Configure the following Phase 2 parameters:
- **Name**: Enter a name to identify this proposal
- **Auth. Algorithms**: Select the authentication algorithm to be used on both endpoints
- **Encr. Algorithms**: Select the encryption algorithm to be used on both endpoints
- **Lifetime**: Set the lifetime for Phase 2
- **PFS Group**: Select the Diffie-Hellman group for Perfect Forward Secrecy (PFS). This determines the session key generation during key exchange
4. Click **Apply**, then click **OK**
---
### Step 5: Configure Policies
The policy defines which traffic should pass through the VPN tunnel.
1. Click the **Policies** tab
2. Click **Add New**
3. Configure the following fields:
- **Peer**: Select the peer configured in Step 2
- **Tunnel**: Enable this option to establish the tunnel between both sites
- **Src. Address**: Enter the local IP address or network that will pass through the tunnel
- **Dst. Address**: Enter the remote IP address or network that will be received from the other end
- **Level**: Select "unique"
- **Proposal**: Select the proposal created in Step 4
4. Click **Apply**, then click **OK**
---
## Part 2: CONTROL Configuration
### Initial Navigation
1. Navigate to the **Links** section in the left-side menu
2. Select the **Services** tab at the top
3. Click the **+Add** button
---
### Step 1: Create IPsec Security Service (Phase 1)
1. Configure the basic information:
- **Name**: Enter a name to identify Phase 1
- **Short-name/code**: Enter a short identifier for quick reference
- **Organization**: Select the organization that will use this connection
- **Type**: Select "IPsec Security"
2. Click **Save** at the bottom
3. Configure the Phase 1 parameters to match your RouterOS configuration:
- **Authentication method**: Select "PSK"
- **IKE version**: Select "Version 2"
- **Encryption algorithm**: Enter "aes256"
- **Integrity algorithm**: Enter "sha256" or "sha2_256"
- **Diffie Hellman group (PFS)**: Enter "modp1024"
- **Lifetime**: Enter 1200 (equivalent to 20 minutes)
- **Key negotiation retries**: Enter "0"
- **Aggressive Mode**: Enable this option
4. Click **Save and close** at the bottom
---
### Step 2: Create IPsec Configuration Service (Phase 2)
1. In the **Services** tab, click **+Add** again to create another service
2. Configure the basic information:
- **Name**: Enter a name to identify Phase 2
- **Short-name/code**: Enter a short identifier for quick reference
- **Organization**: Select the organization that will use this connection
- **Type**: Select "IPsec Configuration"
3. Configure the Phase 2 parameters to match your RouterOS configuration:
- **Tunnel type**: Select "Tunnel (ESP)"
- **Encryption algorithm**: Enter "aes256"
- **Integrity algorithm**: Enter "sha256" or "sha2_256"
- **Diffie Hellman group (PFS)**: Enter "modp1024"
- **Lifetime**: Enter 1200 (equivalent to 20 minutes)
---
### Step 3: Create Association
1. In the **Links** section, select the **Association** tab
2. Click the **+Add** button
3. Configure the following fields:
- **Name**: Enter a name to identify this association
- **Short-name / code**: Enter a short identifier for quick reference
- **Type**: Leave "IPSec VPN" selected
- **Local gateway type**: Leave "Private IP" selected
- **Remote gateway address**: Enter the remote public IP address you are connecting to
- **Remote gateway id**: Enter the WAN interface IP of the RouterOS device
- **Secret**: Enter the pre-shared key (must match the secret configured in RouterOS)
- **Security service**: Select the IPsec Security service created in Step 1
- **Configuration service**: Select the IPsec Configuration service created in Step 2
- **Server**: Select the internal server to use
- **Organization**: Select the organization that will use this connection
---
### Step 4: Create Link
1. In the **Links** section, ensure you are on the **Links** tab
2. Click the **+Add** button
3. Configure the following fields:
- **Name**: Enter a name to identify this link
- **Short-name / code**: Enter a short identifier
- **Active**: Enable this option to activate the link
- **Association**: Select the association created in Step 3
- **Local network**: Enter the local Zequenze IP address
- For CONTROL: typically `172.31.255.254/32`
- For GATE: typically `172.31.255.253/32`
- (Verify the correct IP internally before configuring)
- **Remote network**: Enter the remote network or IP address that will pass through the tunnel to Zequenze
- **Check services**: Select "PING Connectivity test" to validate tunnel communication
- **Check address/hostname**: Enter a remote IP address that is always active for connectivity testing (typically the remote gateway, e.g., 192.168.106.154)
- **Organization**: Select the organization that will use this VPN connectivity
---
## Verification and Summary
### RouterOS Connection Status
Once the configuration is complete, you should see the connection established in RouterOS as shown below:
### CONTROL Connection Status
The Link within CONTROL should appear as follows when successfully established:
This completes the IPsec VPN tunnel configuration between RouterOS and CONTROL. The tunnel should now be active and passing traffic between the configured networks.
# Setting up TR-069 client on mikrotik hAP ac2
## Prerequisites
Before configuring the TR-069 client, ensure your MikroTik hAP ac2 device has an active internet connection.
## Required Configuration Parameters
You will need the following credentials and settings to configure the TR-069 client in CONTROL:
- **ACS URL:** The endpoint URL where your device will report its status and receive management commands
- **Username:** Authentication username for the ACS URL
- **Password:** Authentication password for the ACS URL
> **Note:** These credentials should be provided by your CONTROL administrator or obtained from your CONTROL portal settings.
## Configuration Steps
Follow the video tutorial below for step-by-step instructions on configuring the TR-069 client on your MikroTik hAP ac2:
## Additional Information
The TR-069 protocol enables remote management and monitoring of your MikroTik device through the CONTROL platform. Once configured, your device will automatically establish communication with the ACS server and appear in your CONTROL dashboard.
# Stun and Ejabberd monitoring
# Ejabberd API
## Overview
The Ejabberd API provides RESTful endpoints for managing and monitoring XMPP server operations within CONTROL. All requests require HTTP basic authentication and use JSON for request/response payloads.
## Authentication
All API endpoints require basic authentication using admin credentials:
- **Username**: `root@control-xmpp-dev.zequenze.com`
- **Password**: Your admin API token
- **Base URL**: `https://127.0.0.1:5443/api/`
## API Endpoints
### Get Registered Stats Hosts
Retrieves statistics for registered hosts, including online user counts.
**Endpoint**: `/stats_host`
**Request Parameters**:
- `name` - The statistic name (e.g., "onlineusers")
- `host` - The XMPP host domain
**Example**:
```bash
curl -k --basic --user root@control-xmpp-dev.zequenze.com:6N3Zne3ByoSCnZ3d46Gerf452nxLBcNp \
-H 'Content-Type: application/json' \
-d '{ "name": "onlineusers", "host": "control-xmpp-dev.zequenze.com" }' \
'https://127.0.0.1:5443/api/stats_host'
```
### Get Connected Users
Returns a list of all currently connected users.
**Endpoint**: `/connected_users`
**Example**:
```bash
curl -k --basic --user root@control-xmpp-dev.zequenze.com:6N3Zne3ByoSCnZ3d46Gerf452nxLBcNp \
'https://127.0.0.1:5443/api/connected_users'
```
### Get Registered Users
Retrieves all registered users for a specific host.
**Endpoint**: `/registered_users`
**Request Parameters**:
- `host` - The XMPP host domain
**Example**:
```bash
curl -k --basic --user root@control-xmpp-dev.zequenze.com:6N3Zne3ByoSCnZ3d46Gerf452nxLBcNp \
-H 'Content-Type: application/json' \
-d '{ "host": "control-xmpp-dev.zequenze.com" }' \
'https://127.0.0.1:5443/api/registered_users'
```
### Get Connected Users Info
Returns detailed information about all connected users.
**Endpoint**: `/connected_users_info`
**Example**:
```bash
curl -k --basic --user root@control-xmpp-dev.zequenze.com:6N3Zne3ByoSCnZ3d46Gerf452nxLBcNp \
'https://127.0.0.1:5443/api/connected_users_info'
```
### Get User Presence
Retrieves the presence status for a specific user.
**Endpoint**: `/get_presence`
**Request Parameters**:
- `user` - The username
- `host` - The XMPP host domain
**Example**:
```bash
curl -k --basic --user root@control-xmpp-dev.zequenze.com:6N3Zne3ByoSCnZ3d46Gerf452nxLBcNp \
-H 'Content-Type: application/json' \
-d '{ "user": "hy400219100000286", "host": "control-xmpp-dev.zequenze.com" }' \
'https://127.0.0.1:5443/api/get_presence'
```
### Get User Session Info
Returns detailed session information for a specific user.
**Endpoint**: `/user_sessions_info`
**Request Parameters**:
- `user` - The username
- `host` - The XMPP host domain
**Example**:
```bash
curl -k --basic --user root@control-xmpp-dev.zequenze.com:6N3Zne3ByoSCnZ3d46Gerf452nxLBcNp \
-H 'Content-Type: application/json' \
-d '{ "user": "hy400219100000286", "host": "control-xmpp-dev.zequenze.com" }' \
'https://127.0.0.1:5443/api/user_sessions_info'
```
### Get User Resources
Retrieves all active resources (connections) for a specific user.
**Endpoint**: `/user_resources`
**Request Parameters**:
- `user` - The username
- `host` - The XMPP host domain
**Example**:
```bash
curl -k --basic --user root@control-xmpp-dev.zequenze.com:6N3Zne3ByoSCnZ3d46Gerf452nxLBcNp \
-H 'Content-Type: application/json' \
-d '{ "user": "hy400219100000286", "host": "control-xmpp-dev.zequenze.com" }' \
'https://127.0.0.1:5443/api/user_resources'
```
# Customer Engineering
# ACS Operational Launch Checklist
## Overview
This checklist ensures a successful ACS operational launch for CONTROL. Complete each step in sequence before deploying devices to end-customers.
---
## Prerequisites Checklist
### 1. Device Testing and Integration
All devices **must be tested and integrated** in the development platform before proceeding to production.
**Development Platform:** [control-dev.zequenze.com](https://control-dev.zequenze.com/admin/)
Ensure all device profiles are validated and functioning correctly in this environment.
---
### 2. DNS Configuration
Configure your own [FQDN](https://en.wikipedia.org/wiki/Fully_qualified_domain_name) pointing to Zequenze's production environment. This allows your devices to use a domain under your management.
**Typical DNS Configuration:**
```
acs.myMVNO.com CNAME control.zequenze.com.
```
Replace `myMVNO.com` with your actual domain name.
---
### 3. TR-069 Credentials Configuration
All devices (modems) must have TR-069 credentials properly configured with the following parameters:
- **URL:** `https://acs.myMVNO.com/cwmp`
- **Username:** To be agreed (typically the same as used in the development platform)
- **Password:** To be agreed (typically the same as used in the development platform)
**Important:** These TR-069 settings **must** be configured by default in the device's firmware/software. This ensures that devices continue reporting to the ACS platform even after a factory reset.
---
## Production Validation Testing
Before deploying to end-customers, perform the following validation tests on the production environment. This step requires completion of steps 1-3 above.
### Required Validation Tests
- [ ] **Configure test modem** — Ensure the modem has Internet access and can reach the ACS
- [ ] **Validate onboarding** — Verify proper device onboarding and visualization through both WebGUI and REST API
- [ ] **Validate operations** — Test configuration changes and operational commands (Reboot, Factory Reset)
- [ ] **Validate use cases** — Test any additional validations or specific use cases required for your deployment
All tests must complete successfully before proceeding to deployment.
---
## Deployment Authorization
Once all validation tests are successful, you are authorized to begin deploying devices to end-customers.
**Final Verification:**
- ✓ All devices validated in development platform
- ✓ FQDN created and DNS configured
- ✓ Modems configured with correct TR-069 credentials
- ✓ Production validation tests completed successfully
# Configuring STUN (UDP-based connection request)
## Overview
[STUN](https://en.wikipedia.org/wiki/STUN) (Session Traversal Utilities for NAT) is a [TR-069](https://en.wikipedia.org/wiki/TR-069) [connection-request](https://www.qacafe.com/resources/connection-request-basics/) helper protocol that enables the ACS (Auto Configuration Server) to reach CPE (Customer Premises Equipment) devices that cannot be accessed via direct HTTP requests. STUN is typically required when the CPE is located behind a firewall or a [NAT](https://en.wikipedia.org/wiki/Network_address_translation) (Network Address Translation) process.
[](https://docs.zequenze.com/uploads/images/gallery/2022-03/sDrkfQJ9NZQYWCwj-stun-diagram.png)
## Configuration Requirements
To enable STUN functionality, both the CONTROL ACS platform and the CPE must be properly configured.
## CPE Configuration
Configuring STUN on the CPE is straightforward and requires only two parameters:
- **STUN Server FQDN**: The [Fully Qualified Domain Name](https://en.wikipedia.org/wiki/Fully_qualified_domain_name) of the STUN server
- **Port**: The UDP port number for STUN communication
### Development Environment Settings
For testing and development purposes, use the following configuration:
```
STUN Server: control-stun-dev.zequenze.com
Port: 3478
```
## CONTROL ACS Configuration
On the CONTROL ACS platform, STUN-related variables must be added to the Device Profile. A typical configuration example:
[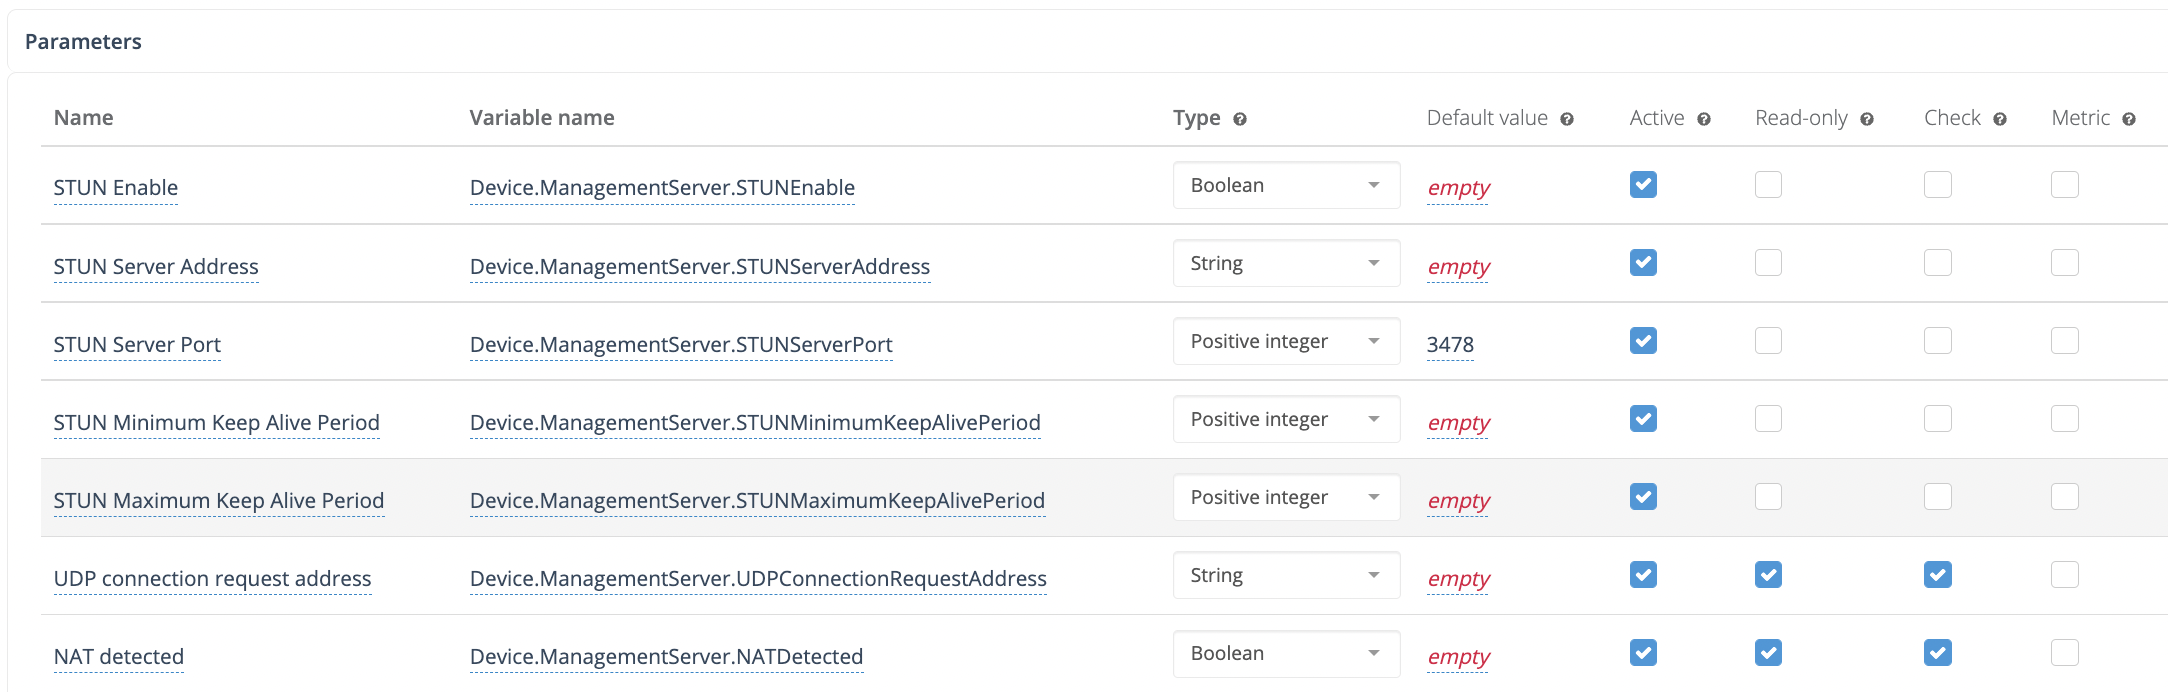](https://docs.zequenze.com/uploads/images/gallery/2022-03/opn9ALR5ivocjboL-stun-config.png)
## How STUN Connection Requests Work
Once STUN is configured on both the ACS and CPE:
1. The CPE establishes a UDP binding with the STUN server
2. The CPE reports this UDP binding address to the ACS using the TR-181 parameter: `Device.ManagementServer.UDPConnectionRequestAddress`
3. The ACS uses this reported address for all subsequent connection-request procedures
This mechanism allows the ACS to communicate with CPE devices even when they are not directly accessible via traditional HTTP connection requests.
# FAQ ACS | MVNO ALTAN
# Plataforma ACS Zequenze para MVNO ALTAN
## Preguntas Frecuentes
---
## ¿Qué es y para qué sirve la plataforma ACS Zequenze?
La plataforma ACS Zequenze permite al MVNO gestionar y operar los dispositivos de cliente (por ejemplo, módems) de forma remota, segura y automatizada.
[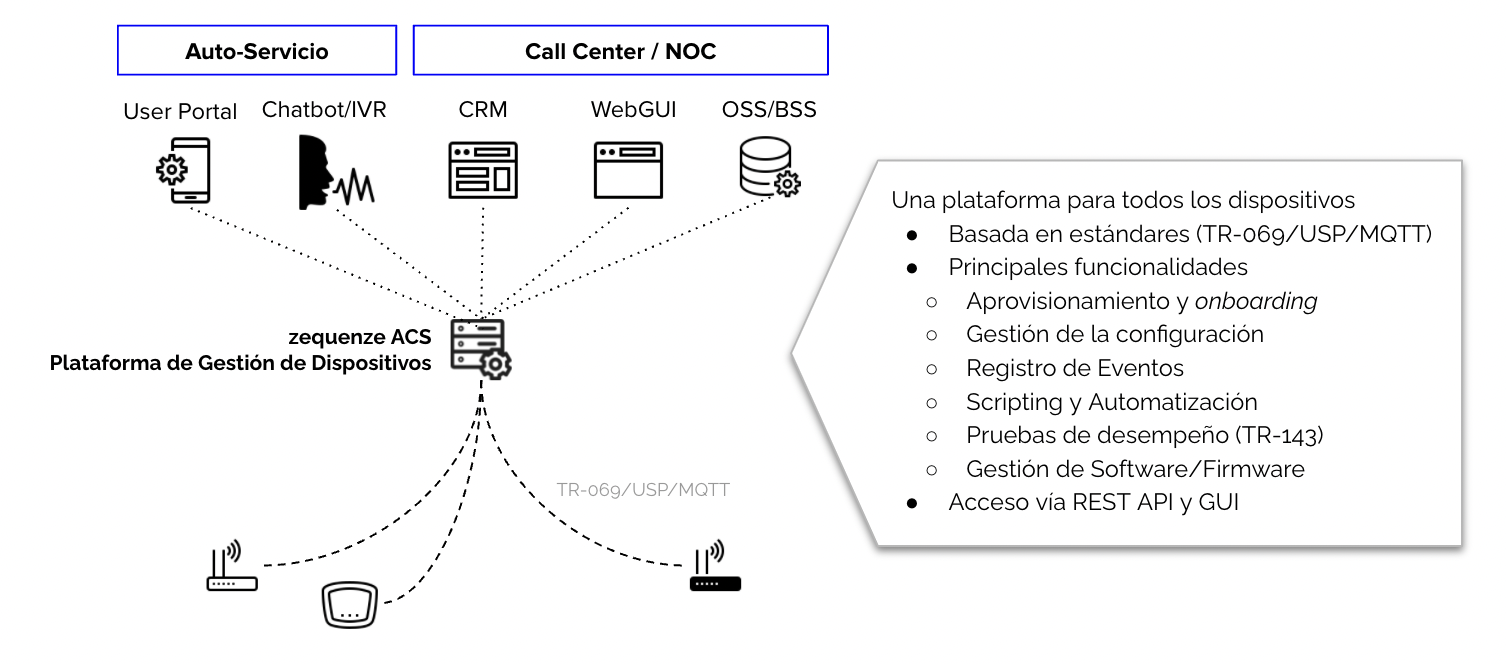](https://docs.zequenze.com/uploads/images/gallery/2022-03/cF5RWBFh8Lv4x61X-acs-diagram-es.png)
### Principales funcionalidades
Las principales tareas que se pueden realizar y automatizar a través de la plataforma ACS Zequenze son:
- Aprovisionamiento y *onboarding* de dispositivos en la plataforma
- Visualización de la configuración y valores operacionales del módem (por ejemplo, red LTE, red WiFi)
- Cambios en la configuración de los dispositivos (por ejemplo, nombre/contraseña WiFi, canal de red WiFi)
- Operaciones de *Reboot* y *Factory Reset* en el dispositivo
- Gestión de actualizaciones de firmware/software de los dispositivos
- Gestión de pruebas de desempeño (Download, Upload, Delay/Jitter) en los dispositivos
### Reportes y analíticos
Adicionalmente, la plataforma provee extensos reportes y analíticos sobre los dispositivos, incluyendo:
- Estatus en tiempo real de los dispositivos (con conectividad a Internet)
- Analíticos sobre marca y modelo de dispositivos en la red
- Analíticos sobre versión de software en los dispositivos
- Analíticos en tiempo real sobre parámetros LTE de los dispositivos (RSSI, SINR, otros)
### Interfaces de gestión
Como se indica en el diagrama anterior, la gestión de los dispositivos está disponible mediante:
- **WebGUI**: Para operadores NOC o Ingeniería
- **REST API**: Para integración con plataformas CRM o similares (por ejemplo, operadores de Call Center)
---
## ¿Qué necesito para gestionar mis dispositivos con la plataforma ACS Zequenze?
El único requisito es que los dispositivos de usuario (módems) soporten el **protocolo estándar TR-069** y que estén apropiadamente configurados para reportar hacia la plataforma ACS Zequenze.
### Configuración para pruebas
Para fines de **pruebas**, los dispositivos pueden ser fácilmente configurados para reportar a la plataforma con solo estos tres parámetros:
- **URL**: `https://prueba-altan.zequenze.com/`
- **Usuario**: *a ser acordado*
- **Contraseña**: *a ser acordado*
### Configuración para producción
Una vez validada la integración de cada tipo de dispositivo, se podrá acordar el mecanismo con el cual se configurarán en forma masiva los dispositivos de usuarios. Los métodos más típicos son:
**Para nuevos dispositivos:**
- Pre-configuración TR-069 vía firmware/software en el dispositivo (URL, Usuario, Contraseña)
**Para dispositivos existentes:**
- Actualización del firmware/software (FOTA) que integre la apropiada configuración TR-069 del dispositivo (URL, Usuario, Contraseña)
---
## ¿Puedo migrar mis dispositivos de un ACS existente a la plataforma ACS Zequenze?
Absolutamente.
Una de las ventajas del protocolo utilizado por las plataformas ACS (TR-069) es que es estándar y no permite hacer *lock-in* de los clientes en una plataforma ACS en particular.
Una vez que se valide la integración de tus dispositivos con la plataforma ACS Zequenze, podremos establecer un plan para esta migración, lo cual es tan sencillo como:
- Cambiar el URL del ACS en tus dispositivos (vía la plataforma ACS actual), o bien
- Reconfigurar el FQDN del URL al que apuntan tus dispositivos actualmente
---
## ¿Cómo gestiono mis dispositivos vía la plataforma ACS Zequenze?
Según lo mencionado anteriormente, la plataforma provee interfaces **WebGUI** y **REST API** para la gestión de los dispositivos.
[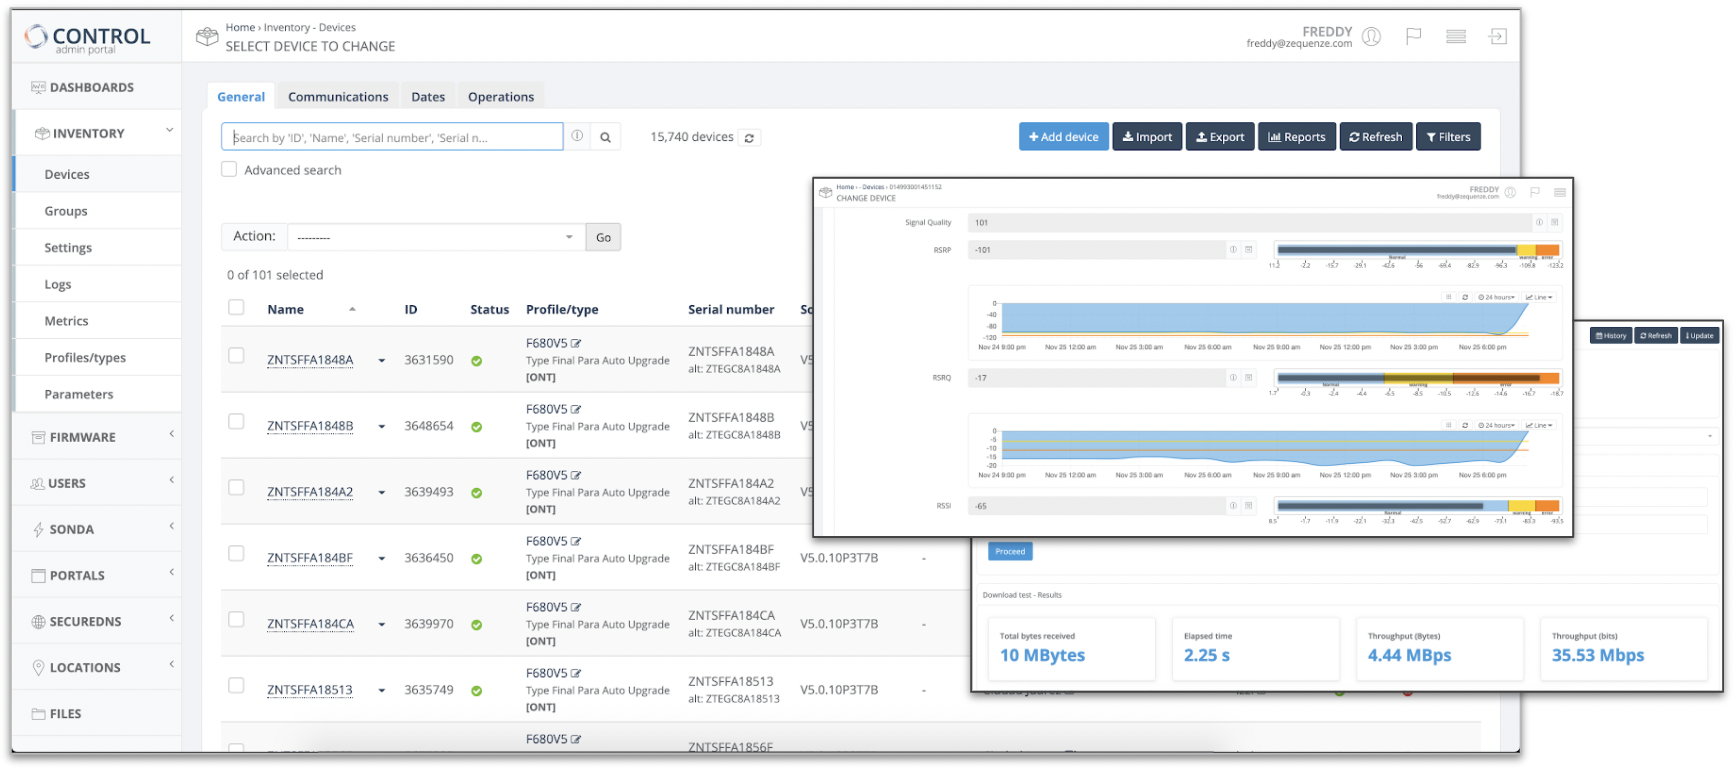](https://docs.zequenze.com/uploads/images/gallery/2022-03/LWvobLRMWJn33Vjl-acs-gui.png)
Ejemplo WebGUI plataforma ACS Zequenze
---
## ¿Qué diferencia la solución ACS Zequenze de otras soluciones del mercado?
Podemos resumir las principales diferencias en dos áreas:
### Relacionadas a la plataforma ACS
- Plataforma de última generación hospedada en la nube pública que permite escalar desde pocos miles a millones de dispositivos gestionados
- Plataforma **ya integrada** con la red ALTAN y con la mayoría de los dispositivos (módems) HBB existentes en la red
- Plataforma multi-organizacional, que permite la existencia de diferentes organizaciones administrativas (jerárquicas) para los dispositivos y usuarios de la misma
- Diferentes tipos de privilegios para usuarios de la plataforma *(solo lectura, gestión básica, gestión avanzada)*
- Flexibilidad en la definición de los perfiles de dispositivos, pudiendo adaptarnos a cualquier modelo de datos del fabricante (TR-098, TR-181, TR-135, etc.)
- Herramientas de automatización y *scripting*, permitiendo realizar cambios de configuración o generación de reportes específicos sobre una población del parque de dispositivos
### Relacionadas a Zequenze como empresa
- Amplia experiencia de trabajo con operadores de telecomunicaciones en México y Latinoamérica
- Soporte técnico experto local, con profundo entendimiento y experiencia en gestión de dispositivos (TR-069, USP, MQTT, etc.)
- Estamos comprometidos con el mejor servicio a nuestros clientes y *nunca* anteponemos la burocracia a la eficiencia
- Somos 10x más ágiles que cualquier suministrador clásico de soluciones de software para telecomunicaciones
Si deseas conocer más de Zequenze, te invitamos a visitar nuestro website **https://zequenze.com**
---
## Checklist y próximos pasos
Si deseas evaluar o implementar la plataforma ACS Zequenze, puedes contactarnos directamente escribiéndonos a **team@zequenze.com**
Por favor incluye la siguiente información:
- Nombre del MVNO e información de contacto
- Estimación de número de dispositivos **activos** al mes
- Tipos/Marcas de dispositivos (módems)
> **Importante:** No olvides confirmar que cuentan con el soporte de TR-069 con el fabricante/suministrador del módem
# How to onboard devices into zequenze CONTROL ACS
## Overview
Onboarding devices into **Zequenze CONTROL** is a straightforward process. This guide provides the key considerations and steps to successfully connect your devices to the CONTROL Access Control Server (ACS).
[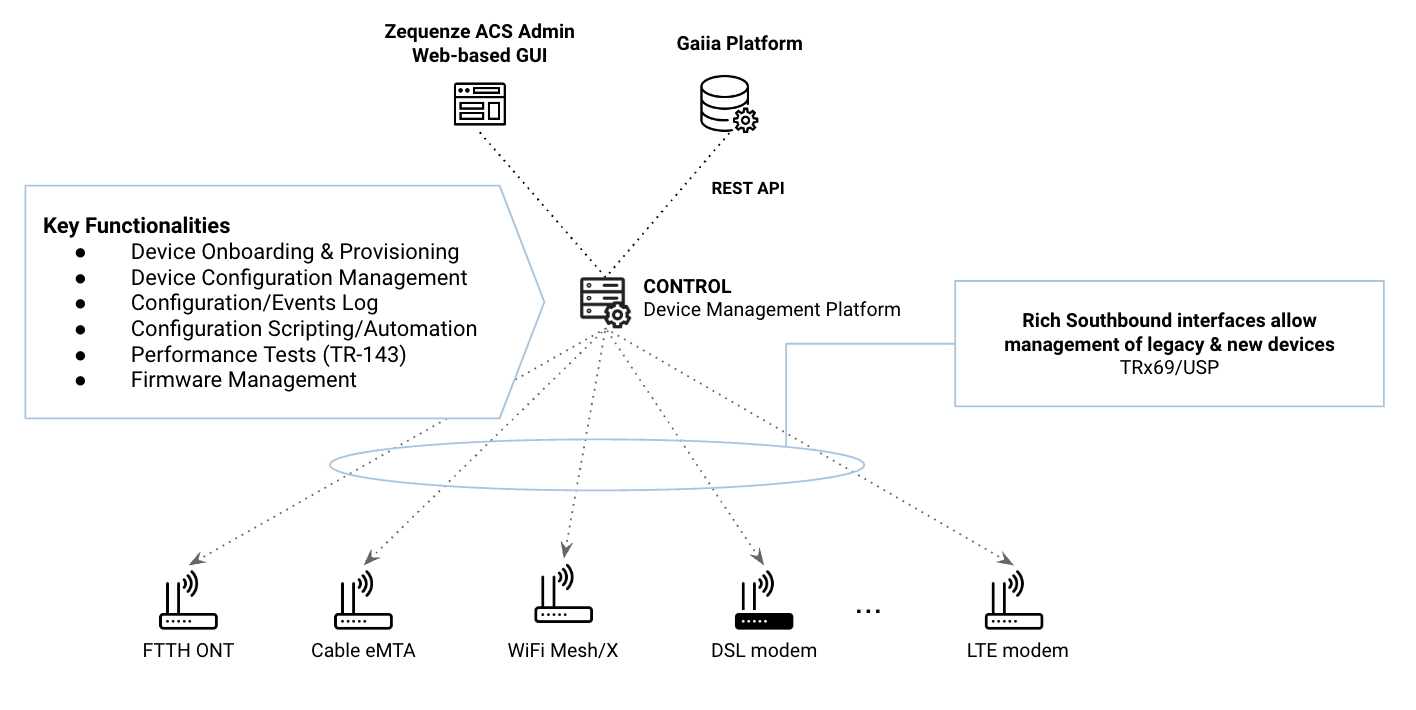](https://docs.zequenze.com/uploads/images/gallery/2023-10/P9uySEm7vKDhBxHn-gaiia-zqz.png)
### Key Concepts
Before beginning the onboarding process, understand these fundamental aspects:
1. **Cloud-Based Architecture**: Zequenze ACS is hosted in the Public Cloud (AWS/GCP), so all devices must have Internet connectivity to communicate with the platform.
2. **TR-069 Protocol**: The protocol follows a *client-to-server* model where devices (CPEs) periodically report to the ACS at intervals defined by the *Report Interval* parameter. For a comprehensive understanding of TR-069, refer to this **tutorial**.
3. **Remote Management**: Once successfully onboarded, the ACS enables remote configuration and management of CPEs using TR-069 variables supported by each device. These variables are defined in TR-098/TR-181 Data Models and can be managed through the ACS platform GUI or REST API.
---
## Requirements
### Mandatory Parameters
For a CPE to communicate with the ACS platform via TR-069, configure the following four (4) parameters:
1. **ACS URL**: The FQDN where devices will initiate TR-069 sessions.
2. **Username & Password**: Onboarding credentials used by the CPE to authenticate with the ACS platform.
3. **Report Interval**: Time interval (in seconds) for periodic Inform messages from the CPE to the ACS platform.
4. **Internet Connectivity**: Required for cloud-based ACS access. **Note**: Some CPEs, such as FTTH ONTs, may require specific WAN VLAN configuration to permit TR-069 traffic.
### DNS Configuration
Internet Service Providers (ISPs) must define their own FQDN as a CNAME record pointing to the Zequenze ACS platform. For example:
```
acs.myISP.com CNAME A control.zequenze.com.
```
---
## Configuration
### Default TR-069 Parameters
Once DNS is configured, set up your devices with the following default TR-069 configuration:
- **URL**: `https://acs.myISP.com/cwmp`
- **Username**: *Provided by Zequenze (unique per device model)*
- **Password**: *Provided by Zequenze (unique per device model)*
- **Report Interval**: *Provided by Zequenze (typically 7200 seconds)*
### Configuration Methods
There are two (2) primary methods for mass-configuring default TR-069 settings on devices:
1. **Vendor Integration**: Request your CPE vendor to embed this information into the device's software default values.
2. **DHCP Option 43**: Use DHCP Option 43 to provision TR-069 parameters automatically.
For more details on ACS Discovery methods, consult this **tutorial**.
### Important Considerations
**CRITICAL**: Verify that the default TR-069 configuration persists after a factory reset. This ensures devices remain under ACS management even after being reset to factory defaults.
---
## Validation
### Verifying Successful Onboarding
Once properly configured with Internet access, devices will automatically onboard to the platform. Successfully onboarded devices appear in the **Inventory** view of the CONTROL GUI:
[](https://docs.zequenze.com/uploads/images/gallery/2023-09/RhJUdS6KQVDKZ0Jy-control-gui-01.png)
### Inventory View Fields
The following table explains the information displayed in the Inventory view:
| Field | Description |
| ---: | :--- |
| **Name** | Unique device name in the platform. Automatically generated as the concatenation of Device OUI + Serial Number. Upon initial onboarding with model-specific credentials, the ACS assigns unique Username/Password credentials to each device. |
| **ID** | Device's unique identifier within the ACS platform. |
| **Status** | Indicates whether the device is currently reporting periodically to the platform. |
| **Profile** | CWMP (TR-069) profile assigned to this device. Each device model uses a specific profile based on its data model, which can be customized per customer requirements. |
| **Serial** | Device serial number. |
| **Groups** | Logical groups to which the device belongs. |
| **Location** | Physical location assigned to the device. |
| **Description** | Notes and metadata about the device. By default, the initial onboarding timestamp is recorded here. |
---
## Troubleshooting
### Common Issues
If a configured device does not automatically onboard, verify the following:
1. **ACS URL Configuration**: Confirm the ACS URL is correctly set on the device (check in the device's GUI or management interface).
2. **Credentials**: Verify that Username and Password are properly configured on the device (check in the device's GUI or management interface).
3. **Internet Connectivity**: Ensure the device has active Internet access. **Note**: Some CPEs, particularly FTTH ONTs, require specific WAN VLAN configuration to allow TR-069 traffic through the network.
### Additional Support
If you continue experiencing onboarding issues after performing these checks, our team is available to assist with detailed troubleshooting. Please **contact us** for specialized support.
---
# How to setup a webserver for TR-143 Performance Tests
TR-143 defines the standard framework for running performance tests from a CPE (Customer Premises Equipment) through the TR-069 protocol. Specifically for the Download and Upload tests, the CPE requires a functional HTTP server to either download or upload files to compute current throughput and measure network performance.
This guide explains how to configure a web server that supports both download and upload functionality for TR-143 performance testing when using CONTROL.
## Requirements
Linux server (this guide uses Ubuntu 24.04 LTS)
Root or sudo access
Network connectivity between the CPE and the server
Edit the Nginx configuration file located at `/etc/nginx/sites-available/default` with the following content:
```nginx
server {
listen 80;
server_name noname;
root /var/www/files/download;
location / {
autoindex off;
}
client_max_body_size 100M;
location /upload {
client_body_temp_path /tmp;
alias /var/www/files/upload;
dav_methods PUT;
dav_access user:rw group:rw all:r;
}
}
```
**Configuration notes:**
- `listen 80` — Server listens on HTTP port 80
- `root /var/www/files/download` — Root directory for download files
- `client_max_body_size 100M` — Maximum upload file size set to 100MB
- `dav_methods PUT` — Enables HTTP PUT method for file uploads
- `location /upload` — Dedicated endpoint for upload operations
### Apply Configuration
Verify the configuration syntax:
```bash
sudo nginx -t
```
If the configuration is valid, restart Nginx to apply changes:
```bash
sudo systemctl restart nginx
```
## Testing the Setup
### Download Test
To test download functionality, first create a test file in the download directory (e.g., `100MB.bin`), then download it from a client machine:
```bash
wget http:///100MB.bin
```
### Upload Test
To test upload functionality, upload a file from your local machine to the server (uploading a file named **`test-upload.bin`** from your local host to the server):
```bash
curl -X PUT --data-binary @test-upload.bin http:///upload/test-upload.bin
```
Replace `` with your server's actual IP address and ensure the test file exists locally before running the upload command.
## Troubleshooting
Verify Nginx is running: `sudo systemctl status nginx`
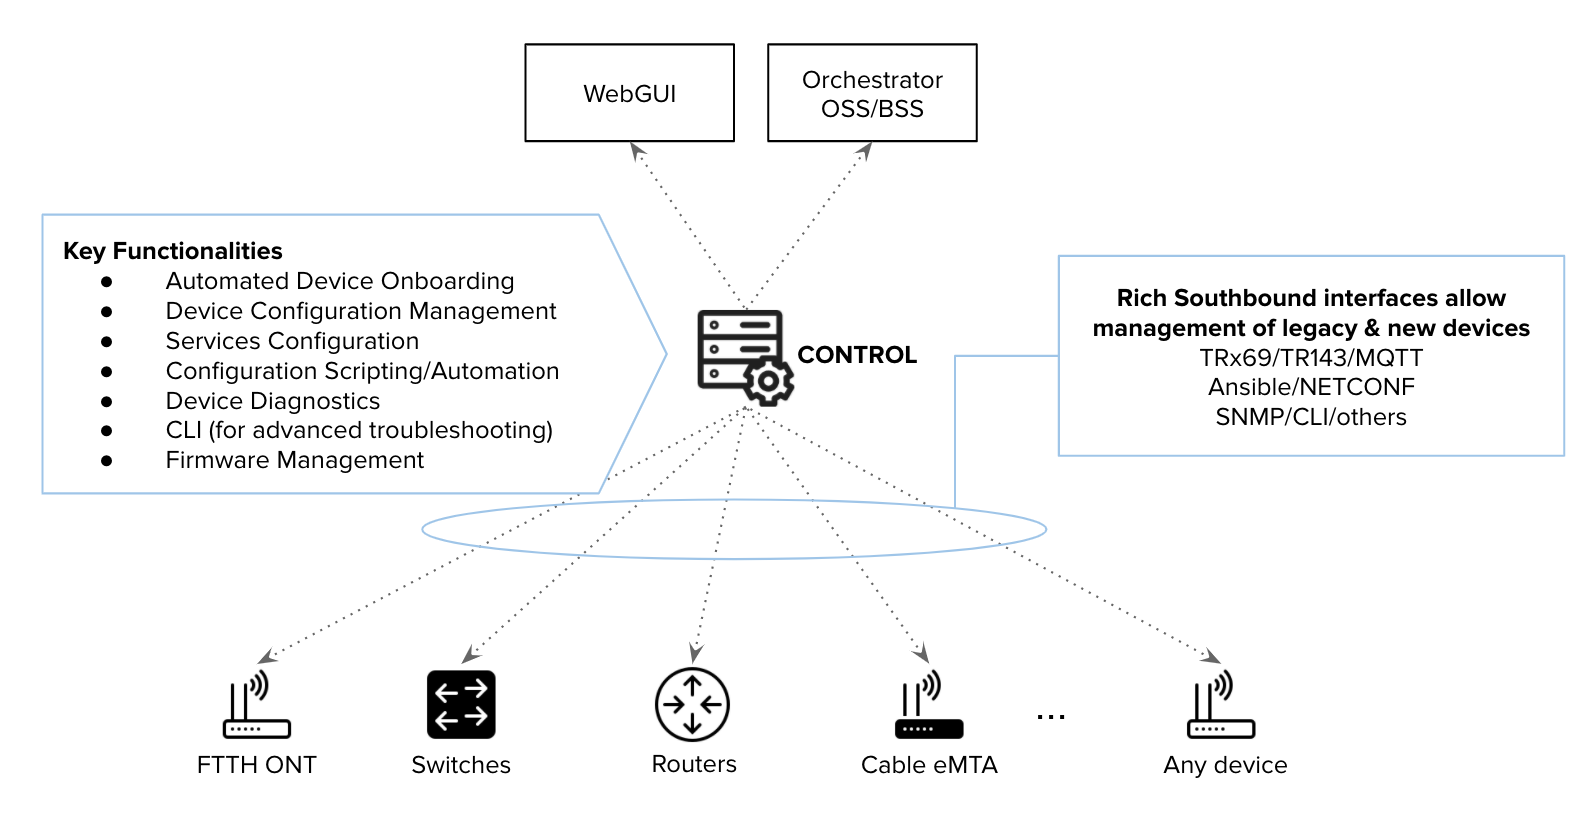
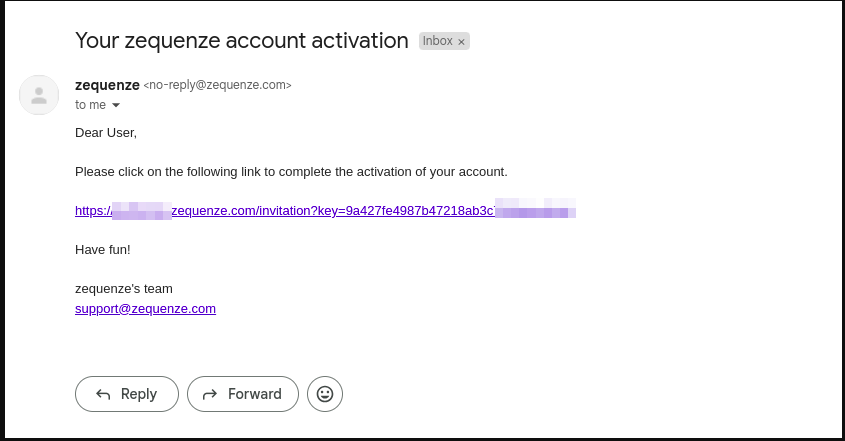 After receiving the invitation, click the link to set up your password. You will see a page similar to this example:
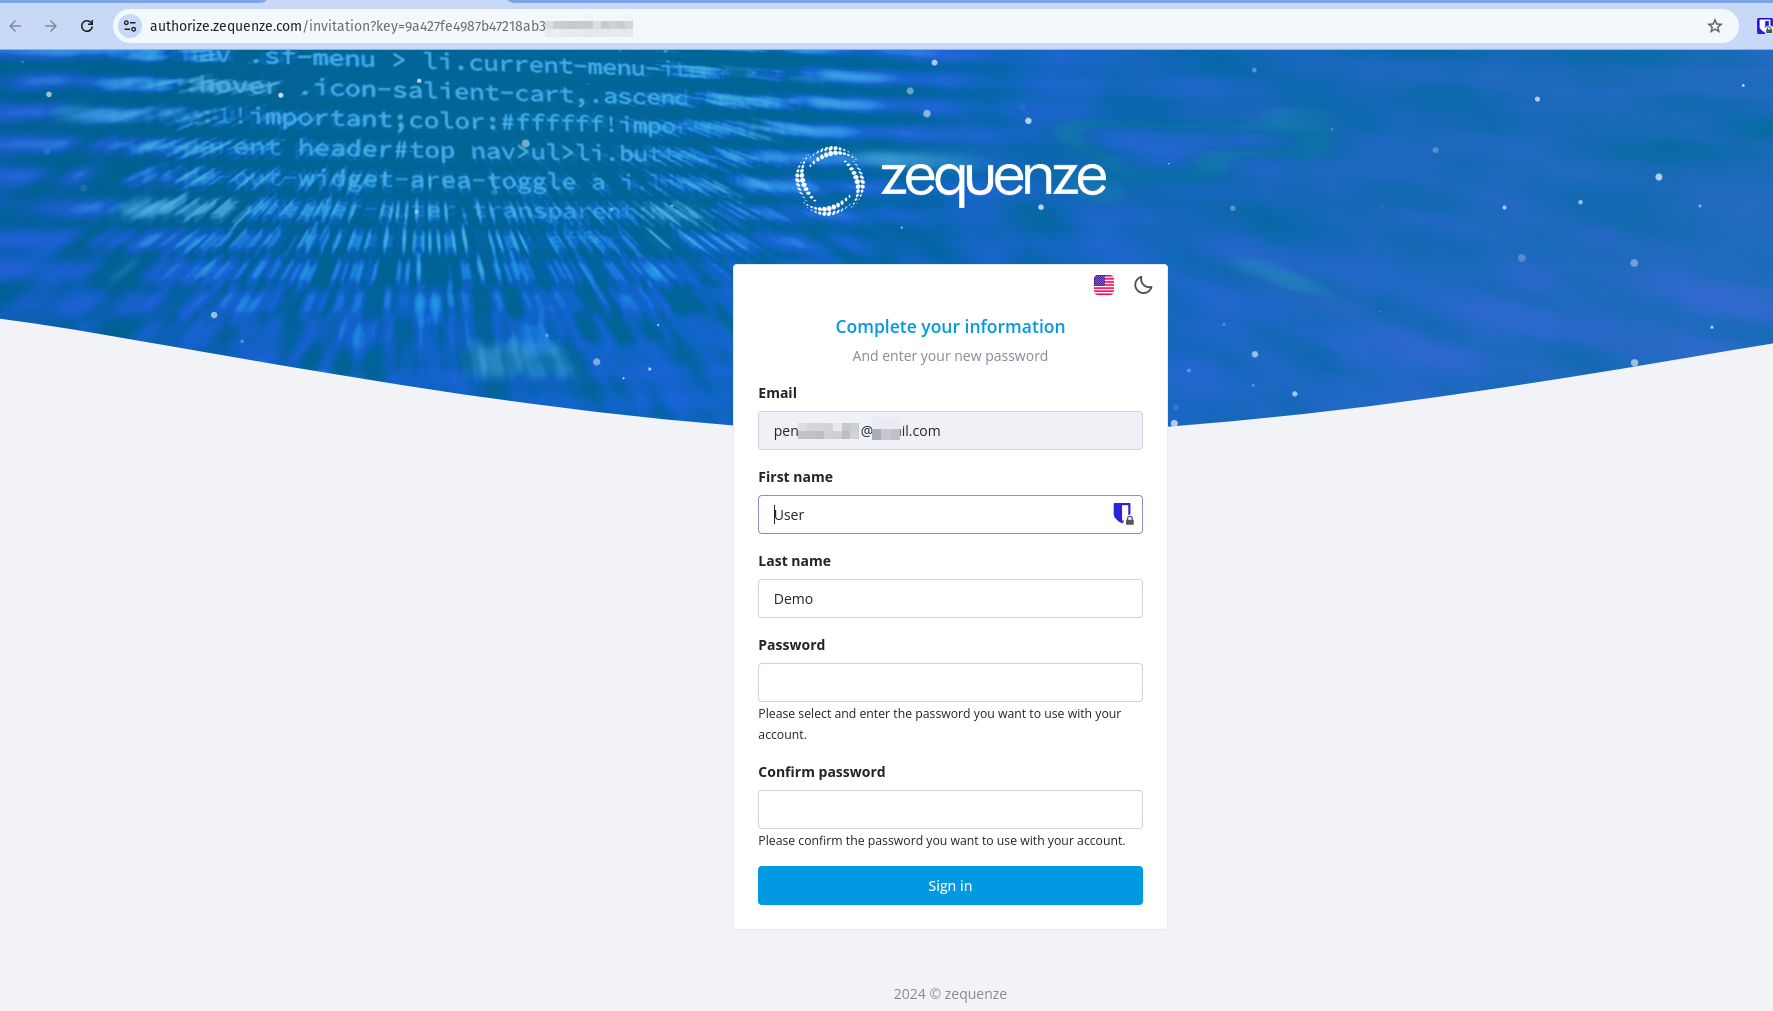 Once the process is complete, you will be redirected to the CONTROL platform:
 ## Understanding the CONTROL Interface
Now that you're logged into the CONTROL platform, let's explore the available options:
## Understanding the CONTROL Interface
Now that you're logged into the CONTROL platform, let's explore the available options:
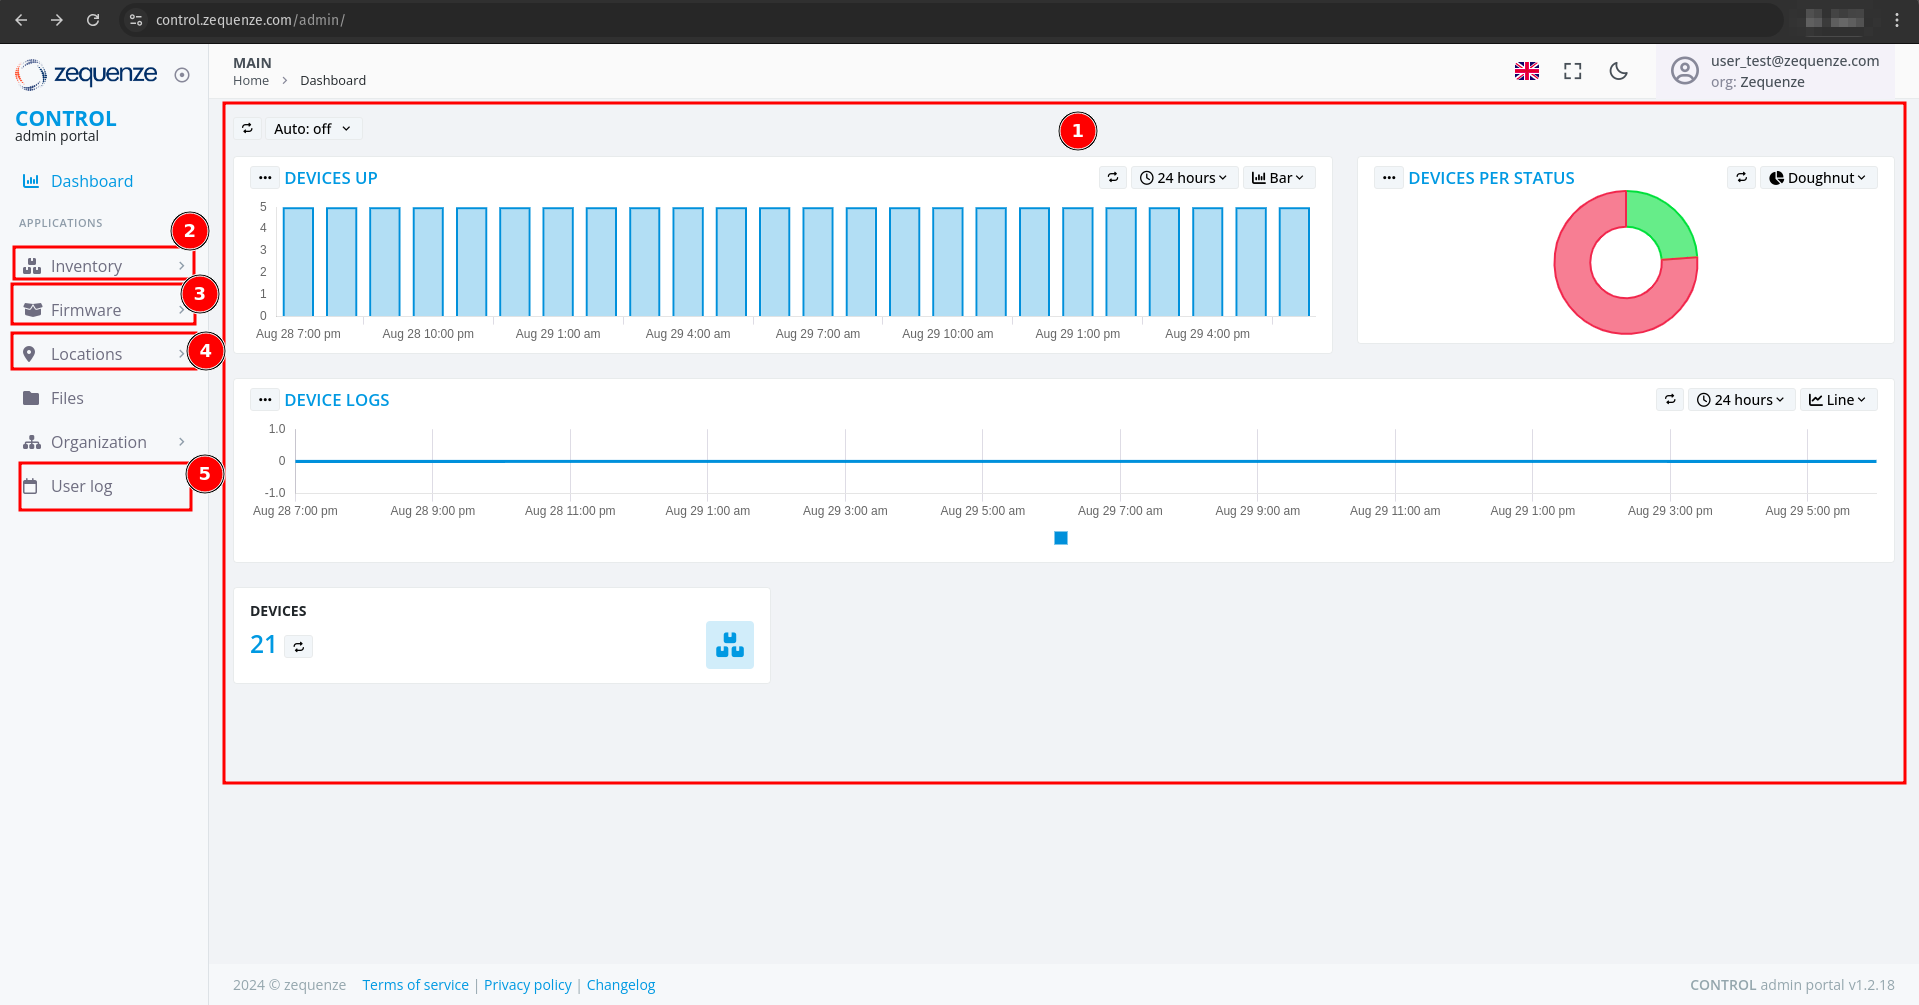 ### Main Dashboard
In the center of the screen, you'll find a series of customizable reports in the **Main Dashboard**. These reports include:
- **Devices UP** - Shows currently active devices
- **Devices Per Status** - Displays device status distribution
- **Devices Logs** - Provides access to device log information
All of these reports are customizable if needed to suit your monitoring requirements.
### Navigation Menu
The left-side menu provides access to key platform sections:
1. **Inventory** - View devices, create configurations, and add parameters for each profile. In this section you can view the devices, create configurations, and add the parameters you need for each profile.
2. **Firmware** - Upload different firmware versions for upgrades or downgrades, and customize firmware update workflows. You can upload different versions of firmware for upgrade or downgrade, and customize the workflow for firmware upgrades as needed.
3. **Locations** - Create and manage physical locations using:
- Geo-localization with coordinates
- Custom labels to identify device groups
- Organization by OLT or DOCSIS CMTS connections
This section is very useful when you need to create different physical locations, geo-localization with coordinates, or custom labels to identify groups of devices connected to the same OLT or DOCSIS CMTS.
4. **User Log** - View all transactions and changes made within the platform. This section allows you to view all transactions or changes that have been made in the platform.
## Enabling Expert Mode
To access advanced features, you need to activate **Expert Mode**:
1. Check the **Expert mode** checkbox
2. Refresh the webpage by pressing **F5** or using your browser's refresh button
### Main Dashboard
In the center of the screen, you'll find a series of customizable reports in the **Main Dashboard**. These reports include:
- **Devices UP** - Shows currently active devices
- **Devices Per Status** - Displays device status distribution
- **Devices Logs** - Provides access to device log information
All of these reports are customizable if needed to suit your monitoring requirements.
### Navigation Menu
The left-side menu provides access to key platform sections:
1. **Inventory** - View devices, create configurations, and add parameters for each profile. In this section you can view the devices, create configurations, and add the parameters you need for each profile.
2. **Firmware** - Upload different firmware versions for upgrades or downgrades, and customize firmware update workflows. You can upload different versions of firmware for upgrade or downgrade, and customize the workflow for firmware upgrades as needed.
3. **Locations** - Create and manage physical locations using:
- Geo-localization with coordinates
- Custom labels to identify device groups
- Organization by OLT or DOCSIS CMTS connections
This section is very useful when you need to create different physical locations, geo-localization with coordinates, or custom labels to identify groups of devices connected to the same OLT or DOCSIS CMTS.
4. **User Log** - View all transactions and changes made within the platform. This section allows you to view all transactions or changes that have been made in the platform.
## Enabling Expert Mode
To access advanced features, you need to activate **Expert Mode**:
1. Check the **Expert mode** checkbox
2. Refresh the webpage by pressing **F5** or using your browser's refresh button
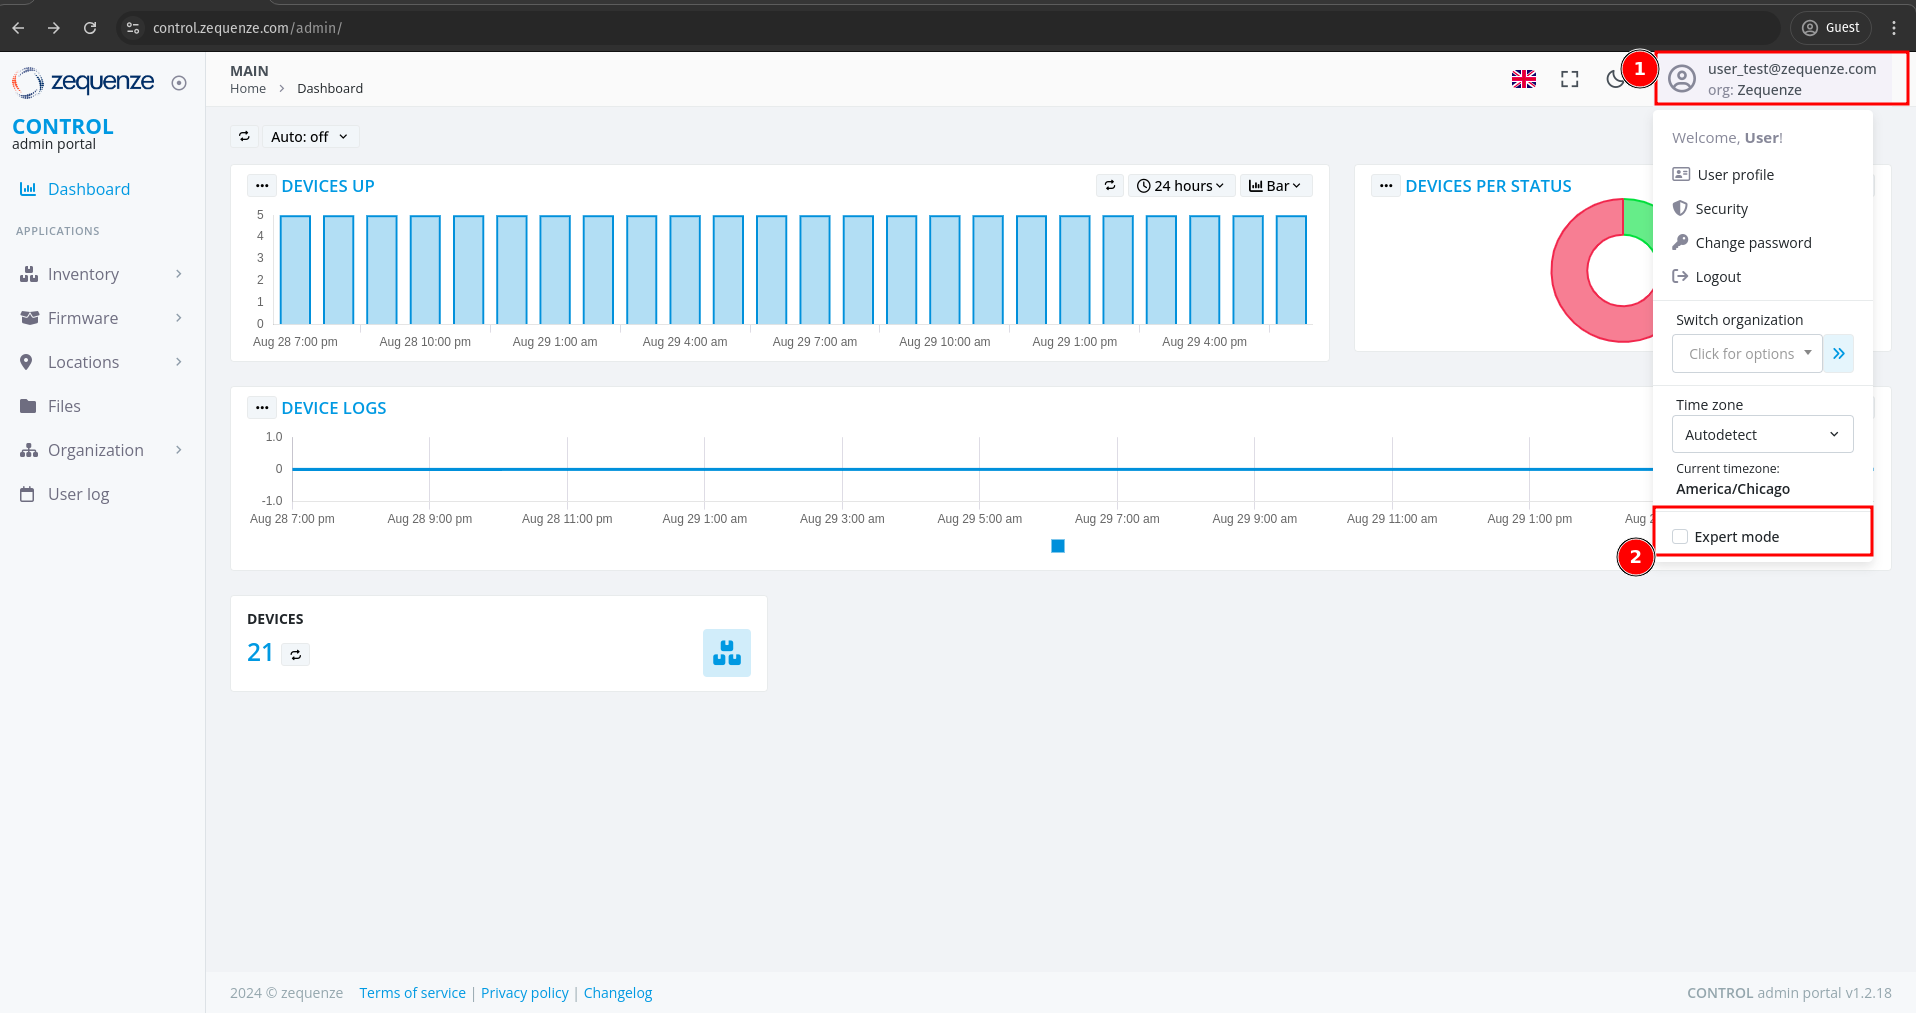 This activates additional options and advanced functionality within the CONTROL platform.
---
This completes the basic overview of the CONTROL platform. The next step is to create a Profile.
# Profile
## Creating a New Profile
Before creating a profile, it's important to understand its purpose. Profiles are where you configure key device settings such as:
- WAN interface configurations
- Custom WiFi network names (e.g., "ISP-Provider-2.4GHz" for 2.4GHz networks)
- 5.0GHz network configurations
- Other device-specific parameters
This is where the magic happens when you want to create new interfaces or set up custom configurations for your devices.
### Steps to Create a Profile
1. Navigate to **Inventory** in the CONTROL portal
2. Click on **Profile**
3. Click the **Add** button
This activates additional options and advanced functionality within the CONTROL platform.
---
This completes the basic overview of the CONTROL platform. The next step is to create a Profile.
# Profile
## Creating a New Profile
Before creating a profile, it's important to understand its purpose. Profiles are where you configure key device settings such as:
- WAN interface configurations
- Custom WiFi network names (e.g., "ISP-Provider-2.4GHz" for 2.4GHz networks)
- 5.0GHz network configurations
- Other device-specific parameters
This is where the magic happens when you want to create new interfaces or set up custom configurations for your devices.
### Steps to Create a Profile
1. Navigate to **Inventory** in the CONTROL portal
2. Click on **Profile**
3. Click the **Add** button
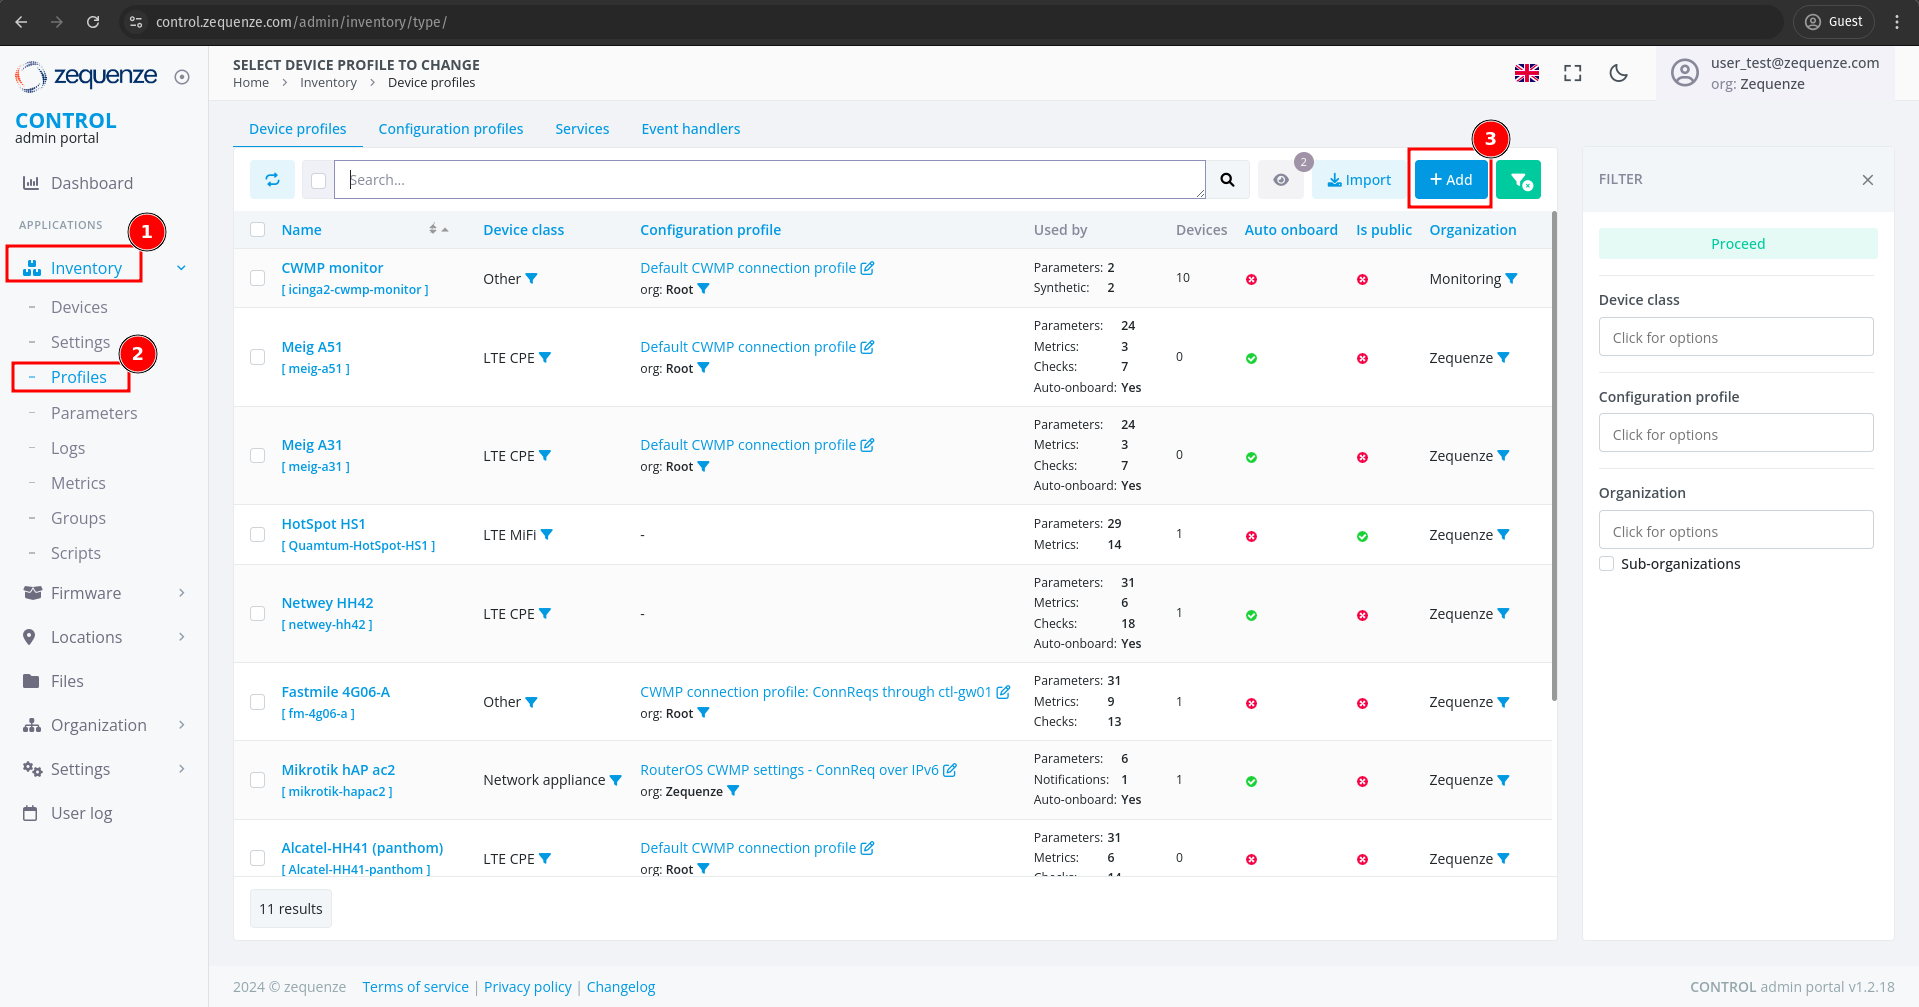 ---
### Configuring Profile Settings
You will see the profile creation page with the following fields:
---
### Configuring Profile Settings
You will see the profile creation page with the following fields:
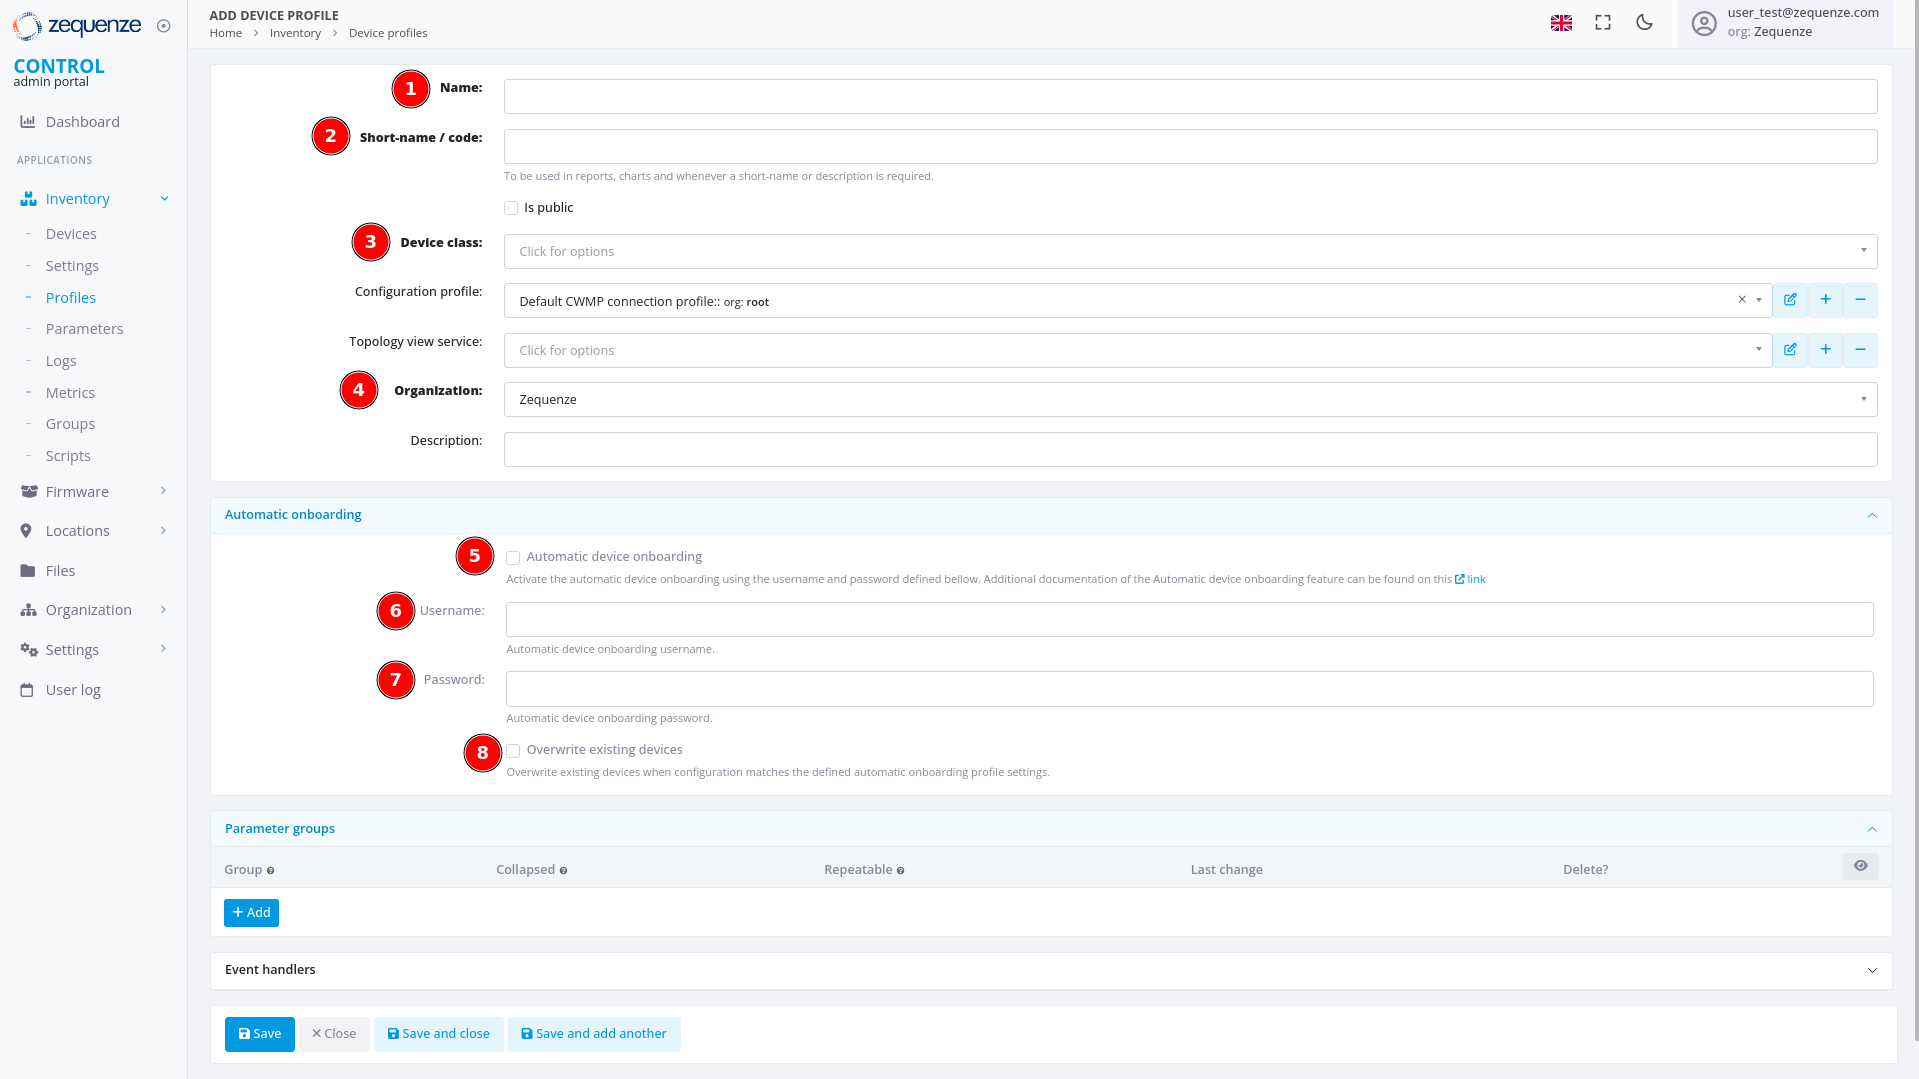 #### Required Fields
1. **Name**
Enter a descriptive identifier for this profile. Best practice is to use the format: **"Vendor Model [Base]"**
Example: *"Nokia G-1425G-B [Base]"*
2. **Short-name / code**
Provide an abbreviated version of the profile name.
Example: *"Nokia-G-1425G"*
3. **Device class**
Select the appropriate device type from the following options:
- eMTA
- ONT
- DSL CPE
- Fixed Wireless Access CPE
- LTE CPE
- LTE MiFI
- STB
- WiFi eXtender
- WiFi Mesh AP
- WiFi Mesh (master)
- WiFi Mesh (slave)
- WiFi AP
- VoIP phone
- VoIP ATA
- LAN Switch
- Router
- Network appliance
- SONDA probe
- Transport gateway
- Other
4. **Organization**
If applicable, select which organization this profile belongs to.
#### Automatic Device Onboarding Settings
5. **Automatic device onboarding**
Enable this option to allow the CONTROL platform to automatically assign new credentials to devices. This ensures each device receives unique username and password combinations for enhanced security.
6. **User**
Enter the default username that matches the factory credentials on the device. This username must match what is configured on devices connecting to the CONTROL platform.
7. **Password**
Enter the default password that matches the factory credentials on the device. Both username and password must match for automatic profile assignment to work correctly.
8. **Overwrite existing devices**
Enable this option to allow devices that have been reset to factory credentials to reconnect to the CONTROL platform. This prevents connection rejection when a device already exists in the system and ensures that devices returning to factory settings can still connect without issues.
---
### Example Configuration
Below is an example of a completed profile configuration:
#### Required Fields
1. **Name**
Enter a descriptive identifier for this profile. Best practice is to use the format: **"Vendor Model [Base]"**
Example: *"Nokia G-1425G-B [Base]"*
2. **Short-name / code**
Provide an abbreviated version of the profile name.
Example: *"Nokia-G-1425G"*
3. **Device class**
Select the appropriate device type from the following options:
- eMTA
- ONT
- DSL CPE
- Fixed Wireless Access CPE
- LTE CPE
- LTE MiFI
- STB
- WiFi eXtender
- WiFi Mesh AP
- WiFi Mesh (master)
- WiFi Mesh (slave)
- WiFi AP
- VoIP phone
- VoIP ATA
- LAN Switch
- Router
- Network appliance
- SONDA probe
- Transport gateway
- Other
4. **Organization**
If applicable, select which organization this profile belongs to.
#### Automatic Device Onboarding Settings
5. **Automatic device onboarding**
Enable this option to allow the CONTROL platform to automatically assign new credentials to devices. This ensures each device receives unique username and password combinations for enhanced security.
6. **User**
Enter the default username that matches the factory credentials on the device. This username must match what is configured on devices connecting to the CONTROL platform.
7. **Password**
Enter the default password that matches the factory credentials on the device. Both username and password must match for automatic profile assignment to work correctly.
8. **Overwrite existing devices**
Enable this option to allow devices that have been reset to factory credentials to reconnect to the CONTROL platform. This prevents connection rejection when a device already exists in the system and ensures that devices returning to factory settings can still connect without issues.
---
### Example Configuration
Below is an example of a completed profile configuration:
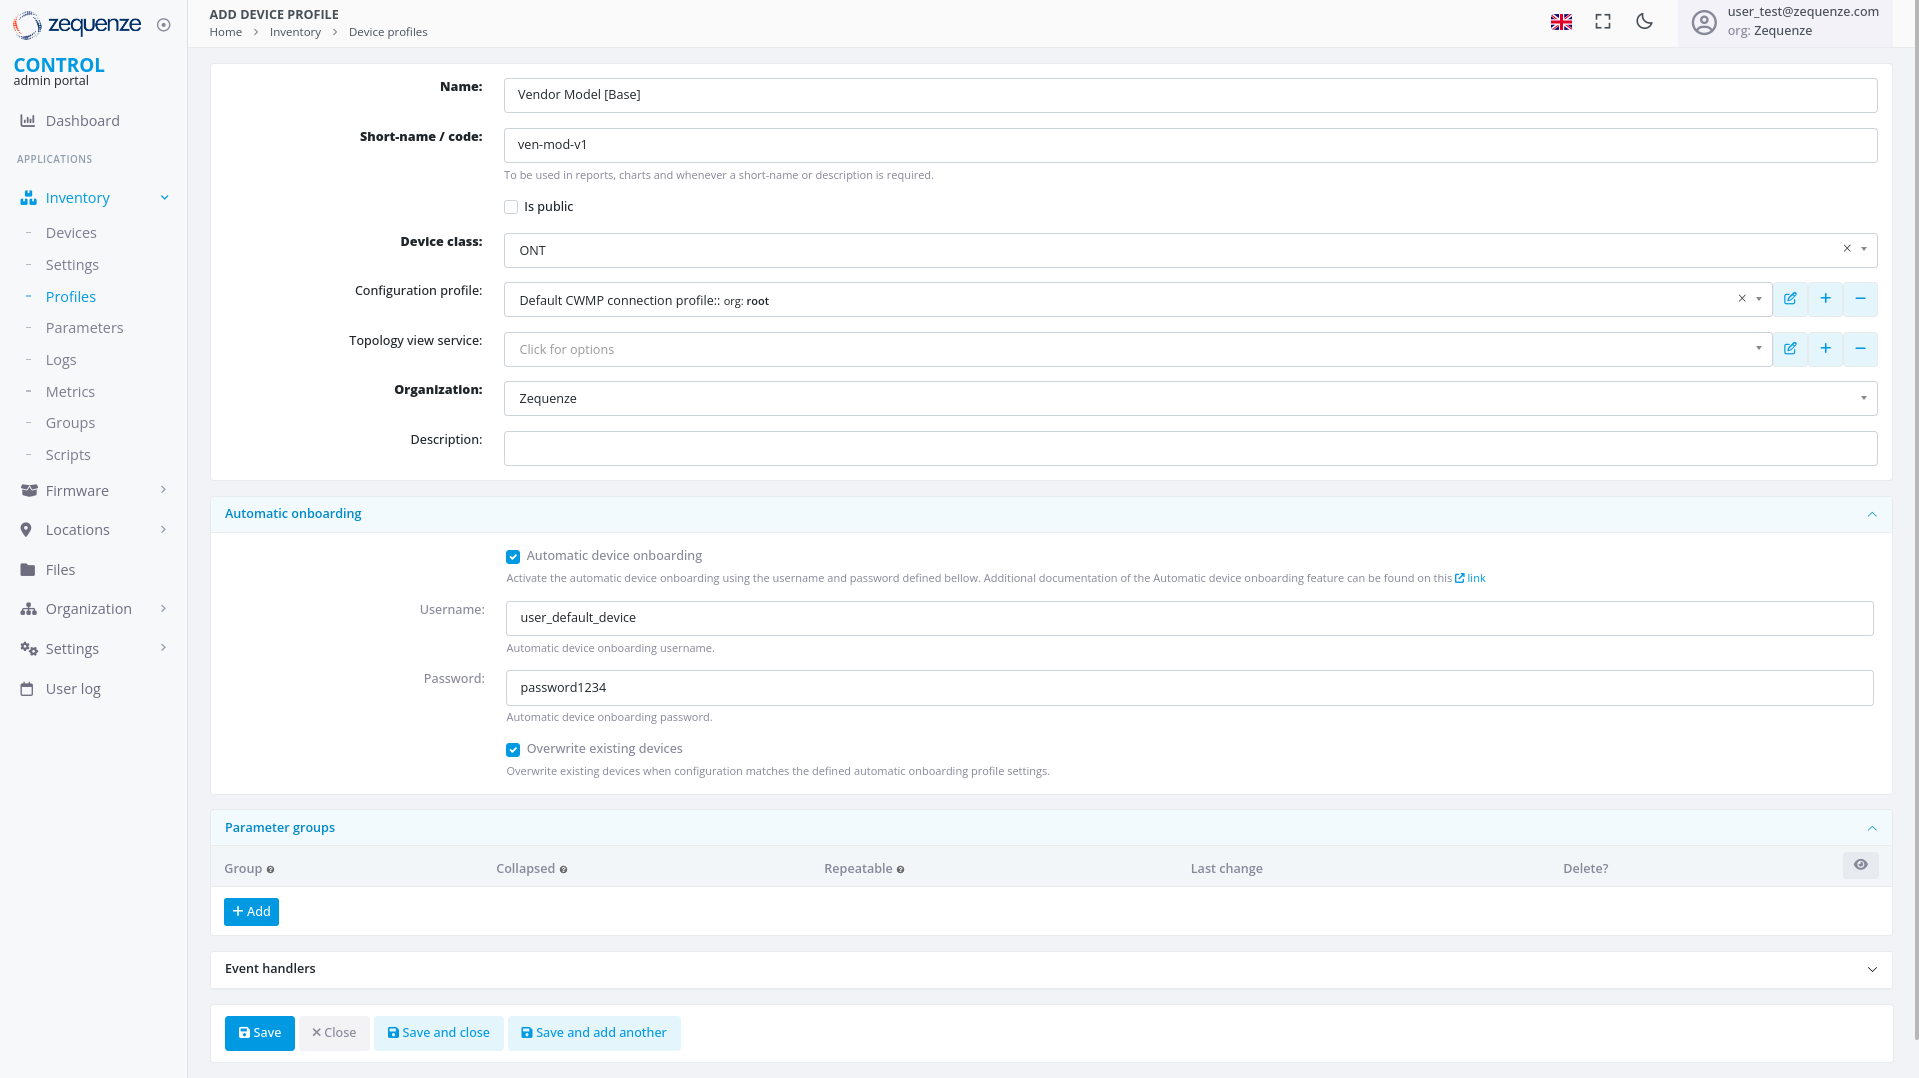 Once all fields are configured, click **"Save and close"** to create the profile.
---
## Profile Created
After successfully creating the profile, you can:
1. **Filter by Name** - Use the search filter to locate your profile by its name
2. **View the Profile** - The newly created profile will appear in the profile list
Once all fields are configured, click **"Save and close"** to create the profile.
---
## Profile Created
After successfully creating the profile, you can:
1. **Filter by Name** - Use the search filter to locate your profile by its name
2. **View the Profile** - The newly created profile will appear in the profile list
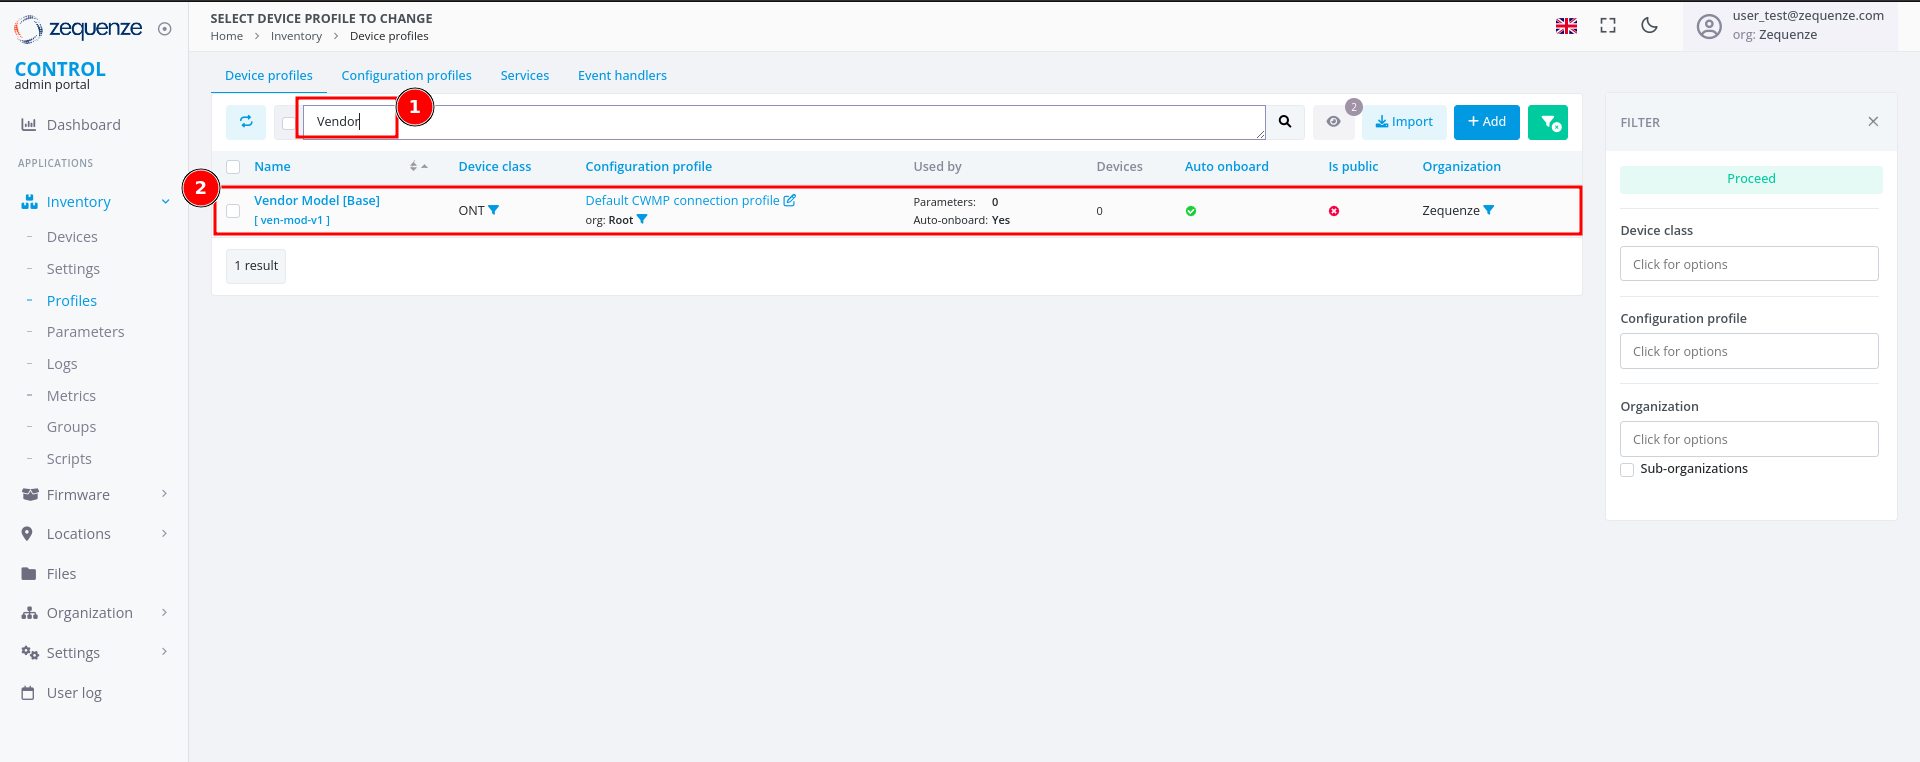 ---
## Next Steps
The next step is to configure a device with the credentials and URL settings.
# Add Device to CONTROL
## Overview
This guide walks you through configuring a device to connect to the CONTROL platform. In this example, we'll configure an ONT from an oriental vendor with TR069 credentials created in a previous step.
## Prerequisites
Before beginning, ensure you have:
- Valid TR069 credentials created in CONTROL (see the [Profile chapter](https://docs.zequenze.com/books/control/page/profile))
- Network access from the device to the CONTROL platform URL
- Administrative access to your device
## Step 1: Access Device Configuration
Log in to your device's web interface.
---
## Next Steps
The next step is to configure a device with the credentials and URL settings.
# Add Device to CONTROL
## Overview
This guide walks you through configuring a device to connect to the CONTROL platform. In this example, we'll configure an ONT from an oriental vendor with TR069 credentials created in a previous step.
## Prerequisites
Before beginning, ensure you have:
- Valid TR069 credentials created in CONTROL (see the [Profile chapter](https://docs.zequenze.com/books/control/page/profile))
- Network access from the device to the CONTROL platform URL
- Administrative access to your device
## Step 1: Access Device Configuration
Log in to your device's web interface.
 ## Step 2: Review Existing WAN Interfaces
After logging in, verify the existing WAN interfaces. This device has a pre-configured interface, but we'll examine the configuration and create a new one for demonstration purposes.
## Step 2: Review Existing WAN Interfaces
After logging in, verify the existing WAN interfaces. This device has a pre-configured interface, but we'll examine the configuration and create a new one for demonstration purposes.
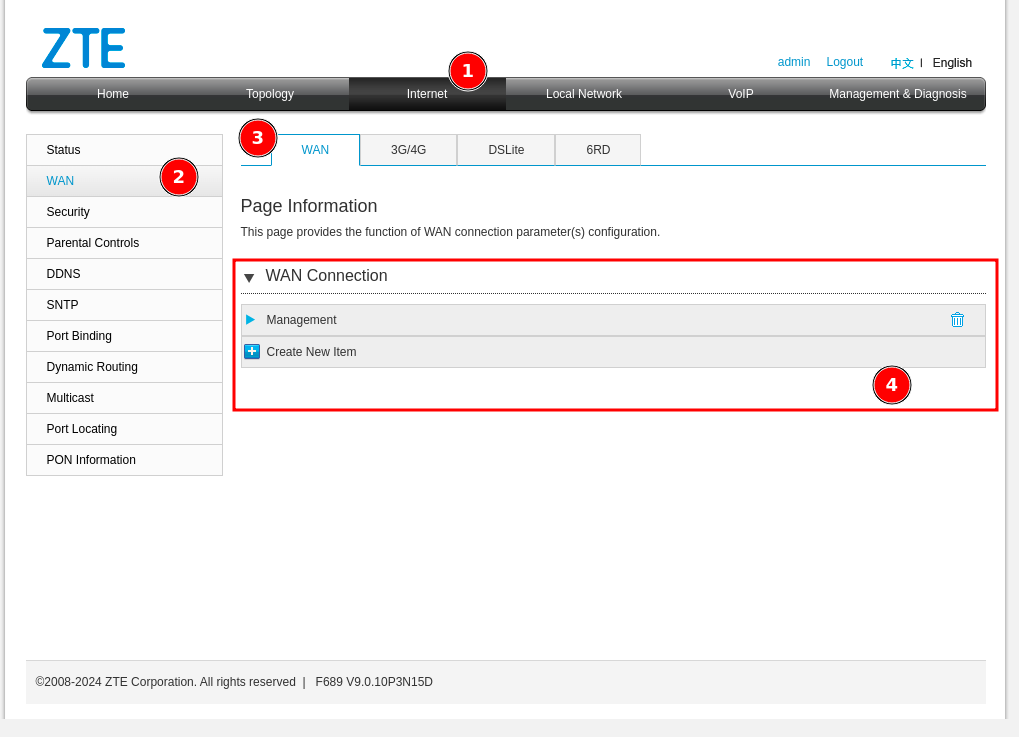 To navigate to the WAN interface configuration:
1. Click **"Internet"**
2. Click **"WAN"**
3. Click **"WAN"** again
4. In the displayed list, you'll see existing WAN interfaces (in this example, an interface named **"Management"**)
## Step 3: Create a New WAN Interface
Create a new WAN interface for TR069 connectivity:
To navigate to the WAN interface configuration:
1. Click **"Internet"**
2. Click **"WAN"**
3. Click **"WAN"** again
4. In the displayed list, you'll see existing WAN interfaces (in this example, an interface named **"Management"**)
## Step 3: Create a New WAN Interface
Create a new WAN interface for TR069 connectivity:
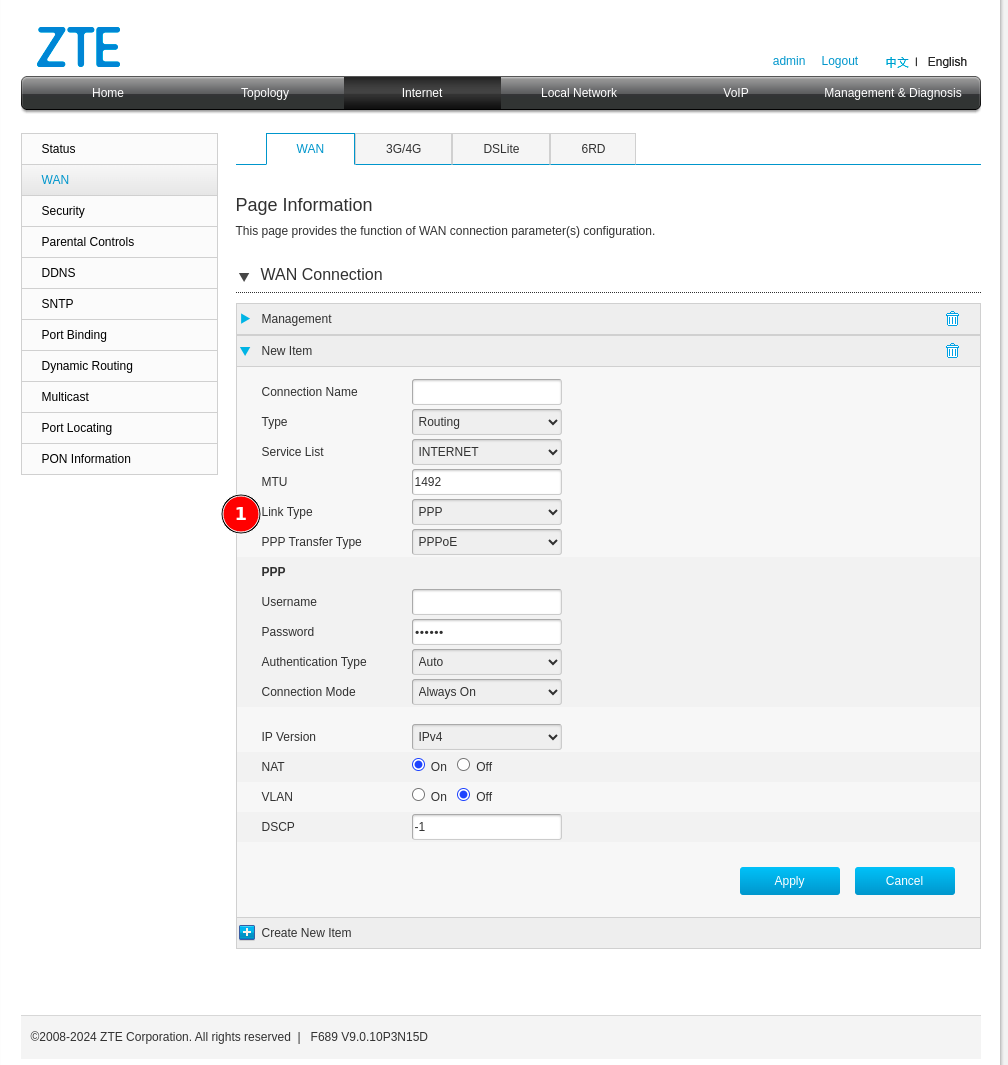 1. Change the connection type from **"PPP"** to **"IP"**:
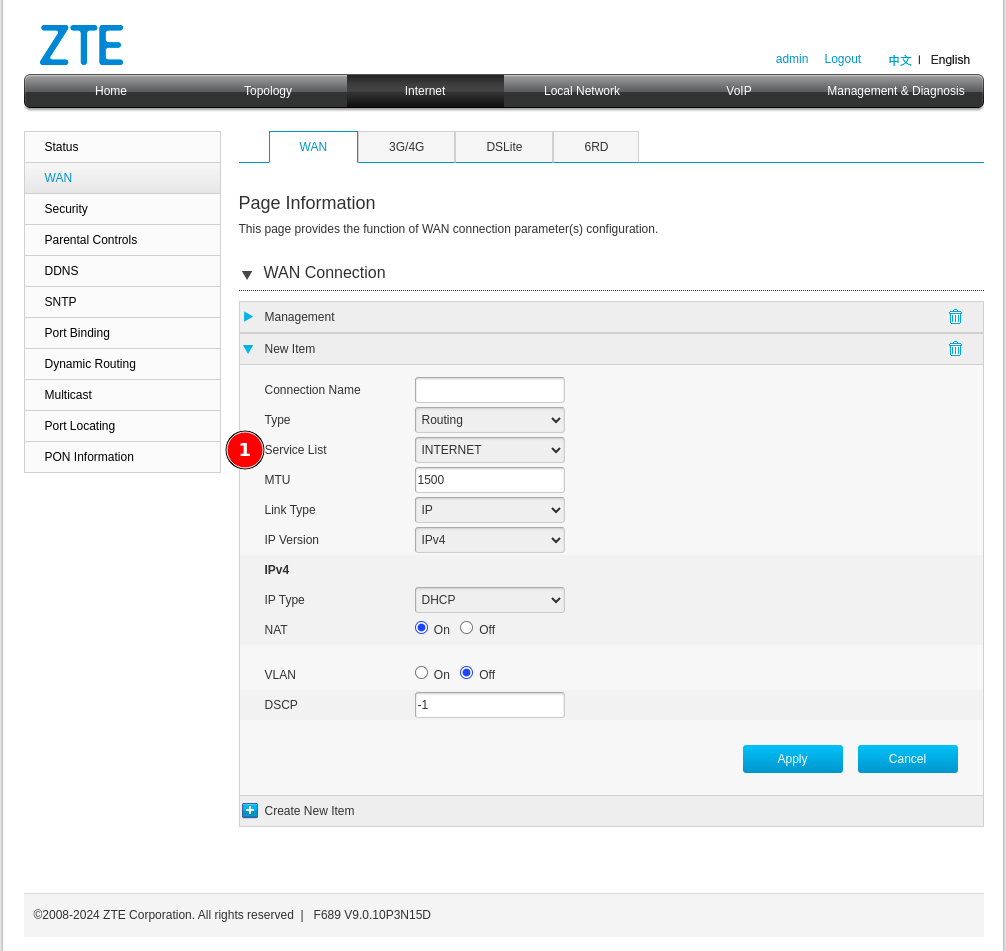 ## Step 4: Configure Service List Options
Next, configure the **"Service List"** type. Change it from *Internet* to one that includes *TR069*.
## Step 4: Configure Service List Options
Next, configure the **"Service List"** type. Change it from *Internet* to one that includes *TR069*.
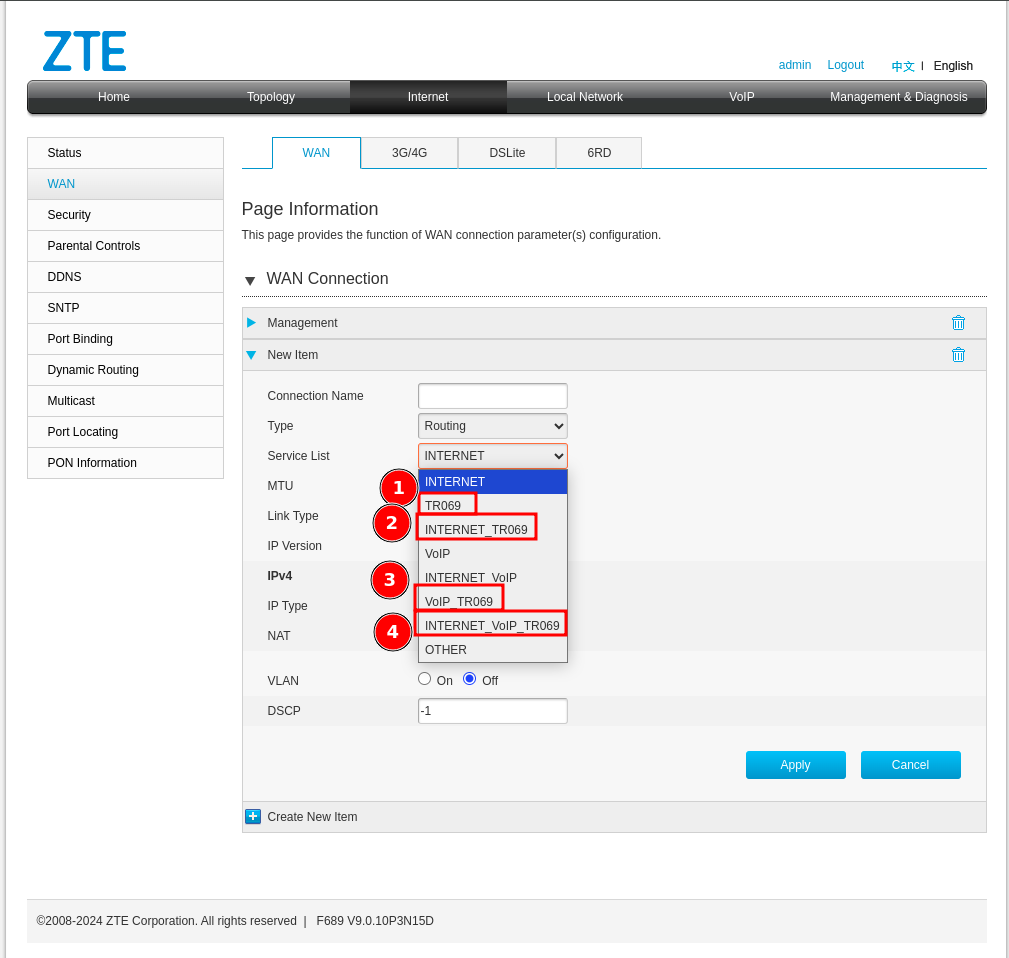 ### Understanding Service List Combinations
You may encounter several service list options in this device and possibly others. Here's what each means:
1. **TR069** — This option is alone, it is because there would be a separate WAN interface solely to manage the device through the CONTROL platform, which would be ideal but is often not possible due to network design issues that already exist.
2. **INTERNET_TR069** — With this option we will be sharing the Internet service for the user or client along with the administration of the device. **Not recommended** since when the service is suspended, access to the CONTROL platform is sometimes lost and communication would be limited until the service is reactivated.
3. **VOIP_TR069** — Sharing the TR069 service with VoIP may possibly be a good option since it would not affect the existing Internet services you already have.
4. **INTERNET_VoIP_TR069** — This last option would be to manage all the services in a single VLAN or WAN interface, which is rare for clients with this configuration, but it works.
## Step 5: Configure WAN Interface Parameters
Configure your WAN interface with the following settings:
### Understanding Service List Combinations
You may encounter several service list options in this device and possibly others. Here's what each means:
1. **TR069** — This option is alone, it is because there would be a separate WAN interface solely to manage the device through the CONTROL platform, which would be ideal but is often not possible due to network design issues that already exist.
2. **INTERNET_TR069** — With this option we will be sharing the Internet service for the user or client along with the administration of the device. **Not recommended** since when the service is suspended, access to the CONTROL platform is sometimes lost and communication would be limited until the service is reactivated.
3. **VOIP_TR069** — Sharing the TR069 service with VoIP may possibly be a good option since it would not affect the existing Internet services you already have.
4. **INTERNET_VoIP_TR069** — This last option would be to manage all the services in a single VLAN or WAN interface, which is rare for clients with this configuration, but it works.
## Step 5: Configure WAN Interface Parameters
Configure your WAN interface with the following settings:
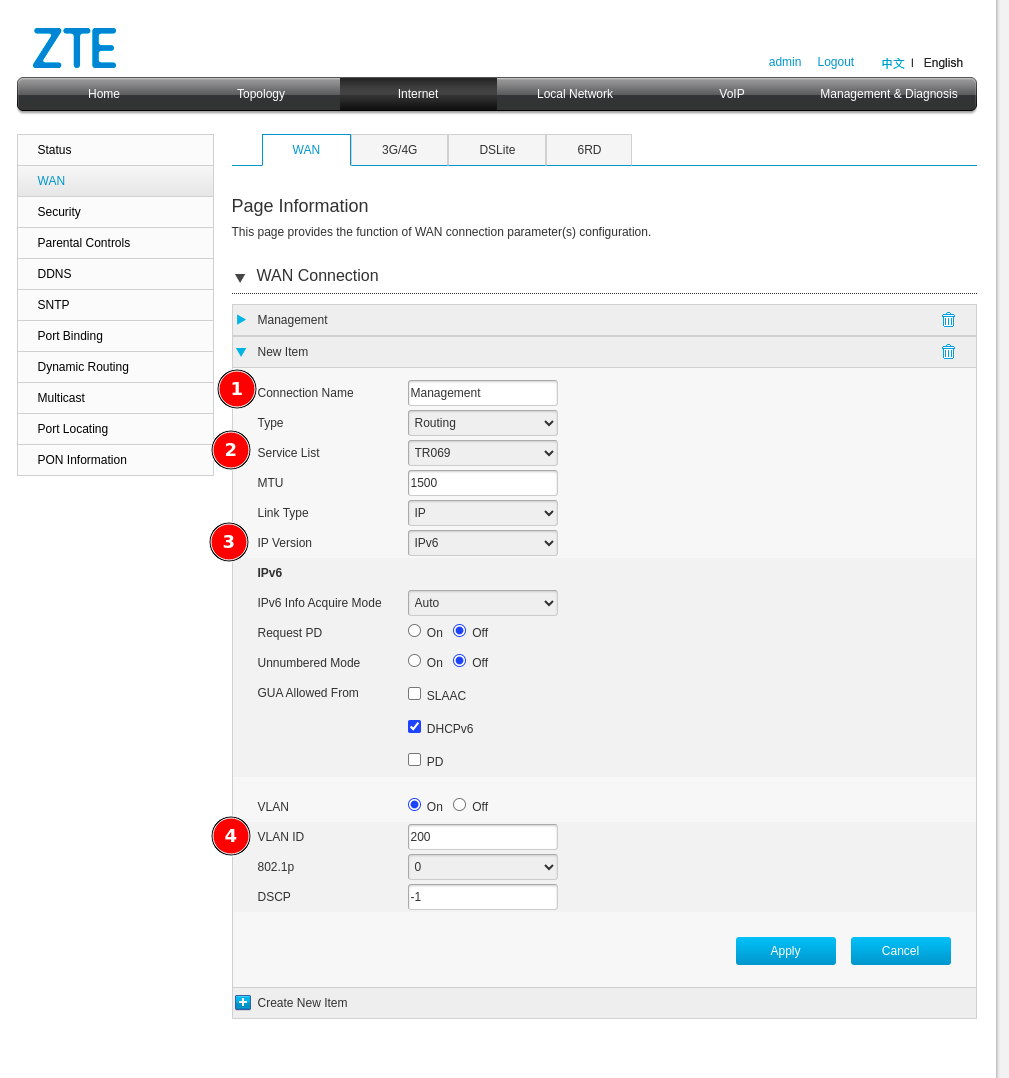 1. **Connection name** — Enter a descriptive name to identify this connection
2. **Service List** — Select **TR069**
3. **IP Version** — Select the appropriate IP version (IPv4 or IPv6)
4. **VLAN ID** — Enter the VLAN ID for this service
**Important:** Please make the necessary changes in your network configuration to ensure the device can reach the CONTROL platform URL through this WAN interface with the TR069 service enabled.
After clicking **Apply**, verify your configuration:
1. **Connection name** — Enter a descriptive name to identify this connection
2. **Service List** — Select **TR069**
3. **IP Version** — Select the appropriate IP version (IPv4 or IPv6)
4. **VLAN ID** — Enter the VLAN ID for this service
**Important:** Please make the necessary changes in your network configuration to ensure the device can reach the CONTROL platform URL through this WAN interface with the TR069 service enabled.
After clicking **Apply**, verify your configuration:
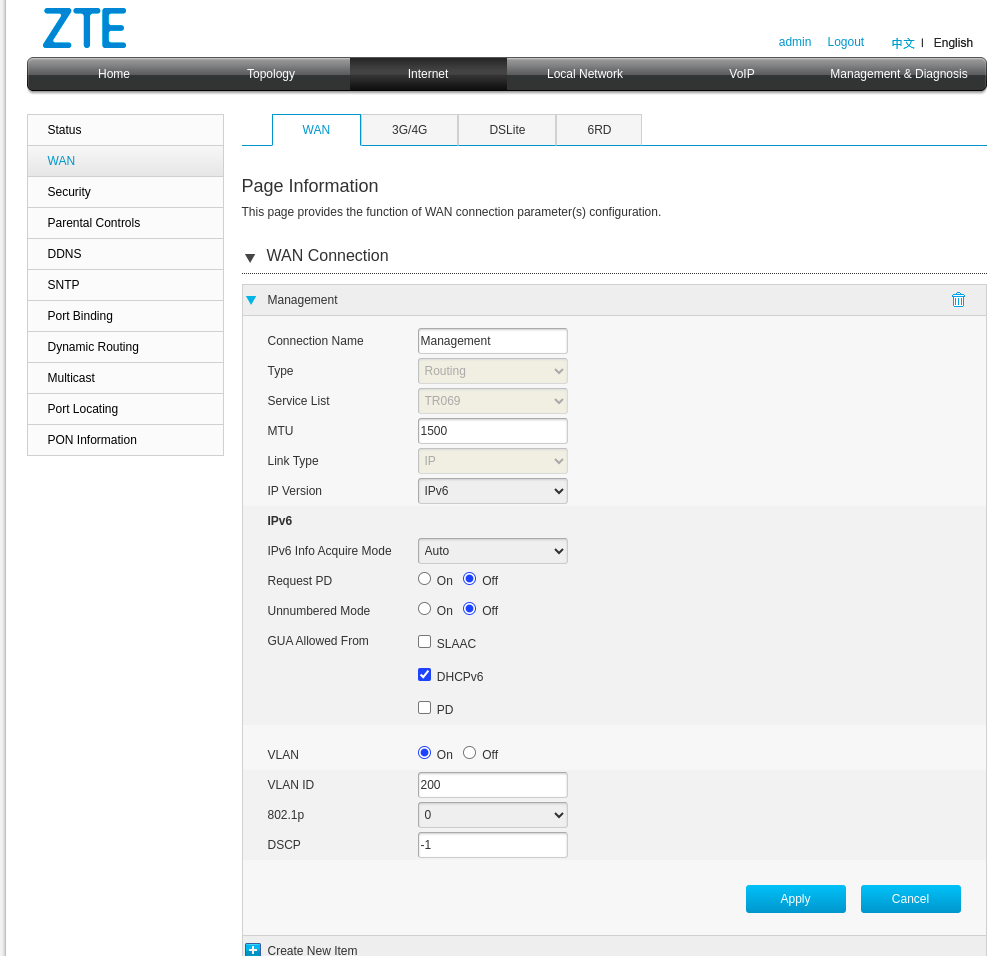 ## Step 6: Verify Network Connectivity
Confirm that the WAN interface has a valid IP address and can reach the CONTROL platform:
## Step 6: Verify Network Connectivity
Confirm that the WAN interface has a valid IP address and can reach the CONTROL platform:
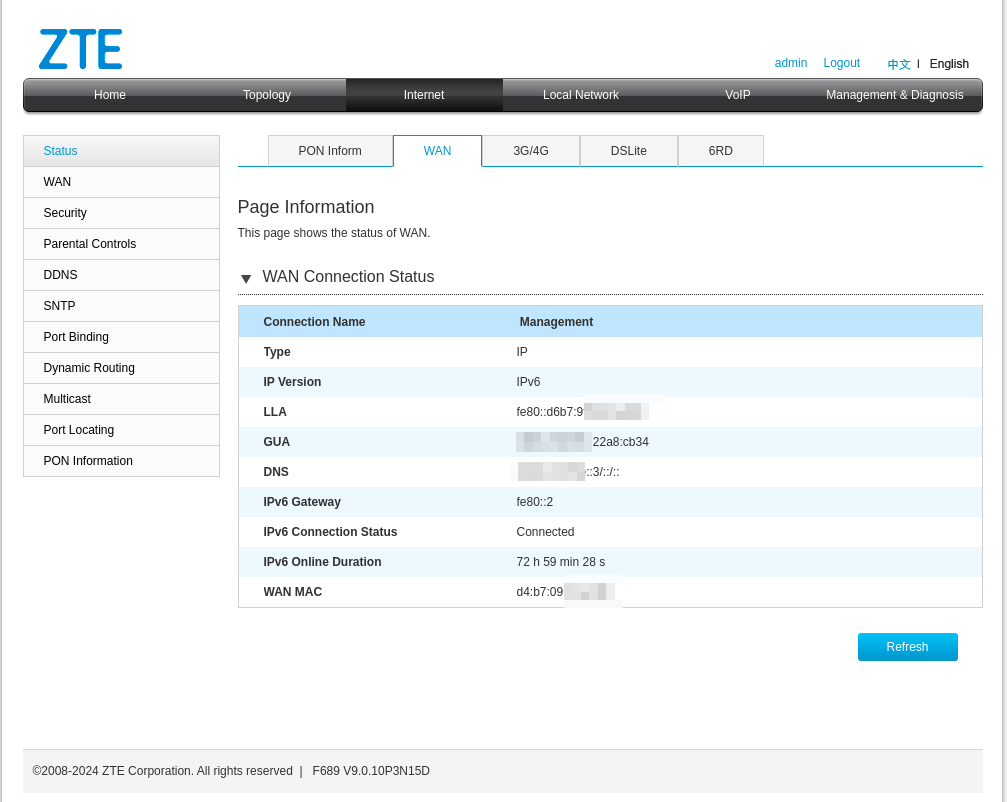 ### Optional: Test CONTROL Platform Connectivity
This step is optional, but you can confirm with a ping that the CONTROL URL can be reached using the device's built-in ping utility:
### Optional: Test CONTROL Platform Connectivity
This step is optional, but you can confirm with a ping that the CONTROL URL can be reached using the device's built-in ping utility:
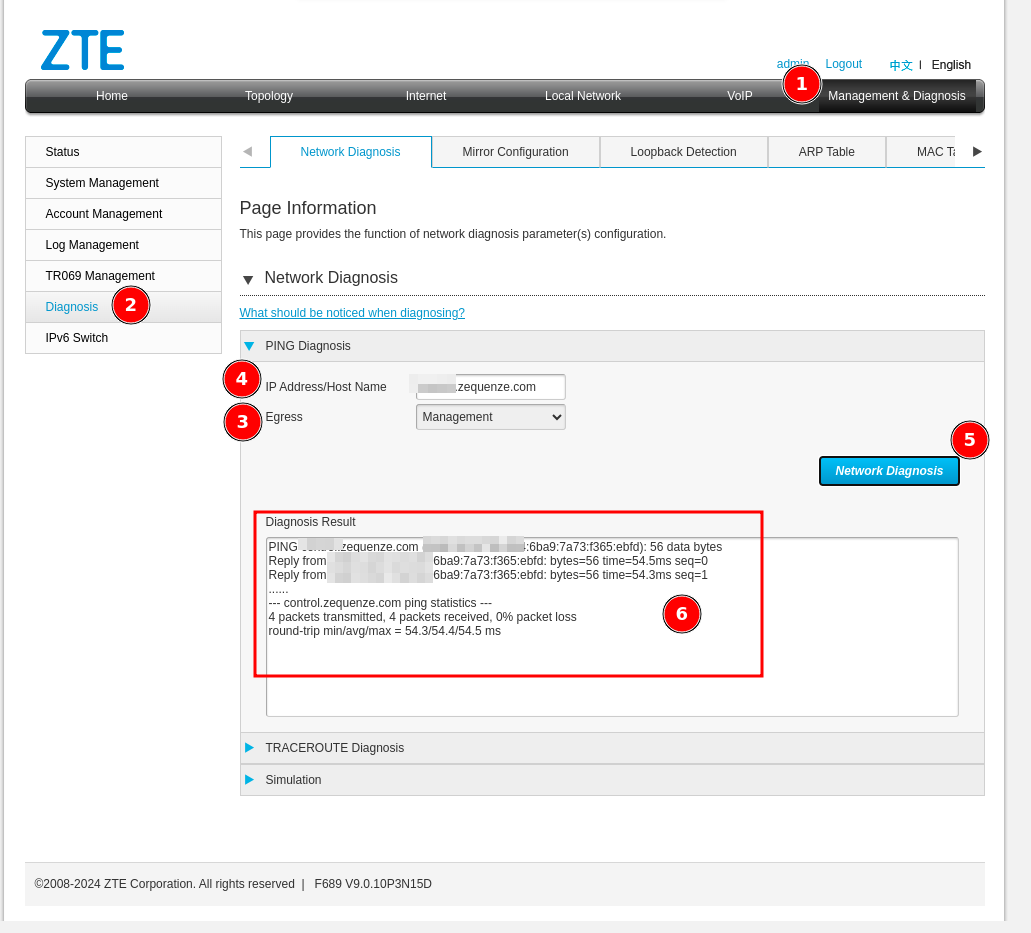 1. Navigate to **"Management & Diagnosis"**
2. Click **"Diagnosis"**
3. Under **"Egress"**, select your TR069 interface (e.g., **"Management"**)
4. Enter the CONTROL platform domain
5. Start the ping test
6. Confirm that all packets successfully reach CONTROL
## Step 7: Configure TR069 Settings
Navigate to the TR069 Management section:
1. Navigate to **"Management & Diagnosis"**
2. Click **"Diagnosis"**
3. Under **"Egress"**, select your TR069 interface (e.g., **"Management"**)
4. Enter the CONTROL platform domain
5. Start the ping test
6. Confirm that all packets successfully reach CONTROL
## Step 7: Configure TR069 Settings
Navigate to the TR069 Management section:
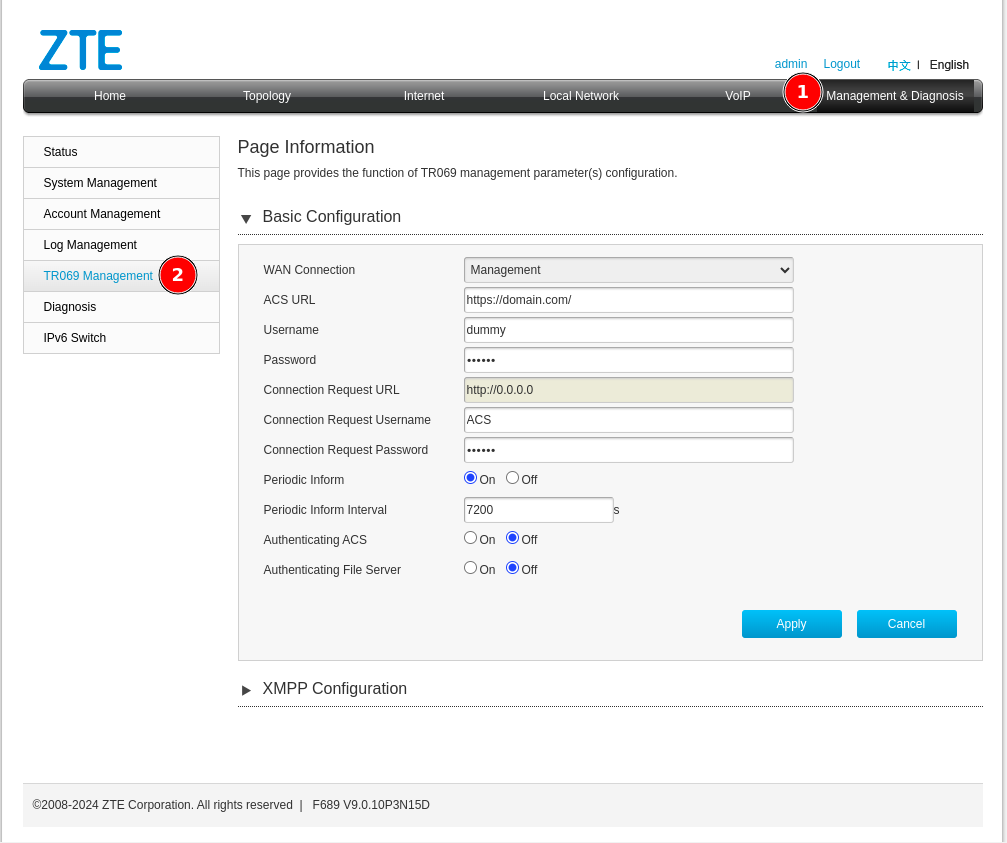 1. Click **"Management & Diagnosis"**
2. Click **"TR069 Management"**
## Step 8: Connect Device to CONTROL
Configure the TR069 parameters to establish connection with CONTROL:
1. Click **"Management & Diagnosis"**
2. Click **"TR069 Management"**
## Step 8: Connect Device to CONTROL
Configure the TR069 parameters to establish connection with CONTROL:
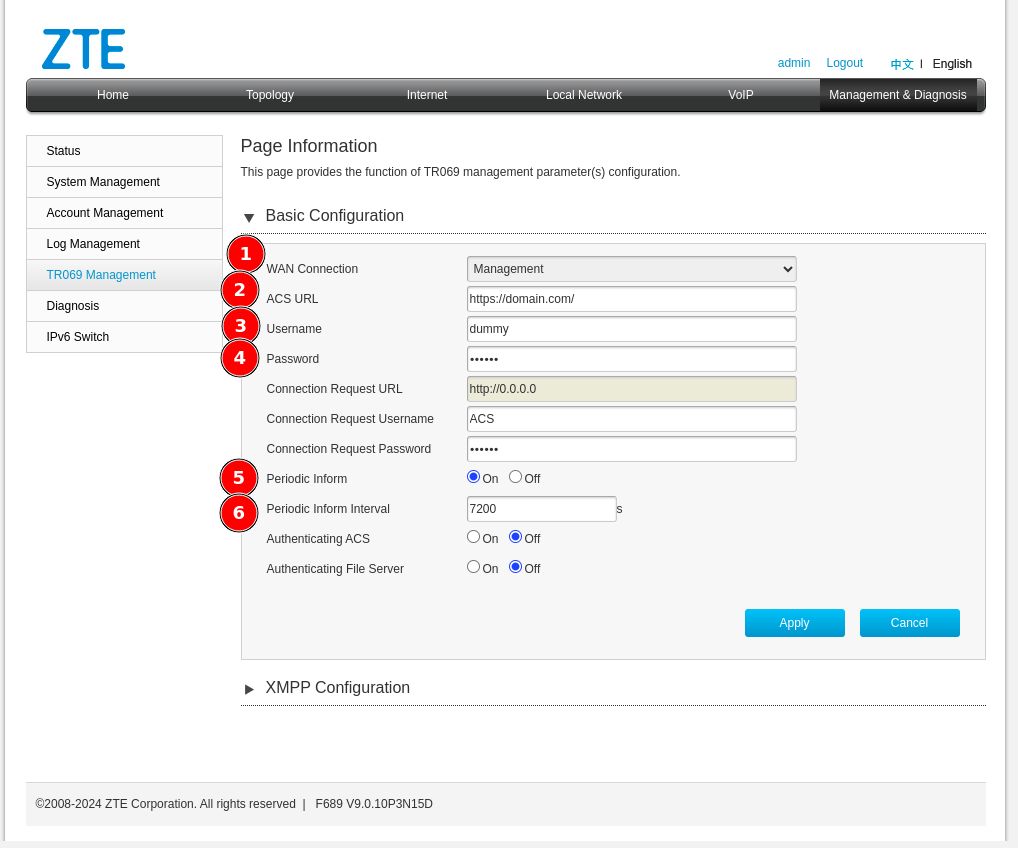 Configure the following parameters:
1. **WAN Connection** — Select the interface created for TR069 (e.g., *Management*)
2. **ACS URL** — Enter: `https://control.zequenze.com/cwmp/`
**Note:** Please confirm the correct URL with Zequenze staff before proceeding.
3. **Username** — Enter the username created in the [Profile chapter](https://docs.zequenze.com/books/control/page/profile)
4. **Password** — Enter the password created in the [Profile chapter](https://docs.zequenze.com/books/control/page/profile)
5. **Periodic Inform** — Enable this option to allow the device to report periodically to CONTROL
6. **Periodic Inform Interval** — For initial setup, set this to **180 seconds**
## Step 9: Apply Configuration
Review your final configuration:
Configure the following parameters:
1. **WAN Connection** — Select the interface created for TR069 (e.g., *Management*)
2. **ACS URL** — Enter: `https://control.zequenze.com/cwmp/`
**Note:** Please confirm the correct URL with Zequenze staff before proceeding.
3. **Username** — Enter the username created in the [Profile chapter](https://docs.zequenze.com/books/control/page/profile)
4. **Password** — Enter the password created in the [Profile chapter](https://docs.zequenze.com/books/control/page/profile)
5. **Periodic Inform** — Enable this option to allow the device to report periodically to CONTROL
6. **Periodic Inform Interval** — For initial setup, set this to **180 seconds**
## Step 9: Apply Configuration
Review your final configuration:
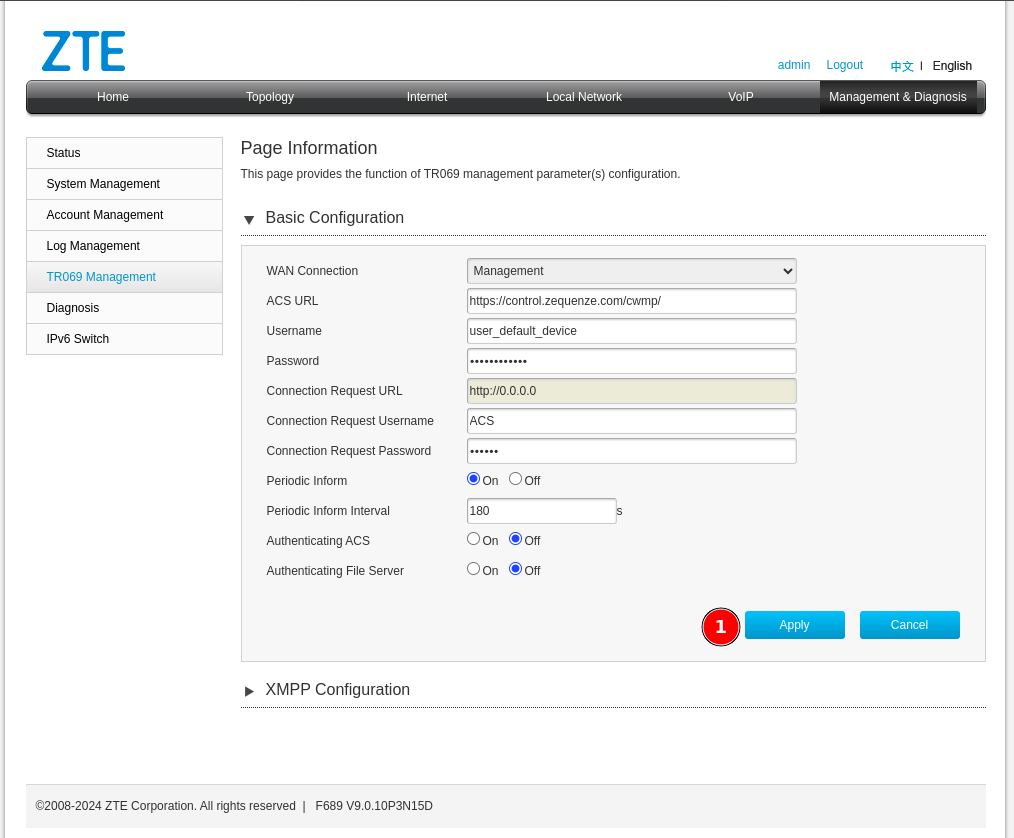 Click the **Apply** button to save your changes.
## Next Steps
Device configuration is now complete. The device should appear in the CONTROL platform within the configured periodic inform interval. You can now proceed to manage and monitor your device through CONTROL.
# Discovering the parameters
## Confirm Device Connection
At this point, you should have a device successfully connected to the CONTROL platform, similar to the example shown below:
Click the **Apply** button to save your changes.
## Next Steps
Device configuration is now complete. The device should appear in the CONTROL platform within the configured periodic inform interval. You can now proceed to manage and monitor your device through CONTROL.
# Discovering the parameters
## Confirm Device Connection
At this point, you should have a device successfully connected to the CONTROL platform, similar to the example shown below:
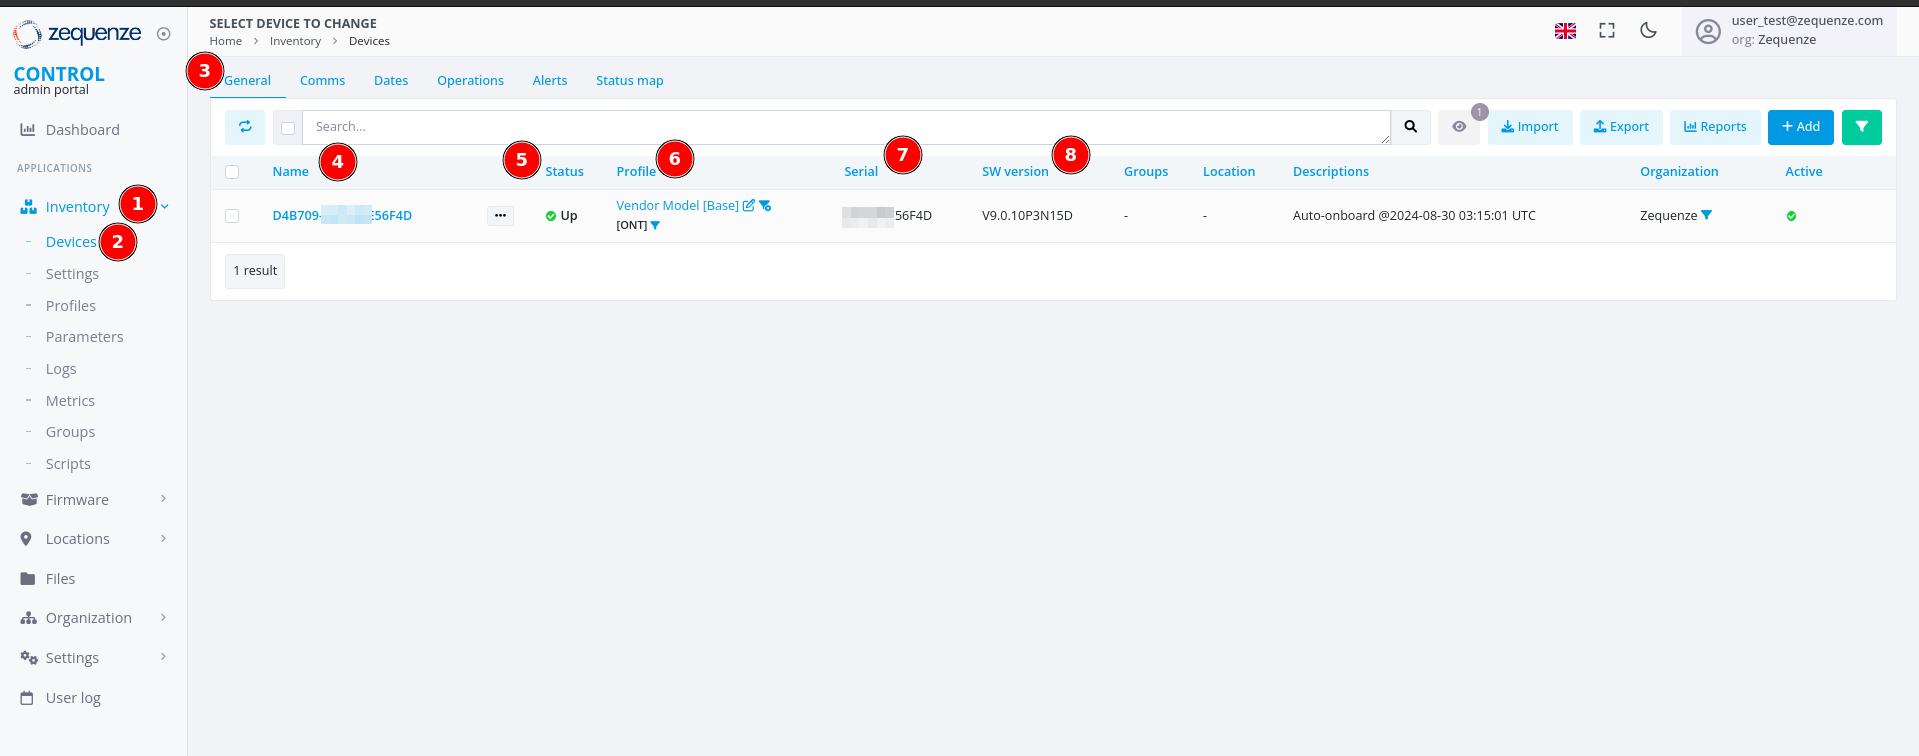 > **Note:** If the device list is empty, perform the following troubleshooting steps locally on the device:
>
> - **Try HTTP instead of HTTPS:** Change the CONTROL URL from `https://control.zequenze.com/cwmp/` to `http://control.zequenze.com/cwmp/`. If this works, the device does not support HTTPS or encrypted communication.
>
> - **Use IP address instead of domain:** Replace the domain `control.zequenze.com` with the CONTROL platform's IP address (e.g., `https://35.171.123.57/cwmp/` or `http://35.171.123.57/cwmp/`). If this works, verify the device's DNS configuration.
>
> - **Verify TR069 service:** Validate that the WAN interface has the TR069 service enabled to achieve connectivity to the CONTROL platform.
### Understanding the Interface
The screenshot above displays the following elements:
1. **Inventory** — Located on the left sidebar, this section contains devices, profiles, and other resources.
2. **Devices** — Displays the list of connected devices, showing their status as online or offline (with reasons for offline status).
3. **General** — The default section view when accessing a device.
4. **Name** — Automatically assigned by CONTROL as a unique identifier using the ONT's OUI-FSAN or serial number.
5. **Status** — Shows whether the device is UP or DOWN. Devices have a configured "Periodic Inform Interval" (e.g., 180 seconds). If the device fails to report within this interval, its status changes to DOWN.
6. **Profile** — Indicates which profile the device is assigned to.
7. **Serial** — Displays the serial number or FSAN reported by the device.
8. **SW Version** — Shows the current software version running on the device.
## Enable Parameter Discovery
To discover all available parameters from a device on the CONTROL platform, follow these steps:
> **Note:** If the device list is empty, perform the following troubleshooting steps locally on the device:
>
> - **Try HTTP instead of HTTPS:** Change the CONTROL URL from `https://control.zequenze.com/cwmp/` to `http://control.zequenze.com/cwmp/`. If this works, the device does not support HTTPS or encrypted communication.
>
> - **Use IP address instead of domain:** Replace the domain `control.zequenze.com` with the CONTROL platform's IP address (e.g., `https://35.171.123.57/cwmp/` or `http://35.171.123.57/cwmp/`). If this works, verify the device's DNS configuration.
>
> - **Verify TR069 service:** Validate that the WAN interface has the TR069 service enabled to achieve connectivity to the CONTROL platform.
### Understanding the Interface
The screenshot above displays the following elements:
1. **Inventory** — Located on the left sidebar, this section contains devices, profiles, and other resources.
2. **Devices** — Displays the list of connected devices, showing their status as online or offline (with reasons for offline status).
3. **General** — The default section view when accessing a device.
4. **Name** — Automatically assigned by CONTROL as a unique identifier using the ONT's OUI-FSAN or serial number.
5. **Status** — Shows whether the device is UP or DOWN. Devices have a configured "Periodic Inform Interval" (e.g., 180 seconds). If the device fails to report within this interval, its status changes to DOWN.
6. **Profile** — Indicates which profile the device is assigned to.
7. **Serial** — Displays the serial number or FSAN reported by the device.
8. **SW Version** — Shows the current software version running on the device.
## Enable Parameter Discovery
To discover all available parameters from a device on the CONTROL platform, follow these steps:
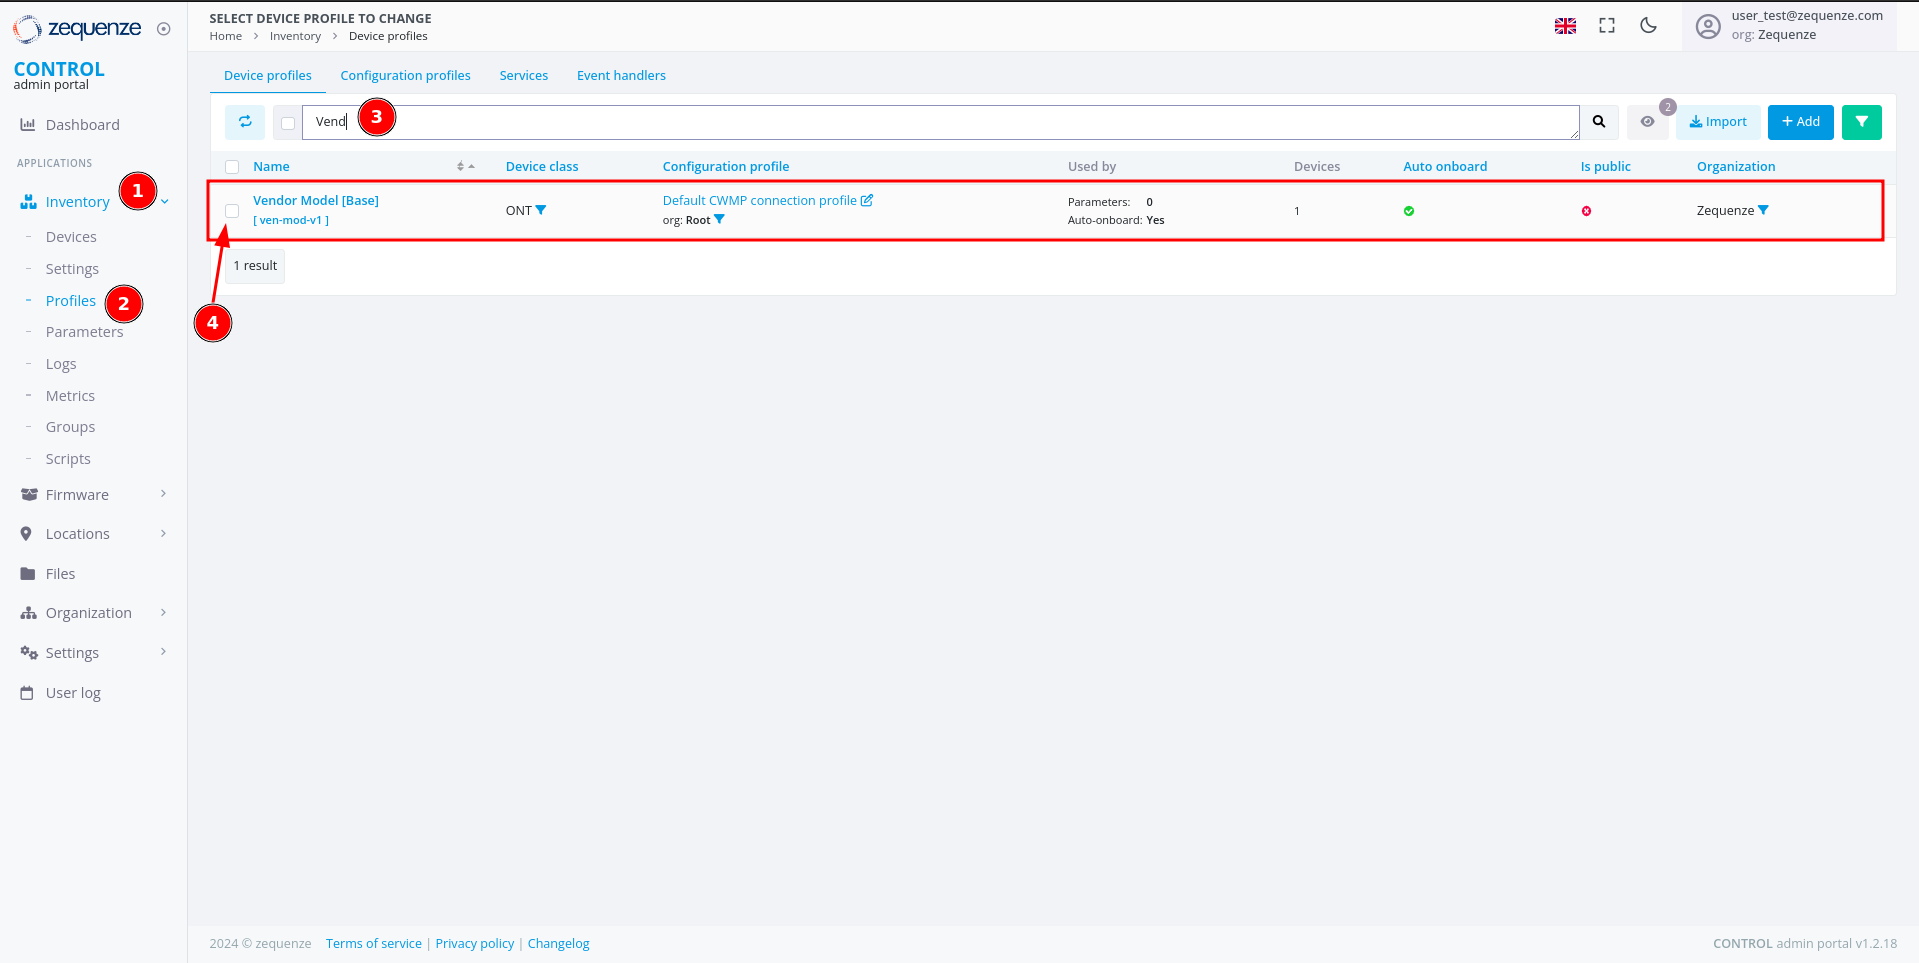 ### Step 1: Navigate to Profiles
1. Click **Inventory** in the left sidebar.
2. Select **Profiles** from the menu.
3. (Optional) Use the filter to search for a specific profile name and press Enter.
4. Check the checkbox next to the desired profile to reveal additional options.
### Step 1: Navigate to Profiles
1. Click **Inventory** in the left sidebar.
2. Select **Profiles** from the menu.
3. (Optional) Use the filter to search for a specific profile name and press Enter.
4. Check the checkbox next to the desired profile to reveal additional options.
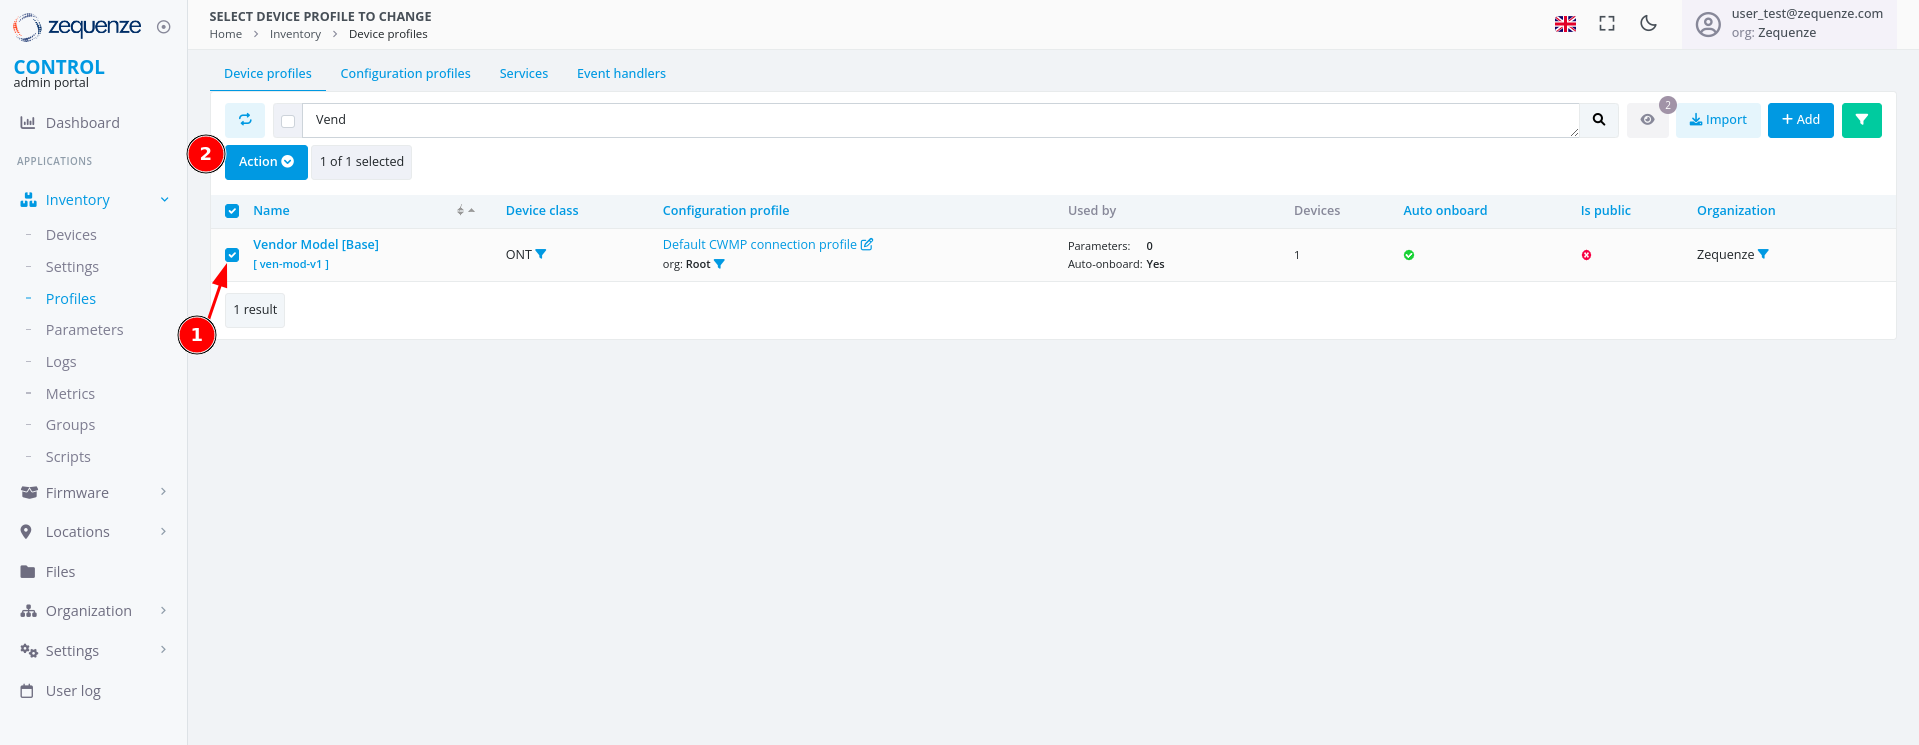 Once you check the checkbox:
1. The checkbox is marked and selected.
2. A new **"Action"** button appears.
### Step 2: Toggle Discovery
Once you check the checkbox:
1. The checkbox is marked and selected.
2. A new **"Action"** button appears.
### Step 2: Toggle Discovery
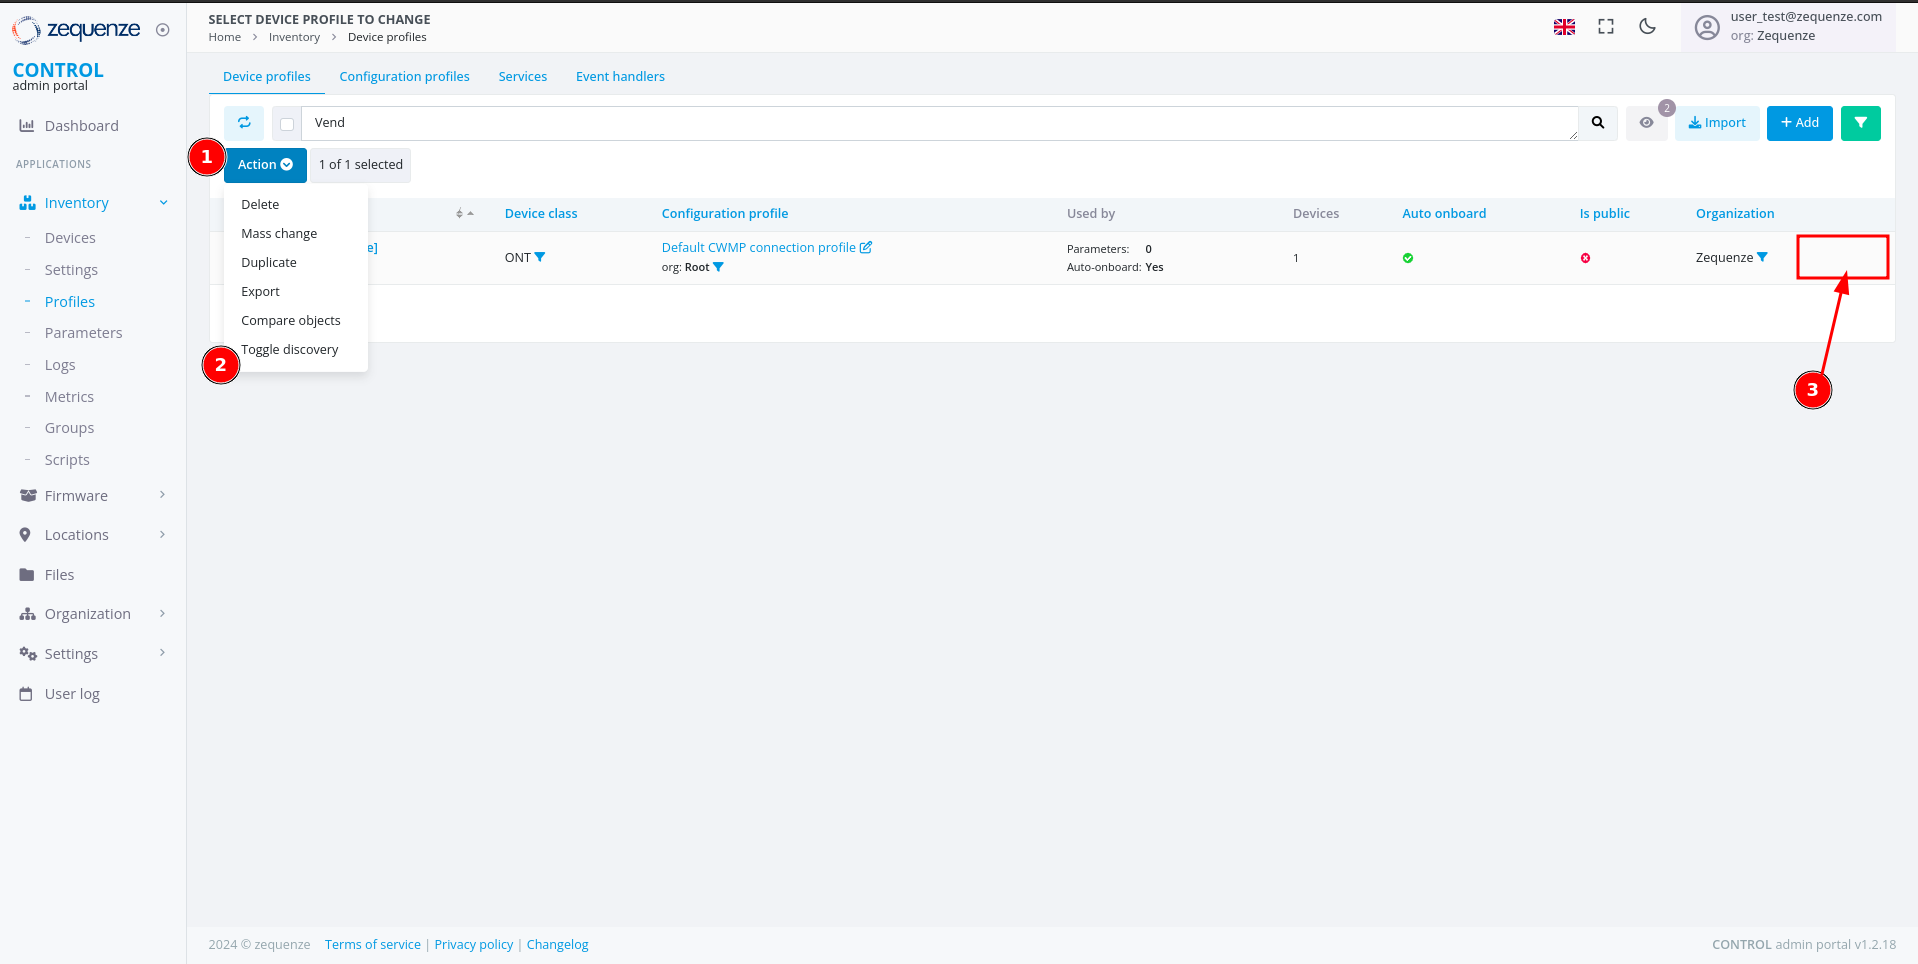 1. Click the **"Action"** button.
2. Select **"Toggle Discovery"** from the dropdown menu.
3. A green gear icon will appear, confirming that the discovery process has started.
The CONTROL platform will now wait for the device to connect and retrieve all available parameters.
### Step 3: Monitor Discovery Progress
1. Click the **"Action"** button.
2. Select **"Toggle Discovery"** from the dropdown menu.
3. A green gear icon will appear, confirming that the discovery process has started.
The CONTROL platform will now wait for the device to connect and retrieve all available parameters.
### Step 3: Monitor Discovery Progress
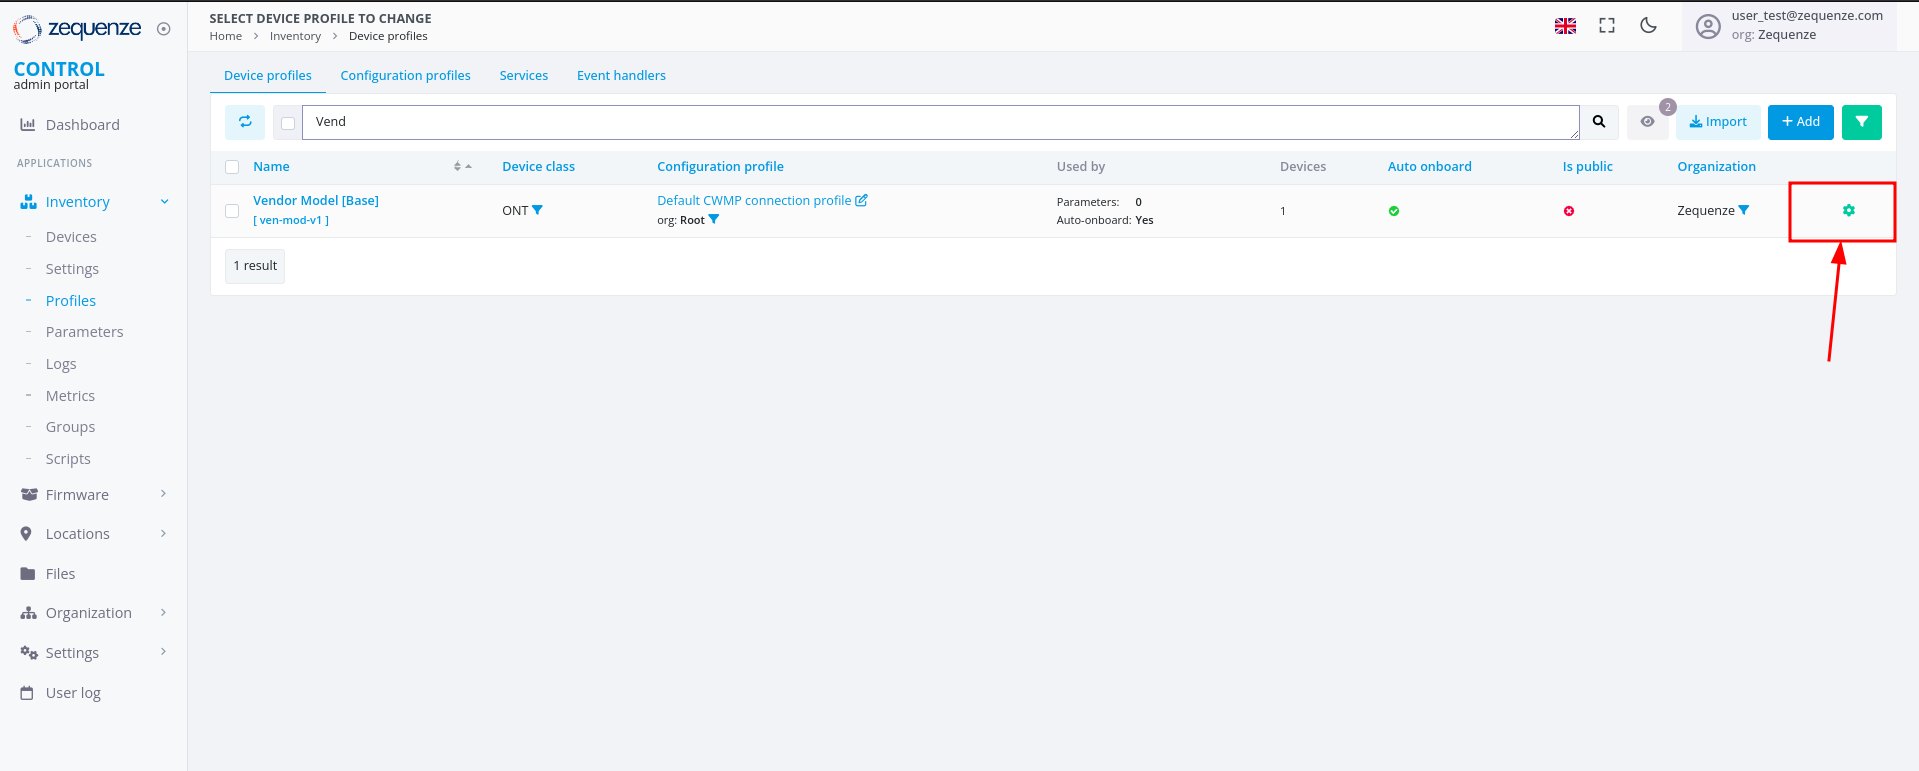 The green gear icon indicates that the platform is waiting to obtain all parameters from the device. Refresh the webpage to check when the gear icon disappears, signaling that discovery is complete.
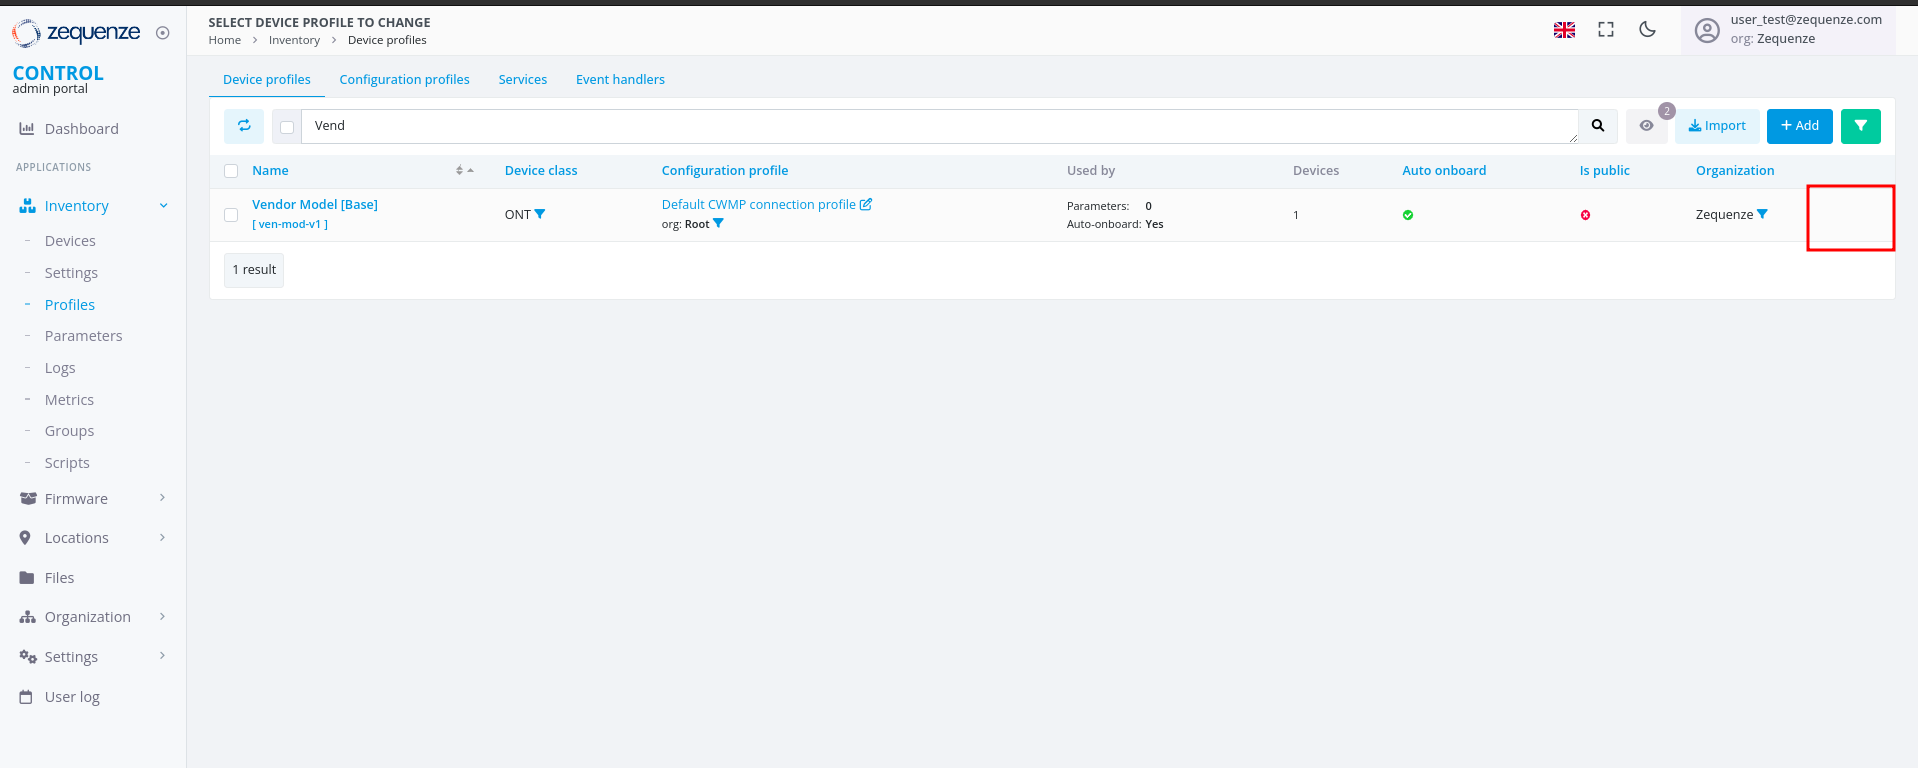 ## View Discovered Parameters
Once discovery is complete, you can view all discovered parameters.
### Access the Profile
Click on the profile name to open its details:
## View Discovered Parameters
Once discovery is complete, you can view all discovered parameters.
### Access the Profile
Click on the profile name to open its details:
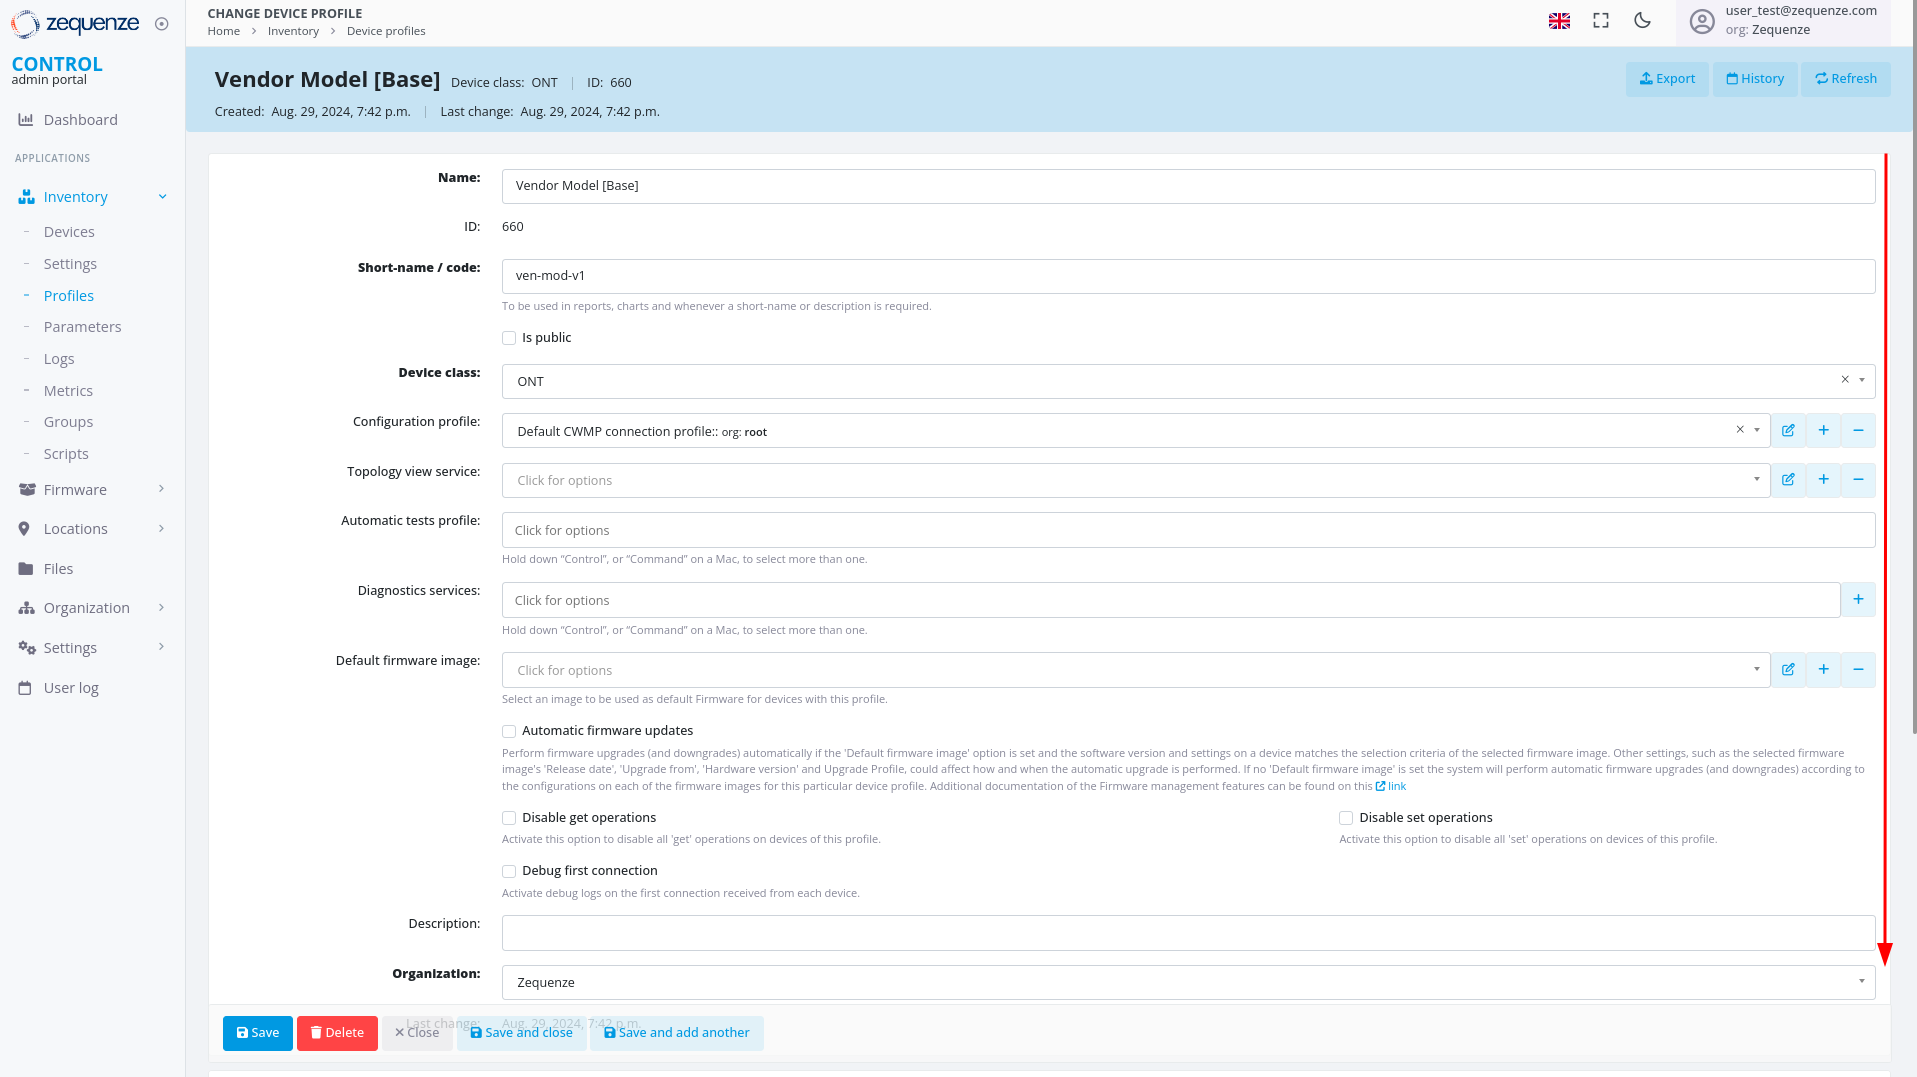 ### Locate System Groups
Inside the profile, scroll down to the bottom of the page to find the **System groups** section:
### Locate System Groups
Inside the profile, scroll down to the bottom of the page to find the **System groups** section:
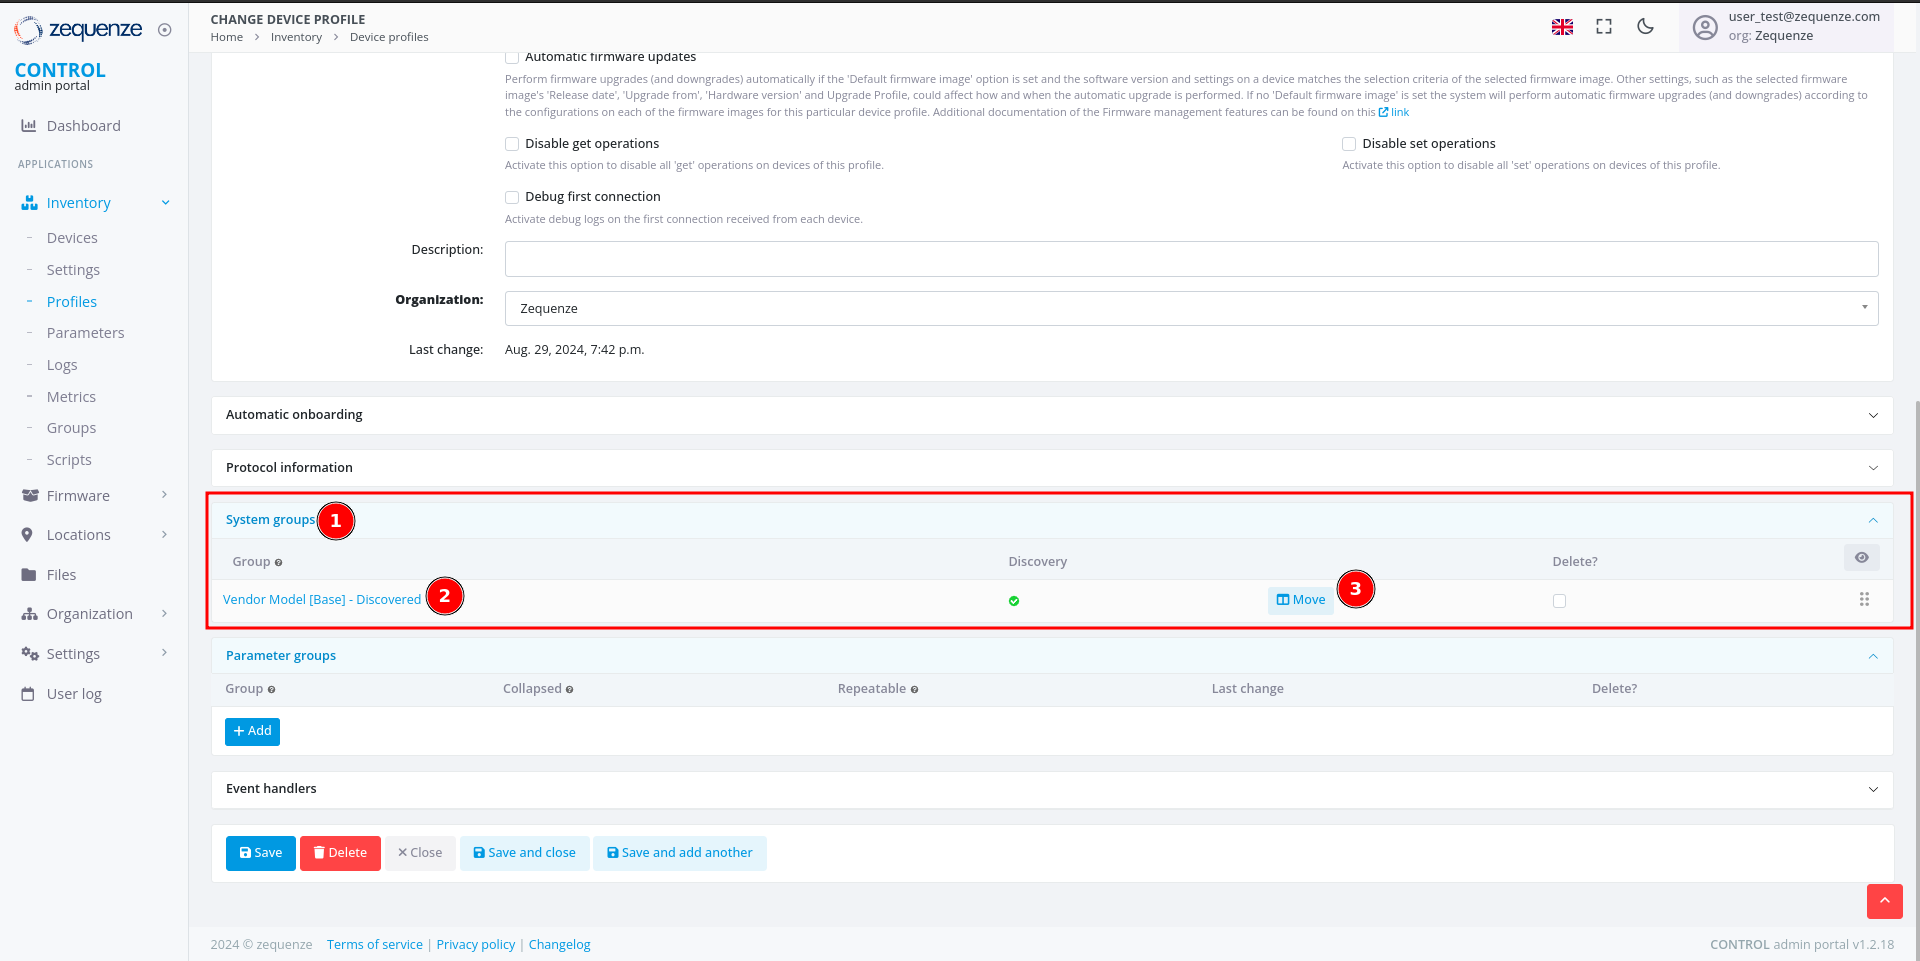 This section contains:
1. **System groups** — Where discovered parameters are stored.
2. **Group** — The name of the parameter group. For discovered parameters, this is typically the profile name followed by "Discovered".
3. **Move** — A button that displays the parameters and their count.
### View Parameter Details
Click the **"Move"** button to open the parameter viewer:
This section contains:
1. **System groups** — Where discovered parameters are stored.
2. **Group** — The name of the parameter group. For discovered parameters, this is typically the profile name followed by "Discovered".
3. **Move** — A button that displays the parameters and their count.
### View Parameter Details
Click the **"Move"** button to open the parameter viewer:
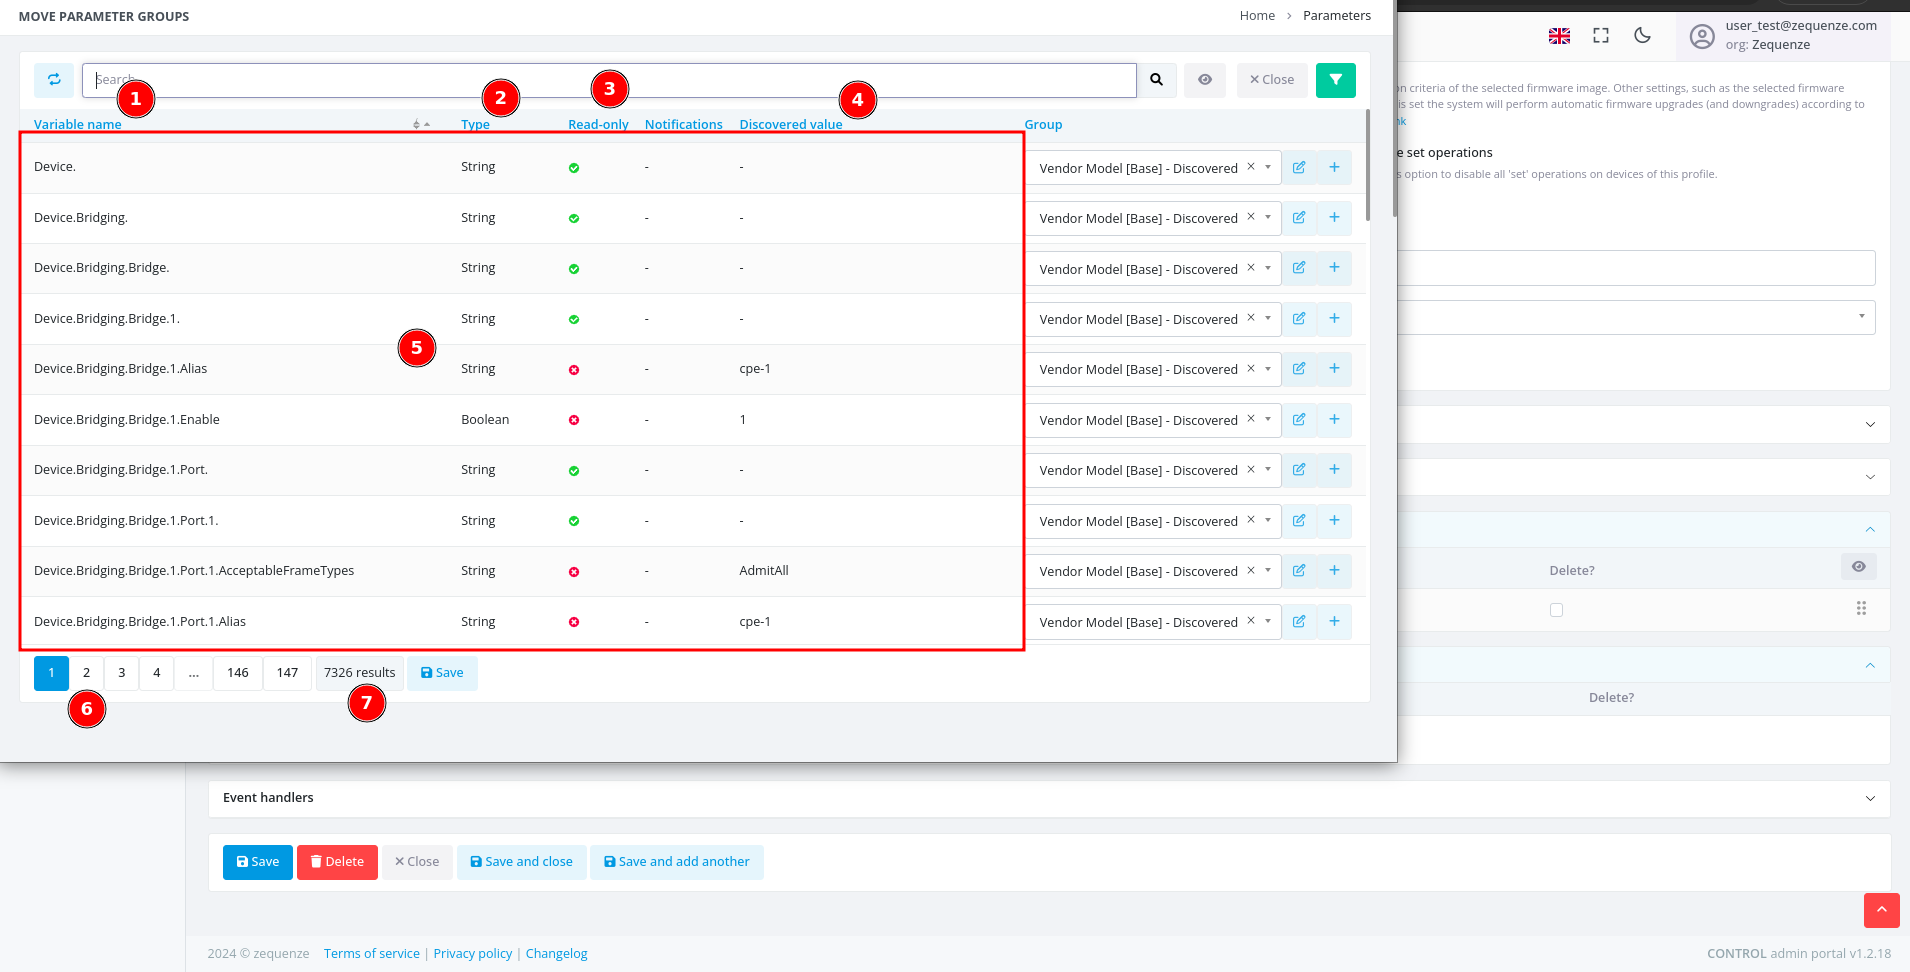 This window displays:
1. **Variable name** — The name of each discovered parameter.
2. **Type** — The parameter data type (e.g., string, integer, date, etc.).
3. **Read-only** — Indicates whether the parameter is read-only or writable.
4. **Discovered value** — The value discovered from the example device.
5. **Values** — A table containing all parameter information.
6. **Pages** — Navigation controls for browsing multiple pages of parameters.
7. **Quantity** — The total number of parameters available for this device with its current firmware or software version.
> **Reference:** For detailed information about parameters, consult the standard documentation for [TR-098](https://cwmp-data-models.broadband-forum.org/tr-098-1-8-0.html) or [TR-181](https://cwmp-data-models.broadband-forum.org/tr-181-2-18-0-cwmp.html).
## Next Steps
You can now export all discovered parameters to Excel or other formats for local analysis. This process will be covered in the next section.
# Export the parameters
## Overview
This guide explains how to locate, filter, and export parameter groups from the CONTROL portal. You'll learn to navigate to the Parameters section, apply filters to find specific groups, and export the data in your preferred format.
---
## Navigate to the Parameters Section
Begin by accessing the Parameters area within the Inventory module.
[](https://docs.zequenze.com/uploads/images/gallery/2024-08/vCmPlY55Bib7hJ7E-image.png)
1. Click on **Inventory**
2. Click on **Parameters**
3. Click on **Parameters** again
4. Activate the filter by clicking the **green funnel icon**
---
## Filter Parameters by Group
Once the filter panel is open, you can search for specific parameter groups.
[](https://docs.zequenze.com/uploads/images/gallery/2024-08/toGhtf11sQI9qsl9-image.png)
1. The filter panel displays available filter options
2. Locate the **Group** field
### Search for Your Group
[](https://docs.zequenze.com/uploads/images/gallery/2024-08/OHrr7XF6n5tbCl8F-image.png)
1. In the **Group** field, enter a search term (e.g., type *"Disco"* to find all groups containing the word *"Discovered"*)
2. Select your desired group from the results (e.g., **"Vendor Model [Base] - Discovered"**)
3. Click the **Proceed** button to apply the filter
---
## Verify Filtered Results
After applying the filter, confirm that the correct parameters are displayed.
[](https://docs.zequenze.com/uploads/images/gallery/2024-08/uMZdfdQEezBuJMS4-image.png)
1. Review the applied Group filter
2. Verify that the parameter count matches the expected number from your Profile (you can confirm the quantity by comparing it with the number of parameters Discovered in the Profile)
3. Proceed to export the parameters
---
## Export the Parameters
### Initiate the Export
Click the **Export** button to open the export dialog.
[](https://docs.zequenze.com/uploads/images/gallery/2024-08/dbVMA4cDCxPZk9If-image.png)
### Select Export Format
Choose your preferred file format from the available options.
[](https://docs.zequenze.com/uploads/images/gallery/2024-08/rEfW5Ruensoz7Atn-image.png)
[](https://docs.zequenze.com/uploads/images/gallery/2024-08/O2xaE6N5ormqDOSv-image.png)
1. Select your desired format (e.g., **CSV**)
2. Click the **Export** button to start the export process
---
## Download the Exported File
### Monitor Export Progress
After initiating the export, a progress indicator appears at the top of your browser showing that the report is being generated.
[](https://docs.zequenze.com/uploads/images/gallery/2024-08/iOwGL8BWiW8FTxSP-image.png)
### Download Complete
When the export is ready, a download notification will appear.
[](https://docs.zequenze.com/uploads/images/gallery/2024-08/MlhHglIVaVDFrZgQ-image.png)
### Open the File
You can now open the exported CSV file to view your parameters.
[](https://docs.zequenze.com/uploads/images/gallery/2024-08/s0yf73kHf4Rnfrcu-image.png)
# Formatting the Parameters
This guide demonstrates how to format and organize parameters exported from CONTROL using a spreadsheet application. This example uses LibreOffice Calc, but you can apply the same process in Microsoft Excel or similar tools.
## Opening the Exported File
When you open the exported parameters file in LibreOffice, a **Text Import** dialog will appear:
This window displays:
1. **Variable name** — The name of each discovered parameter.
2. **Type** — The parameter data type (e.g., string, integer, date, etc.).
3. **Read-only** — Indicates whether the parameter is read-only or writable.
4. **Discovered value** — The value discovered from the example device.
5. **Values** — A table containing all parameter information.
6. **Pages** — Navigation controls for browsing multiple pages of parameters.
7. **Quantity** — The total number of parameters available for this device with its current firmware or software version.
> **Reference:** For detailed information about parameters, consult the standard documentation for [TR-098](https://cwmp-data-models.broadband-forum.org/tr-098-1-8-0.html) or [TR-181](https://cwmp-data-models.broadband-forum.org/tr-181-2-18-0-cwmp.html).
## Next Steps
You can now export all discovered parameters to Excel or other formats for local analysis. This process will be covered in the next section.
# Export the parameters
## Overview
This guide explains how to locate, filter, and export parameter groups from the CONTROL portal. You'll learn to navigate to the Parameters section, apply filters to find specific groups, and export the data in your preferred format.
---
## Navigate to the Parameters Section
Begin by accessing the Parameters area within the Inventory module.
[](https://docs.zequenze.com/uploads/images/gallery/2024-08/vCmPlY55Bib7hJ7E-image.png)
1. Click on **Inventory**
2. Click on **Parameters**
3. Click on **Parameters** again
4. Activate the filter by clicking the **green funnel icon**
---
## Filter Parameters by Group
Once the filter panel is open, you can search for specific parameter groups.
[](https://docs.zequenze.com/uploads/images/gallery/2024-08/toGhtf11sQI9qsl9-image.png)
1. The filter panel displays available filter options
2. Locate the **Group** field
### Search for Your Group
[](https://docs.zequenze.com/uploads/images/gallery/2024-08/OHrr7XF6n5tbCl8F-image.png)
1. In the **Group** field, enter a search term (e.g., type *"Disco"* to find all groups containing the word *"Discovered"*)
2. Select your desired group from the results (e.g., **"Vendor Model [Base] - Discovered"**)
3. Click the **Proceed** button to apply the filter
---
## Verify Filtered Results
After applying the filter, confirm that the correct parameters are displayed.
[](https://docs.zequenze.com/uploads/images/gallery/2024-08/uMZdfdQEezBuJMS4-image.png)
1. Review the applied Group filter
2. Verify that the parameter count matches the expected number from your Profile (you can confirm the quantity by comparing it with the number of parameters Discovered in the Profile)
3. Proceed to export the parameters
---
## Export the Parameters
### Initiate the Export
Click the **Export** button to open the export dialog.
[](https://docs.zequenze.com/uploads/images/gallery/2024-08/dbVMA4cDCxPZk9If-image.png)
### Select Export Format
Choose your preferred file format from the available options.
[](https://docs.zequenze.com/uploads/images/gallery/2024-08/rEfW5Ruensoz7Atn-image.png)
[](https://docs.zequenze.com/uploads/images/gallery/2024-08/O2xaE6N5ormqDOSv-image.png)
1. Select your desired format (e.g., **CSV**)
2. Click the **Export** button to start the export process
---
## Download the Exported File
### Monitor Export Progress
After initiating the export, a progress indicator appears at the top of your browser showing that the report is being generated.
[](https://docs.zequenze.com/uploads/images/gallery/2024-08/iOwGL8BWiW8FTxSP-image.png)
### Download Complete
When the export is ready, a download notification will appear.
[](https://docs.zequenze.com/uploads/images/gallery/2024-08/MlhHglIVaVDFrZgQ-image.png)
### Open the File
You can now open the exported CSV file to view your parameters.
[](https://docs.zequenze.com/uploads/images/gallery/2024-08/s0yf73kHf4Rnfrcu-image.png)
# Formatting the Parameters
This guide demonstrates how to format and organize parameters exported from CONTROL using a spreadsheet application. This example uses LibreOffice Calc, but you can apply the same process in Microsoft Excel or similar tools.
## Opening the Exported File
When you open the exported parameters file in LibreOffice, a **Text Import** dialog will appear:
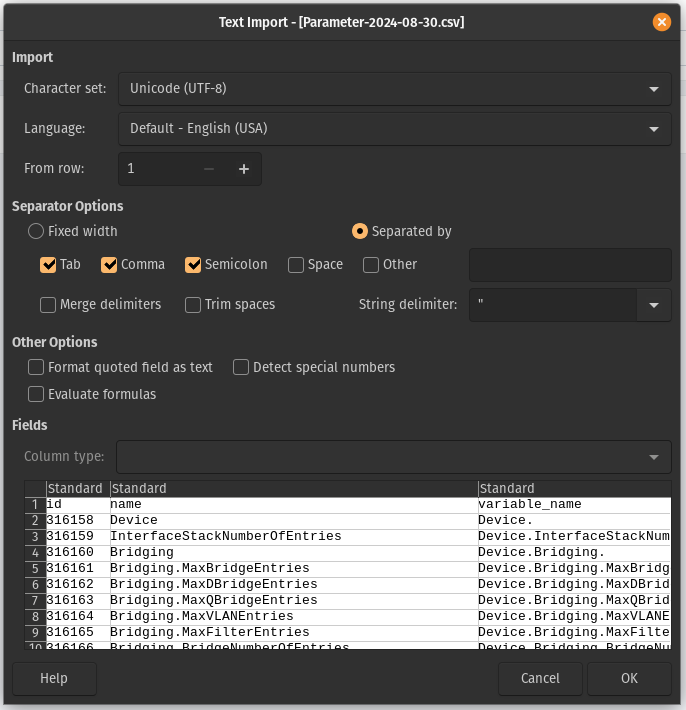 For most cases, you can simply click **OK** to accept the default import settings. If you're using Excel, you may need to use the "Import Data" function to load the file properly.
## Understanding the Parameter Sheet
After importing, you'll see a spreadsheet with many columns and parameters:
For most cases, you can simply click **OK** to accept the default import settings. If you're using Excel, you may need to use the "Import Data" function to load the file properly.
## Understanding the Parameter Sheet
After importing, you'll see a spreadsheet with many columns and parameters:
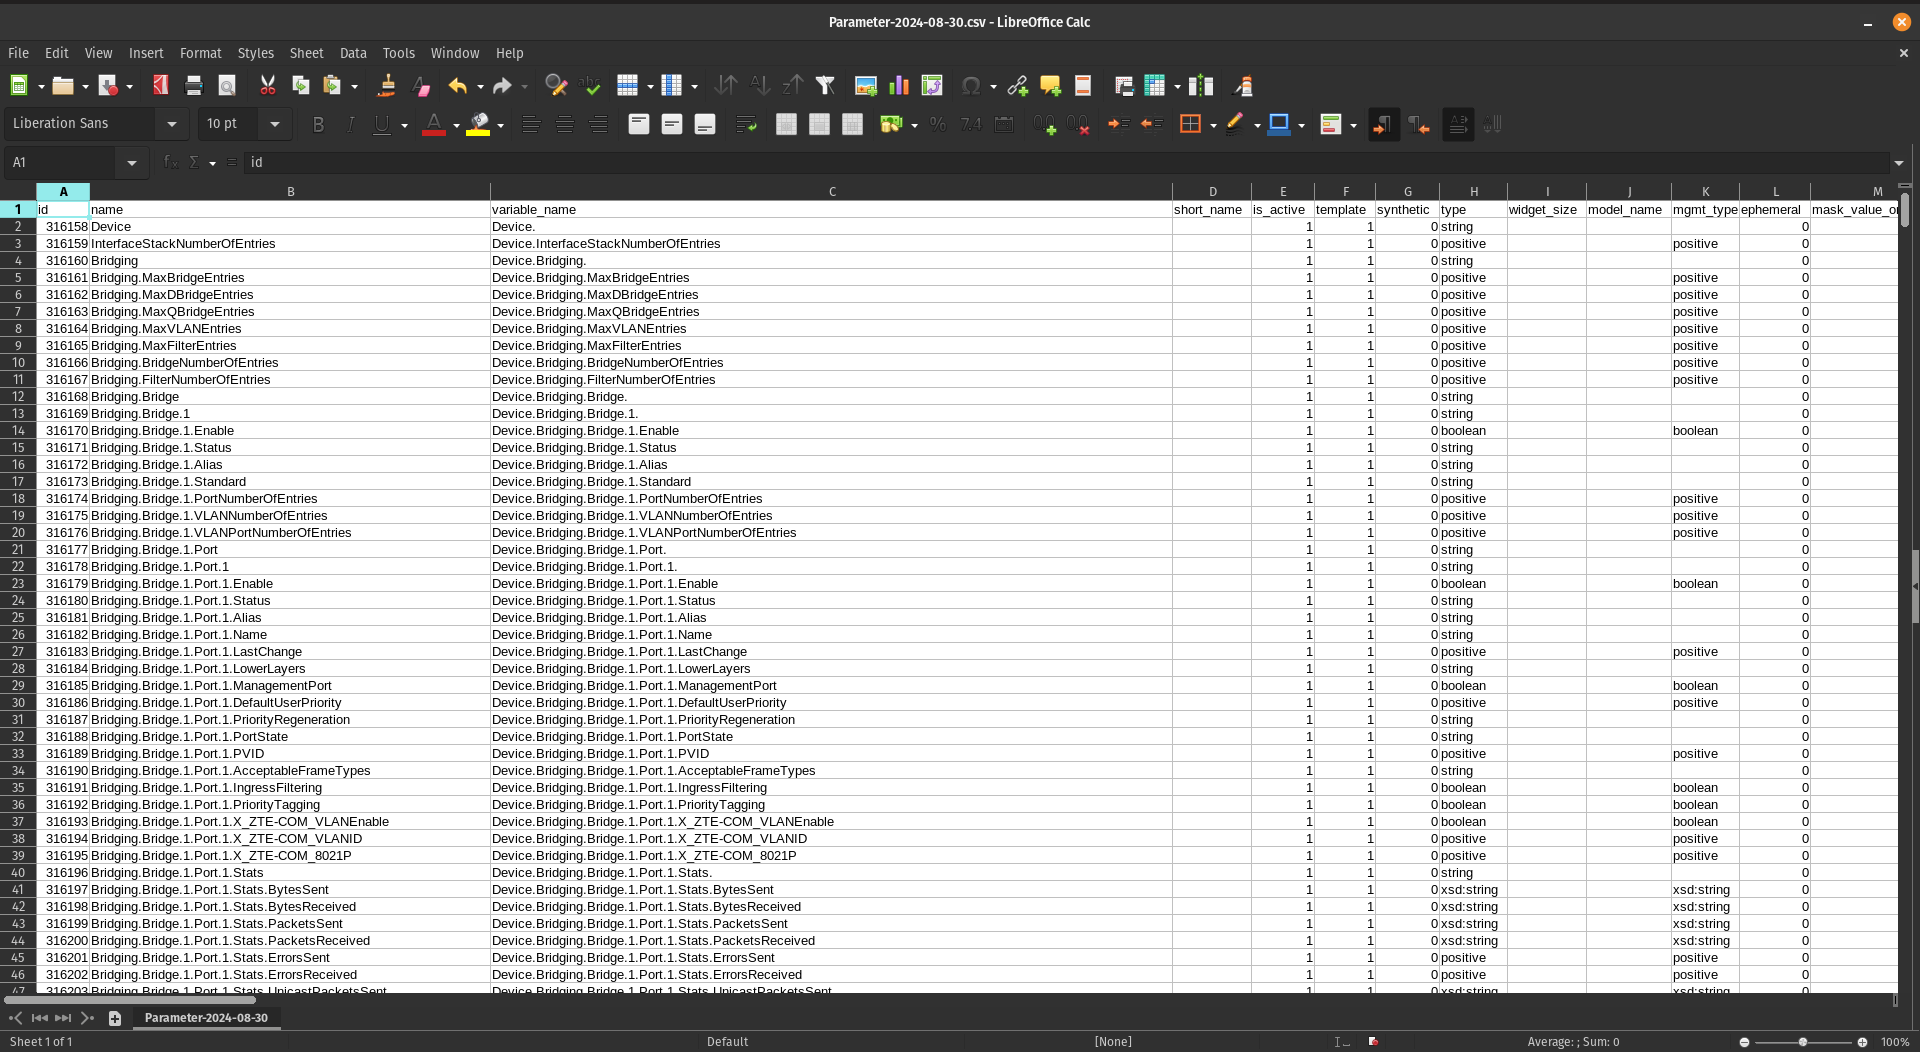 Don't be intimidated by the number of parameters—once you understand the structure, working with them becomes straightforward.
## Extracting Key Columns
For this workflow, you'll need to create a new sheet and copy only four specific columns from the original data.
### Step 1: Create a New Sheet
Create a second sheet (Sheet2) in your workbook to organize the filtered data:
Don't be intimidated by the number of parameters—once you understand the structure, working with them becomes straightforward.
## Extracting Key Columns
For this workflow, you'll need to create a new sheet and copy only four specific columns from the original data.
### Step 1: Create a New Sheet
Create a second sheet (Sheet2) in your workbook to organize the filtered data:
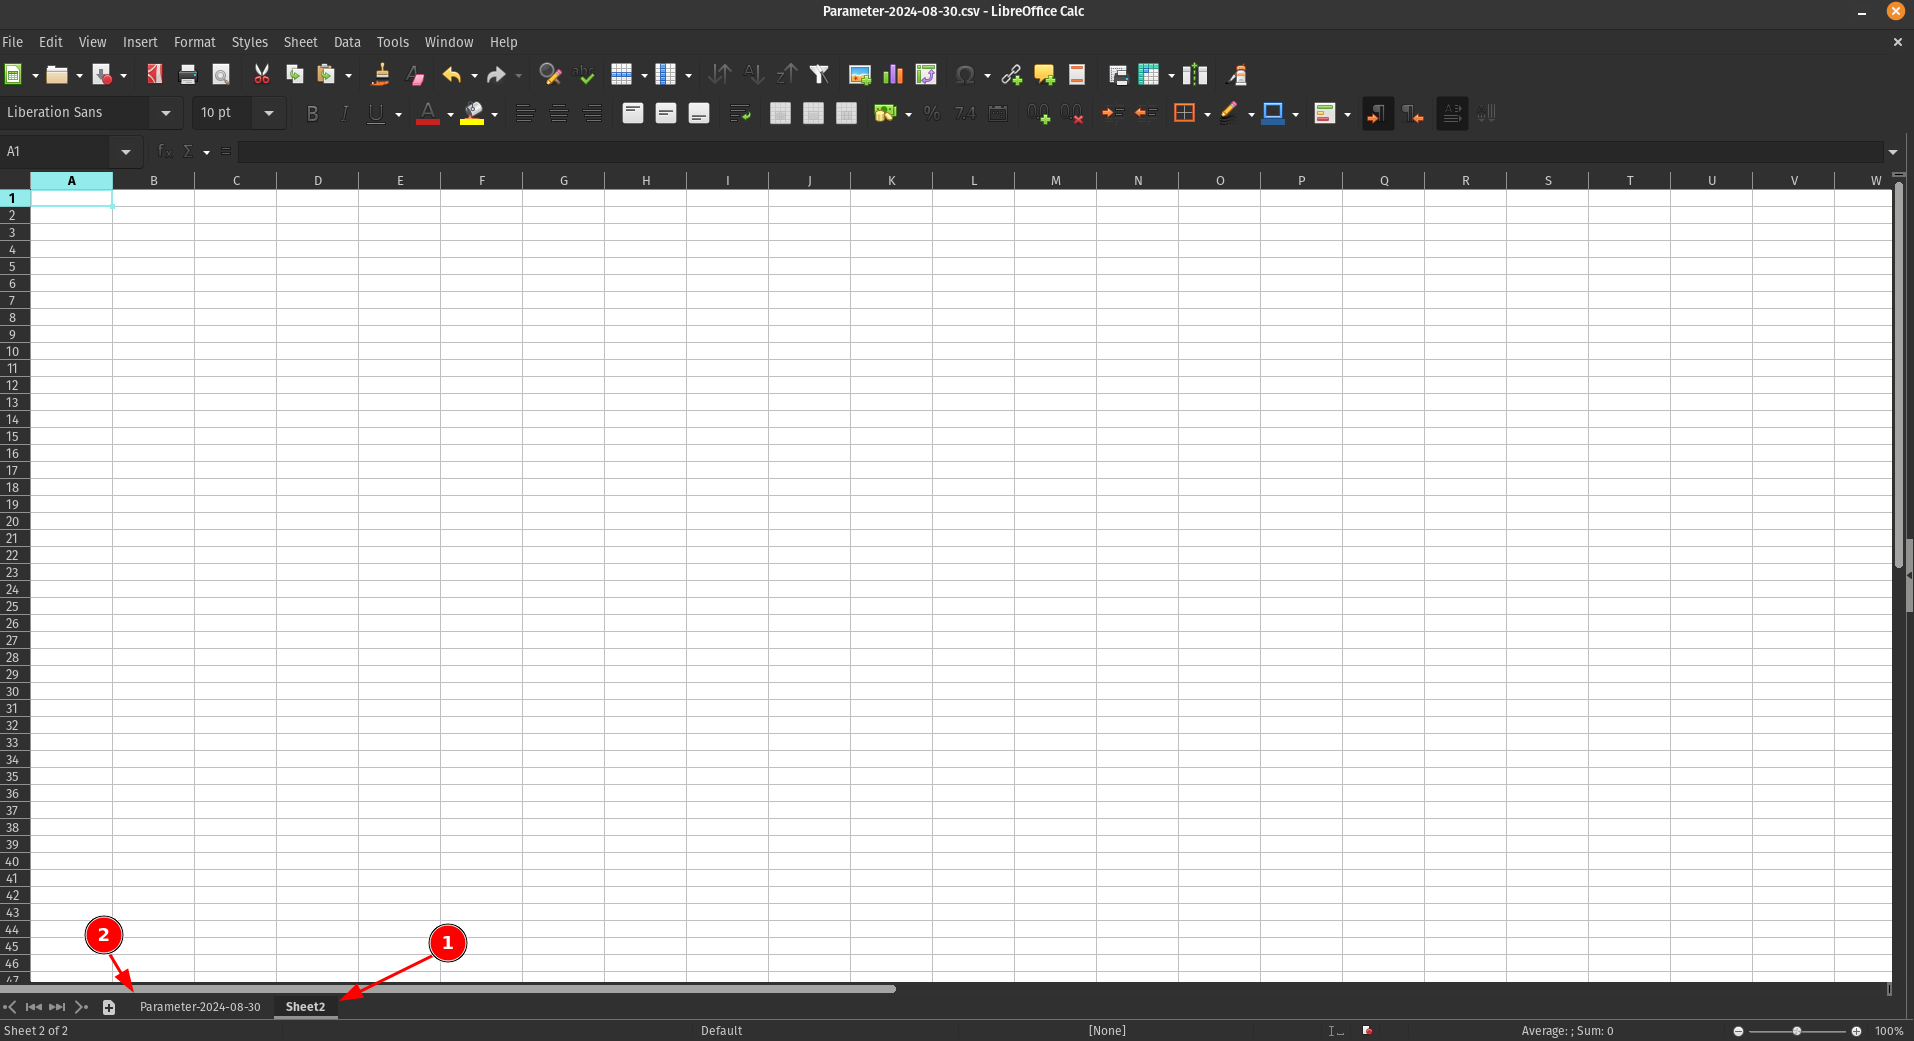 1. **Sheet2** - Your new working sheet
2. **Sheet1** - The original sheet with all parameters
### Step 2: Identify the Required Columns
From the original sheet, locate and copy the following four columns:
1. **Sheet2** - Your new working sheet
2. **Sheet1** - The original sheet with all parameters
### Step 2: Identify the Required Columns
From the original sheet, locate and copy the following four columns:
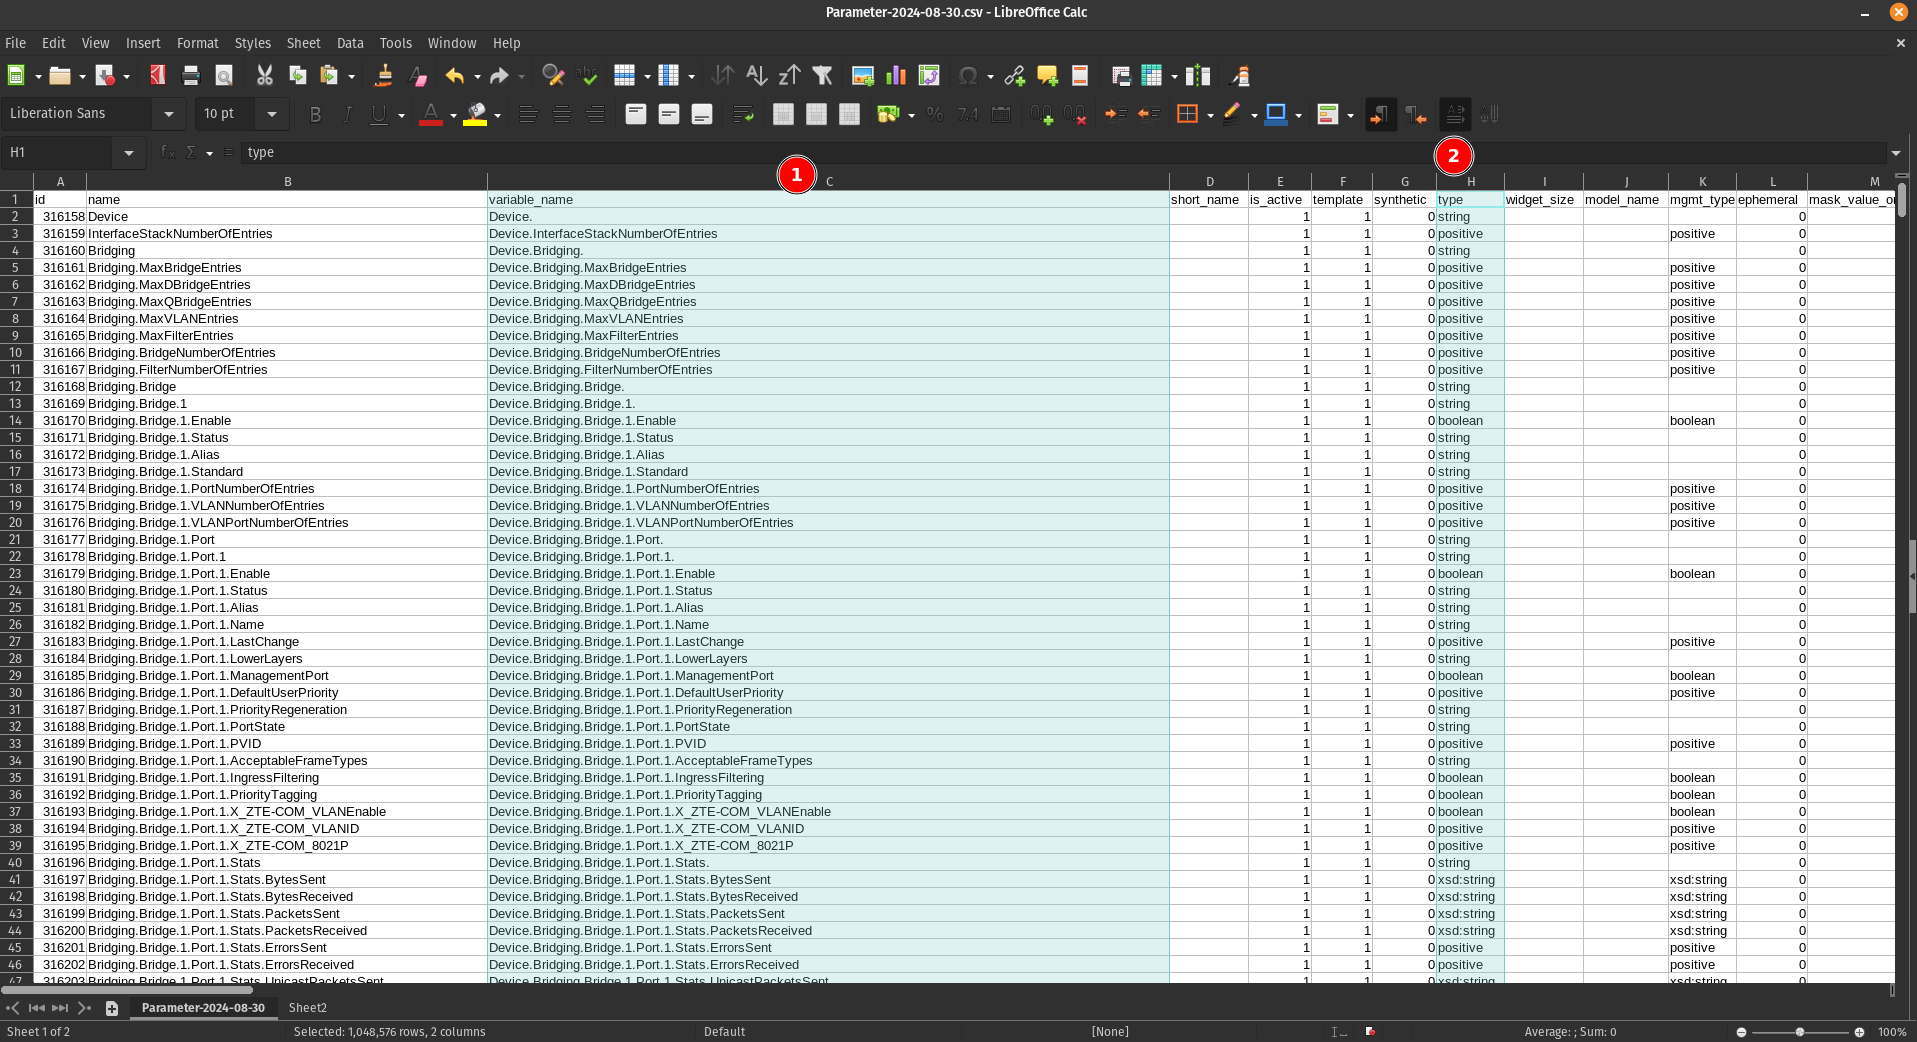 1. **Column C**
2. **Column H**
3. **Column R**
4. **Column AY**
### Step 3: Paste into Sheet2
Copy these four columns and paste them into Sheet2:
1. **Column C**
2. **Column H**
3. **Column R**
4. **Column AY**
### Step 3: Paste into Sheet2
Copy these four columns and paste them into Sheet2:
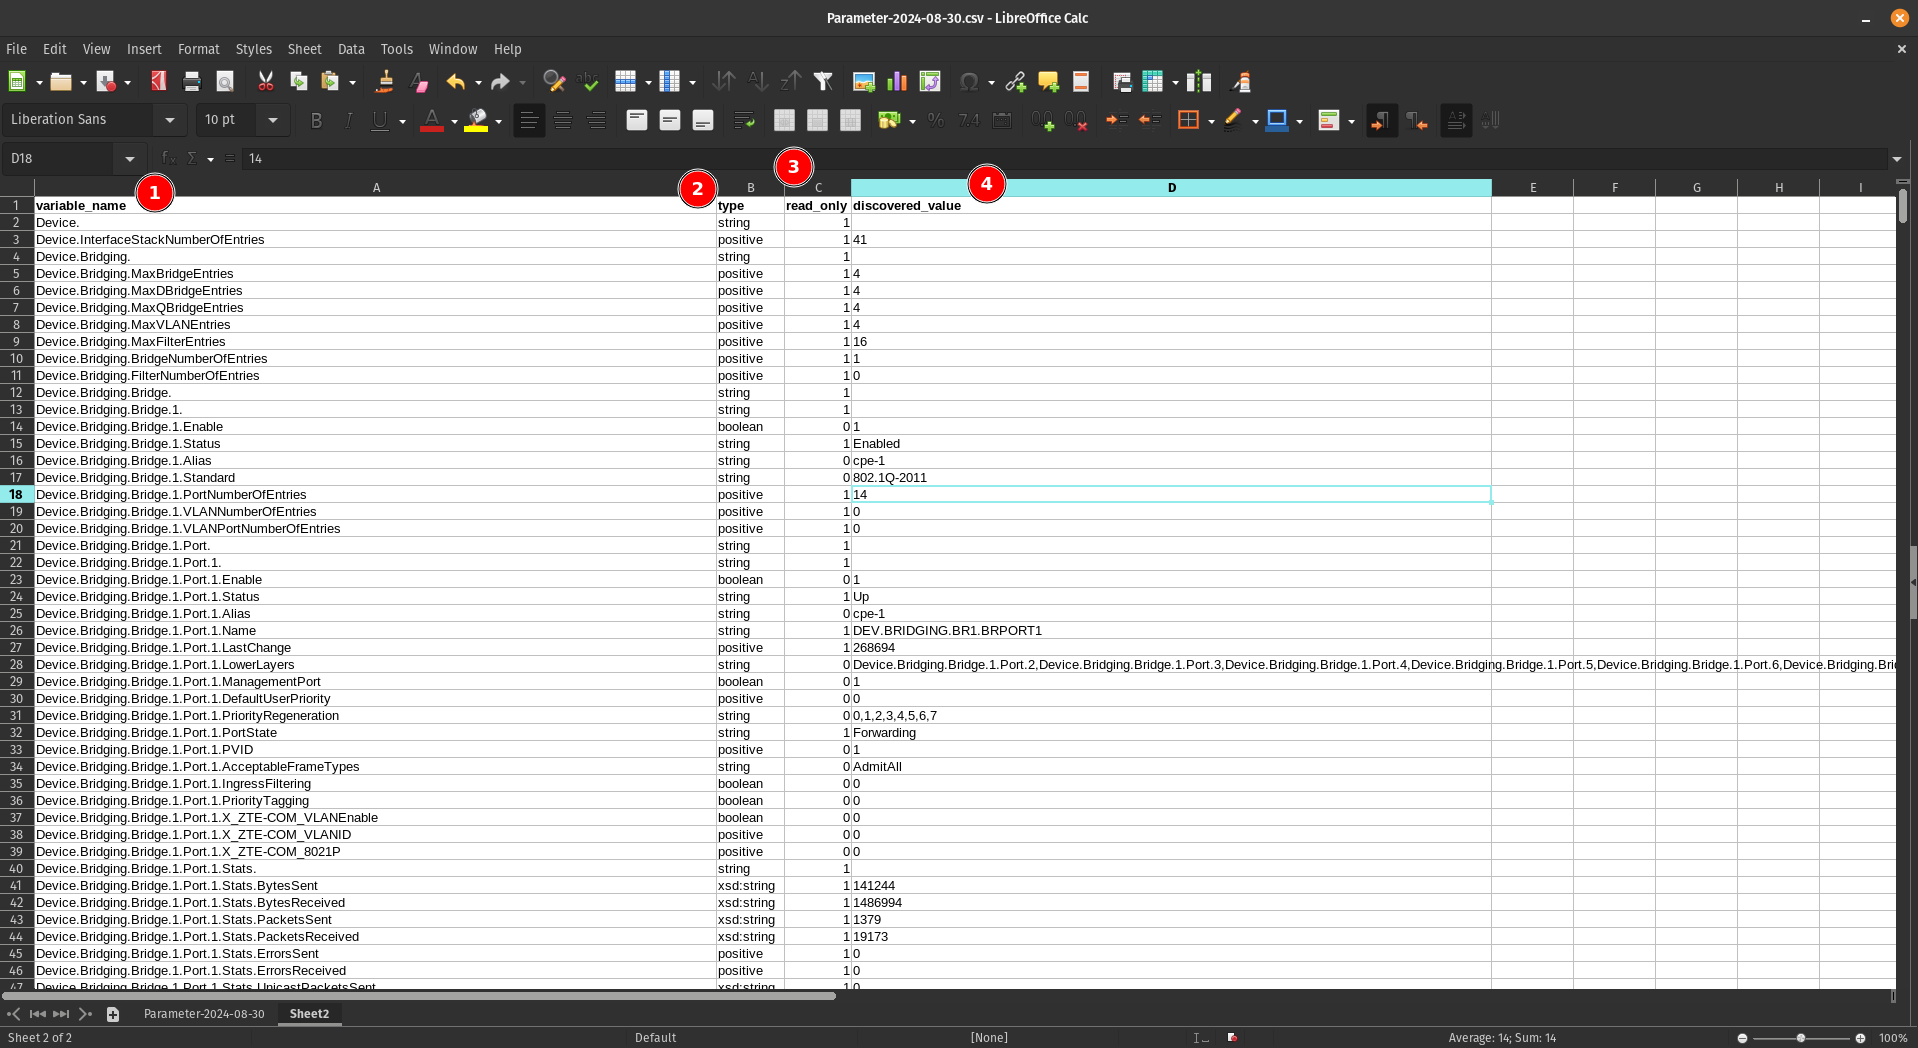 ## Understanding the Column Structure
Your new sheet now contains four essential columns:
1. **variable_name** - Lists all parameters available for devices using this software version
2. **type** - Indicates the data type of each parameter (string, integer, boolean, etc.) and tells us what kind of parameter it is
3. **read_only** - Shows whether the parameter is read-only or can be modified. Some parameters are only read-only and you can't write to them
4. **discovered_value** - Displays the current value of each parameter (for example, the name of one SSID for a WiFi 2.4GHz network)
## Sorting the Parameters
To make the parameters easier to work with, sort them alphabetically by the first column (variable_name):
## Understanding the Column Structure
Your new sheet now contains four essential columns:
1. **variable_name** - Lists all parameters available for devices using this software version
2. **type** - Indicates the data type of each parameter (string, integer, boolean, etc.) and tells us what kind of parameter it is
3. **read_only** - Shows whether the parameter is read-only or can be modified. Some parameters are only read-only and you can't write to them
4. **discovered_value** - Displays the current value of each parameter (for example, the name of one SSID for a WiFi 2.4GHz network)
## Sorting the Parameters
To make the parameters easier to work with, sort them alphabetically by the first column (variable_name):
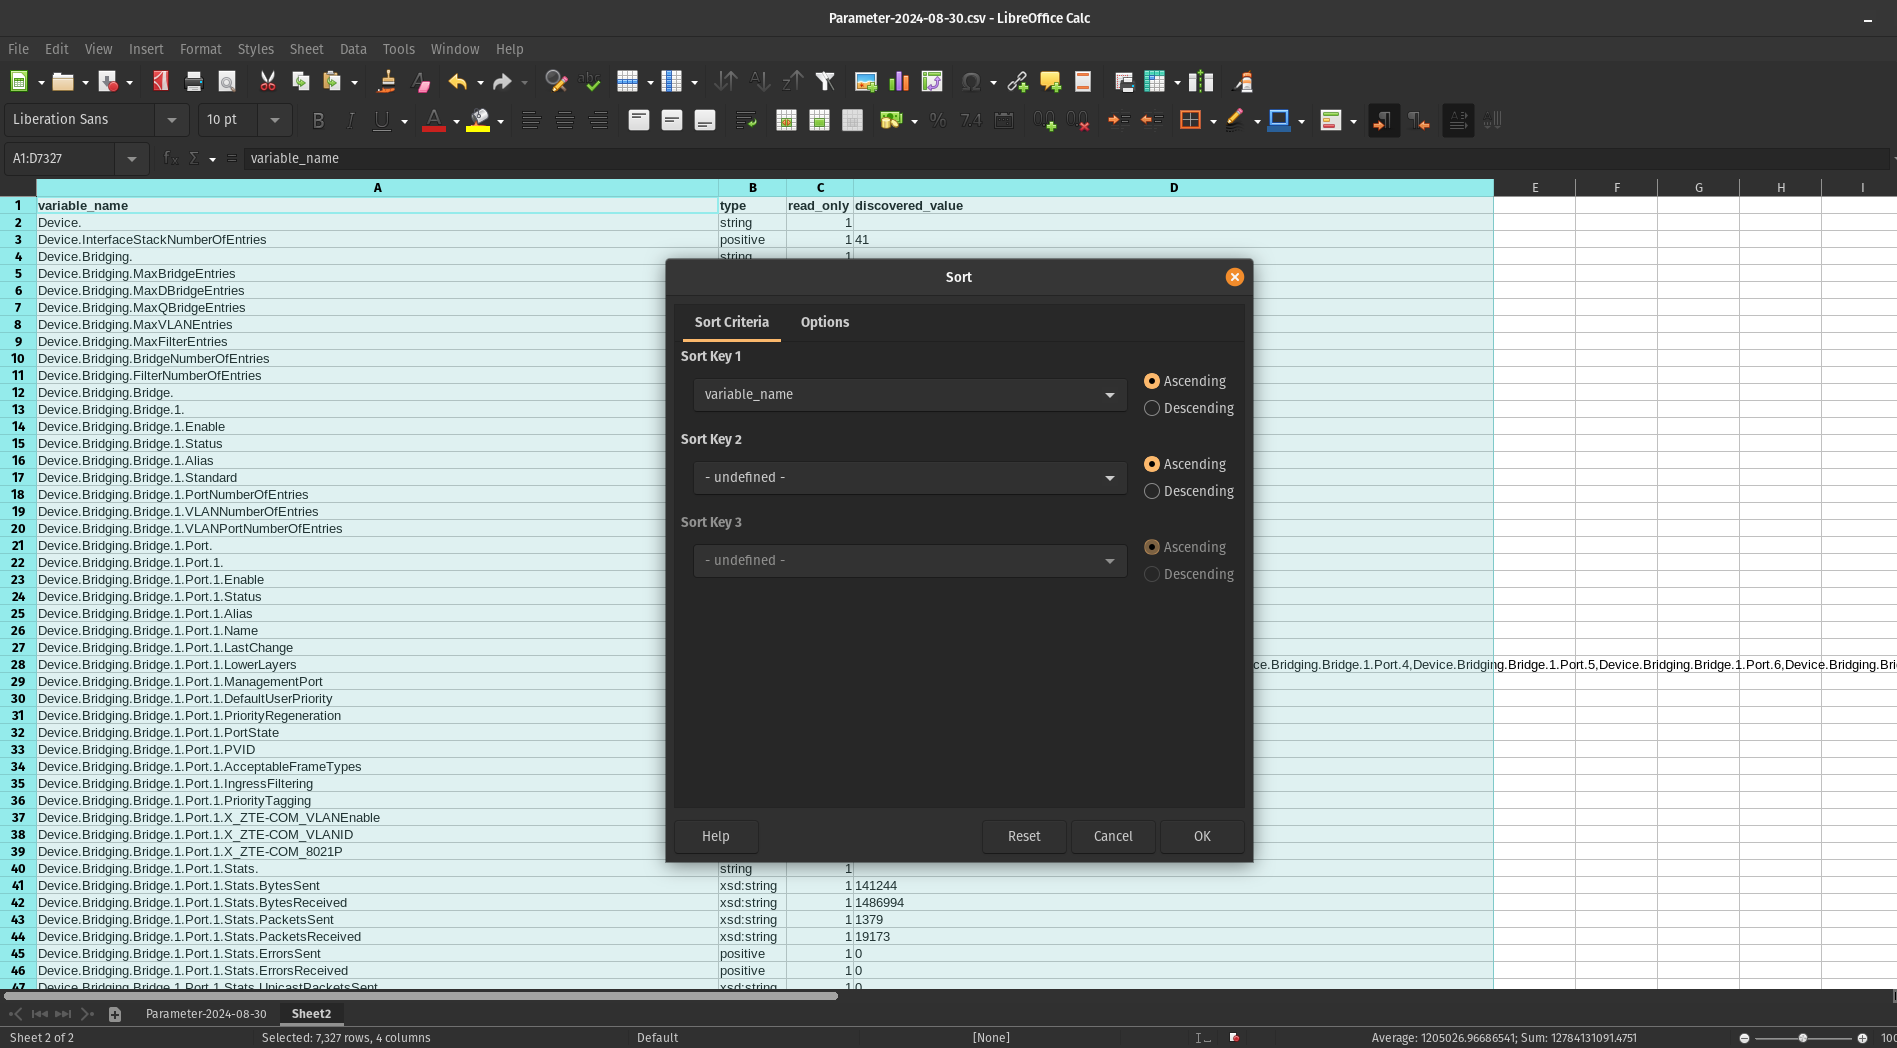 **Note:** Make sure to include the header row when sorting so the column titles remain in place.
### Result
After sorting, your parameters will be organized alphabetically:
**Note:** Make sure to include the header row when sorting so the column titles remain in place.
### Result
After sorting, your parameters will be organized alphabetically:
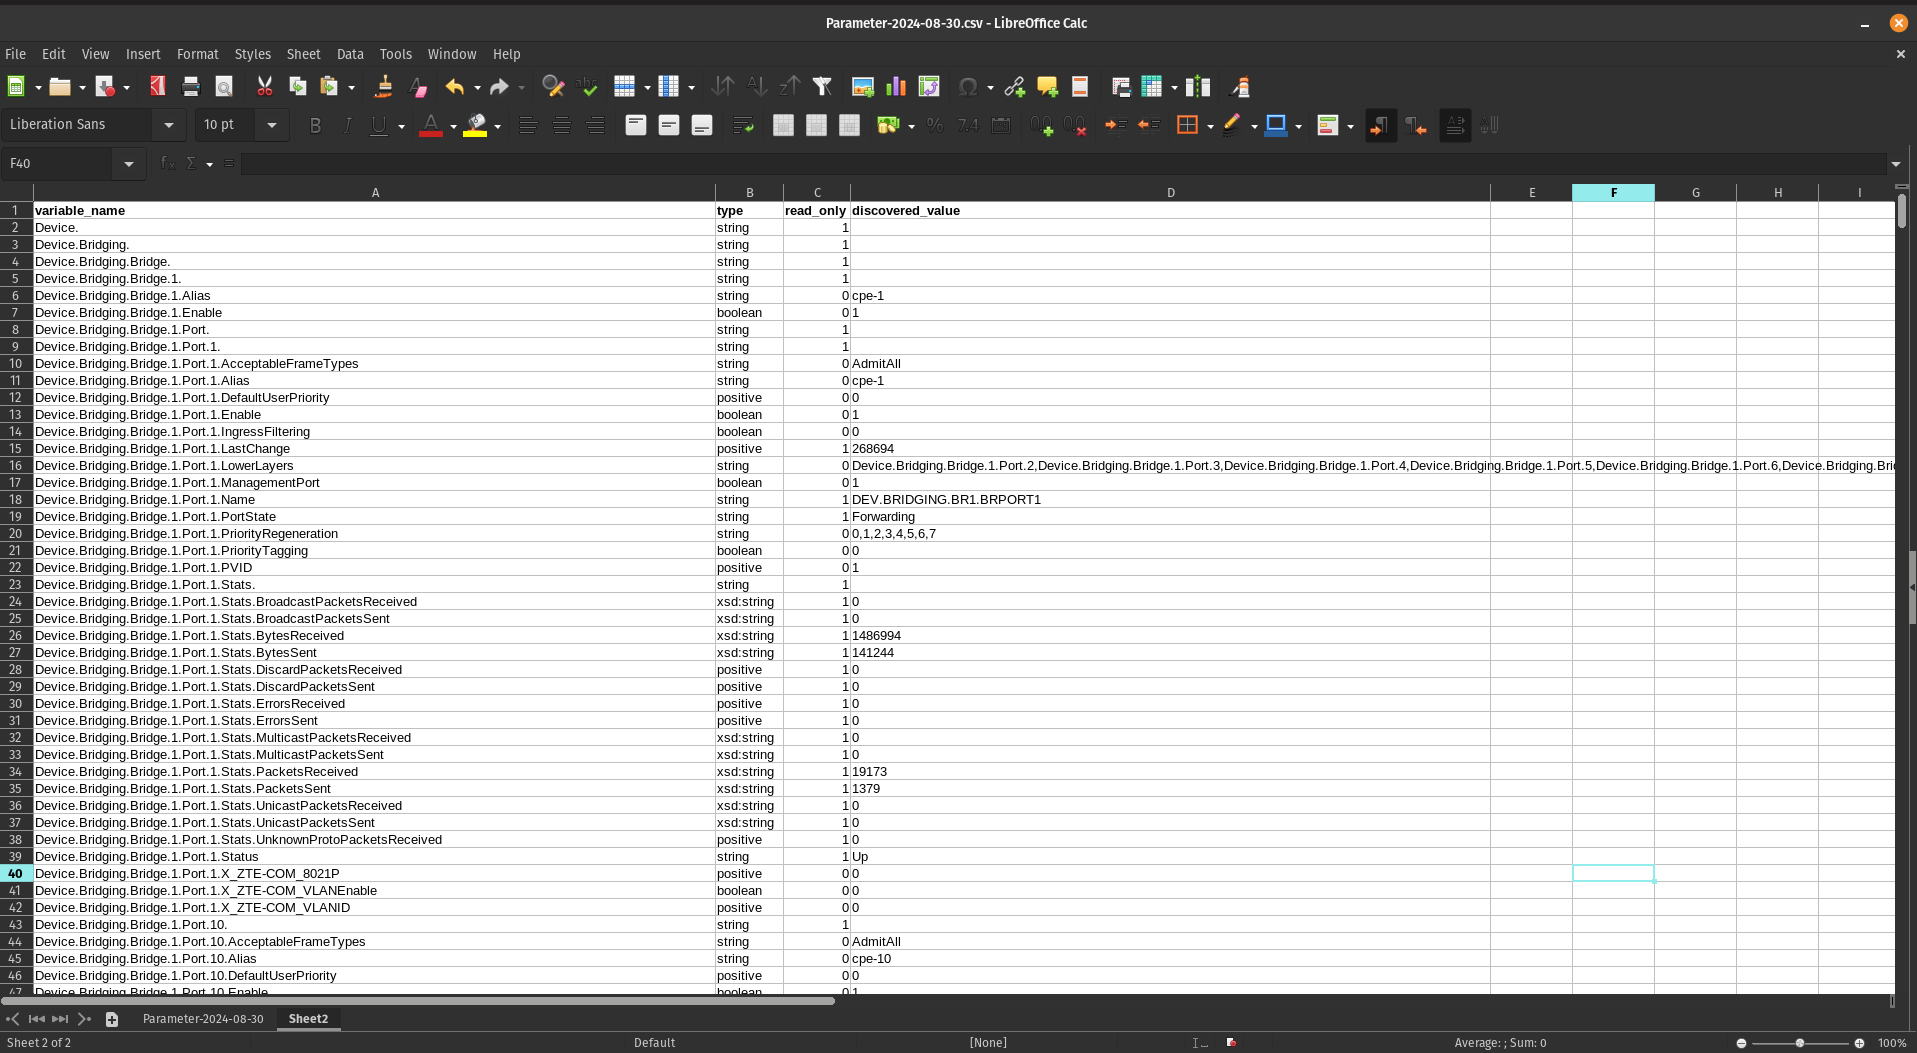 ## Next Steps
With your parameters now organized and easy to navigate, you can begin creating configuration profiles by selecting the specific parameters that meet your requirements.
# First Parameters
## Group Parameters
Before adding parameters to CONTROL, we recommend organizing them into logical groups. This section demonstrates how to group device information parameters as an example.
### Step 1: Identify Parameters in Your Spreadsheet
Begin by locating the parameters you want to group. For this example, we'll group four device information parameters:
## Next Steps
With your parameters now organized and easy to navigate, you can begin creating configuration profiles by selecting the specific parameters that meet your requirements.
# First Parameters
## Group Parameters
Before adding parameters to CONTROL, we recommend organizing them into logical groups. This section demonstrates how to group device information parameters as an example.
### Step 1: Identify Parameters in Your Spreadsheet
Begin by locating the parameters you want to group. For this example, we'll group four device information parameters:
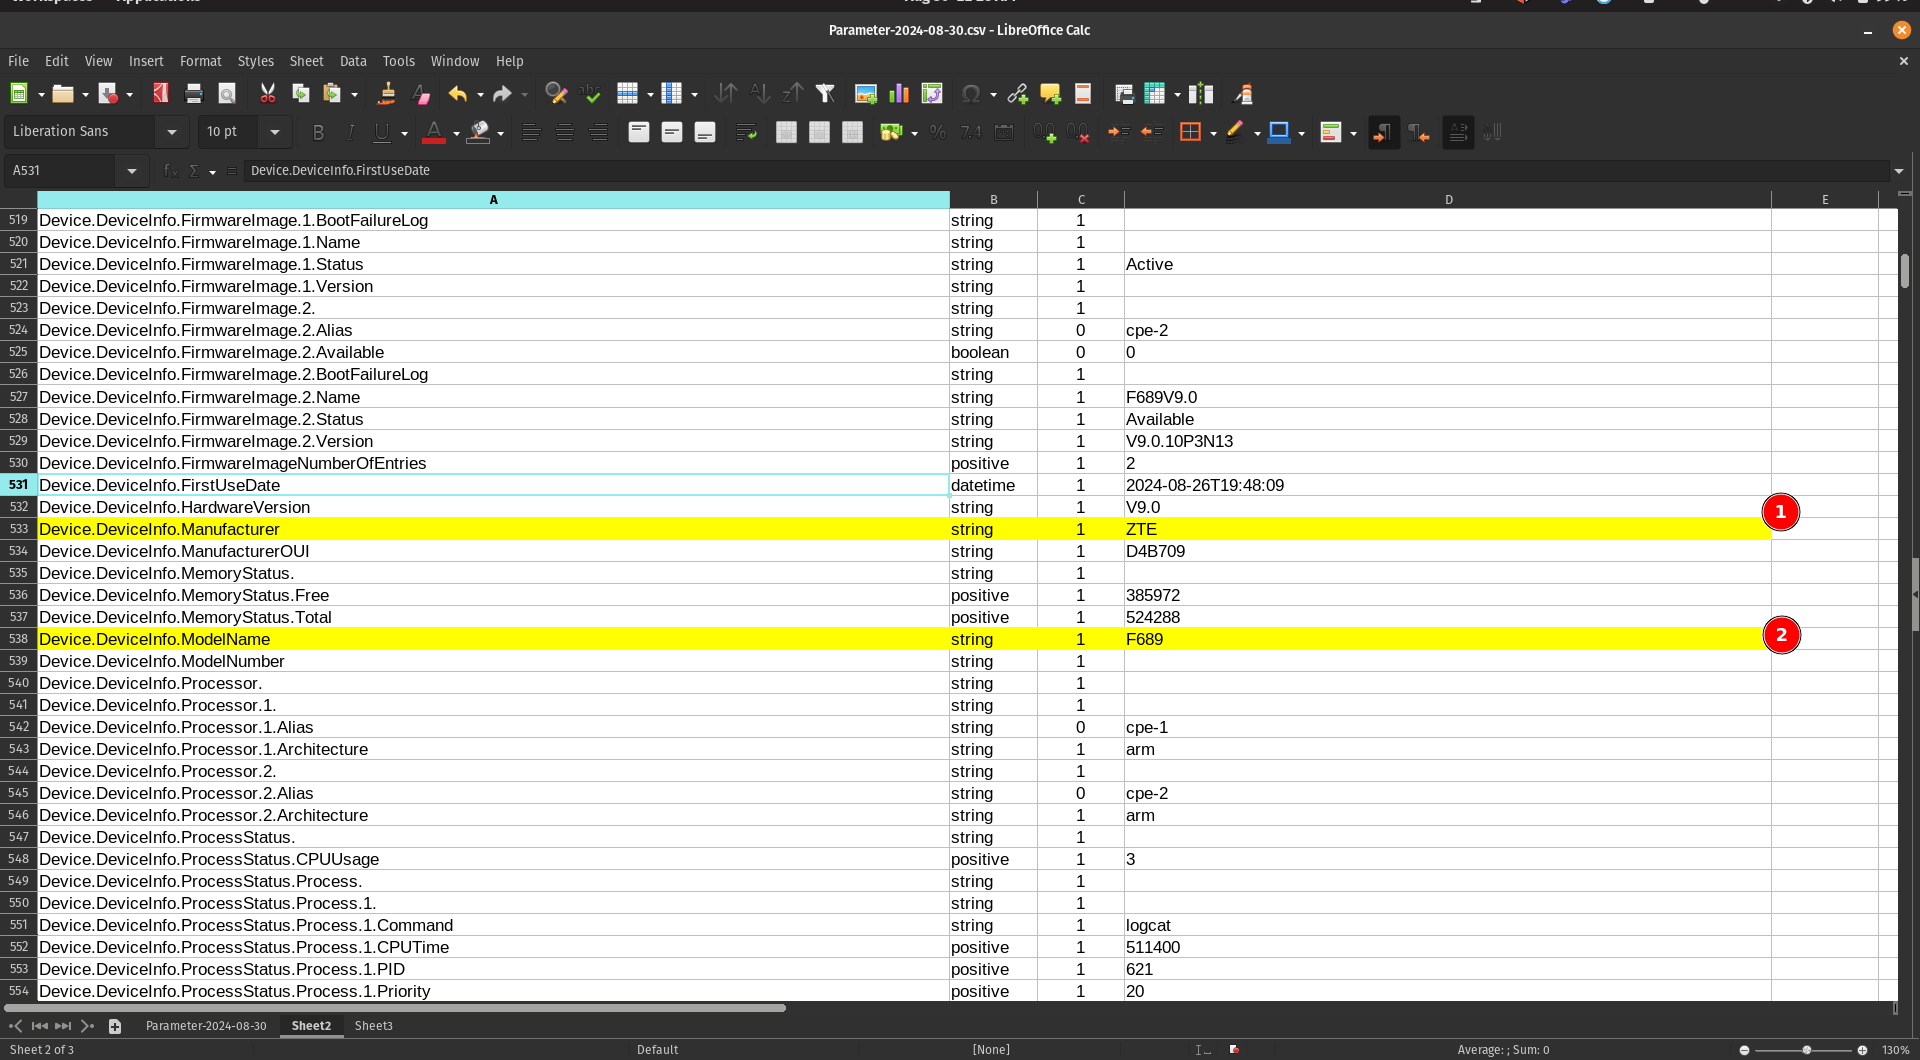 1. Locate the **Manufacturer** parameter
2. Locate the **ModelName** parameter
### Step 2: Copy Parameters to a New Sheet
When you mark or find the parameters you need, copy them to a separate sheet for easier organization:
1. Locate the **Manufacturer** parameter
2. Locate the **ModelName** parameter
### Step 2: Copy Parameters to a New Sheet
When you mark or find the parameters you need, copy them to a separate sheet for easier organization:
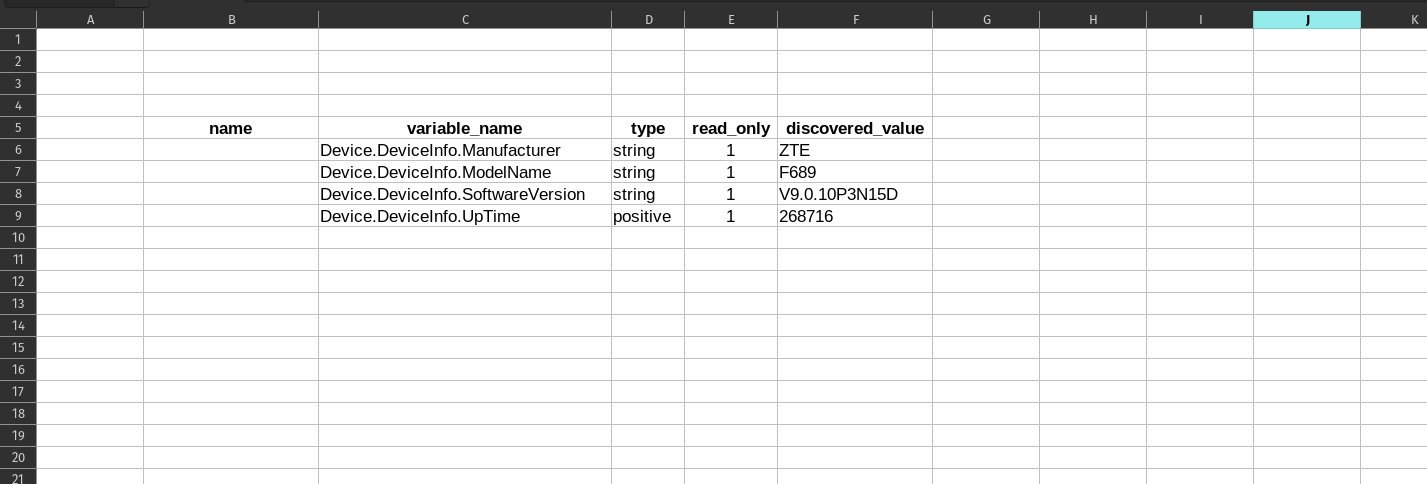 ### Step 3: Add Friendly Names
Add a new **"name"** column to create user-friendly labels for each parameter:
### Step 3: Add Friendly Names
Add a new **"name"** column to create user-friendly labels for each parameter:
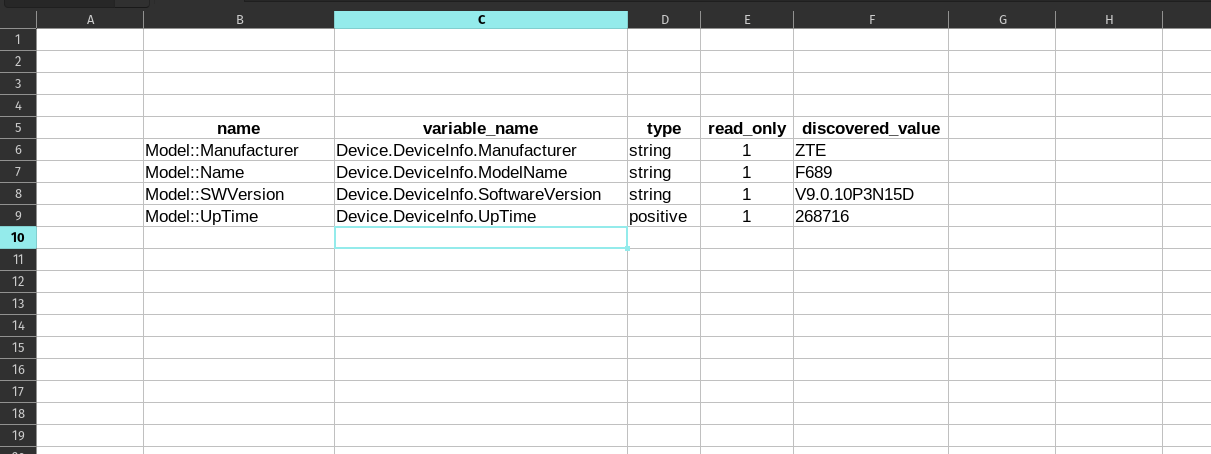 You can assign a short, descriptive name for each "variable_name" to establish a clear relationship between the technical parameter name and its display name.
---
## Add Parameters to a Profile
Now that you've organized your parameters, it's time to add them to your device profile in CONTROL.
### Step 1: Navigate to Parameter Groups Section
Return to the profile you created previously and scroll down to the bottom of the page:
You can assign a short, descriptive name for each "variable_name" to establish a clear relationship between the technical parameter name and its display name.
---
## Add Parameters to a Profile
Now that you've organized your parameters, it's time to add them to your device profile in CONTROL.
### Step 1: Navigate to Parameter Groups Section
Return to the profile you created previously and scroll down to the bottom of the page:
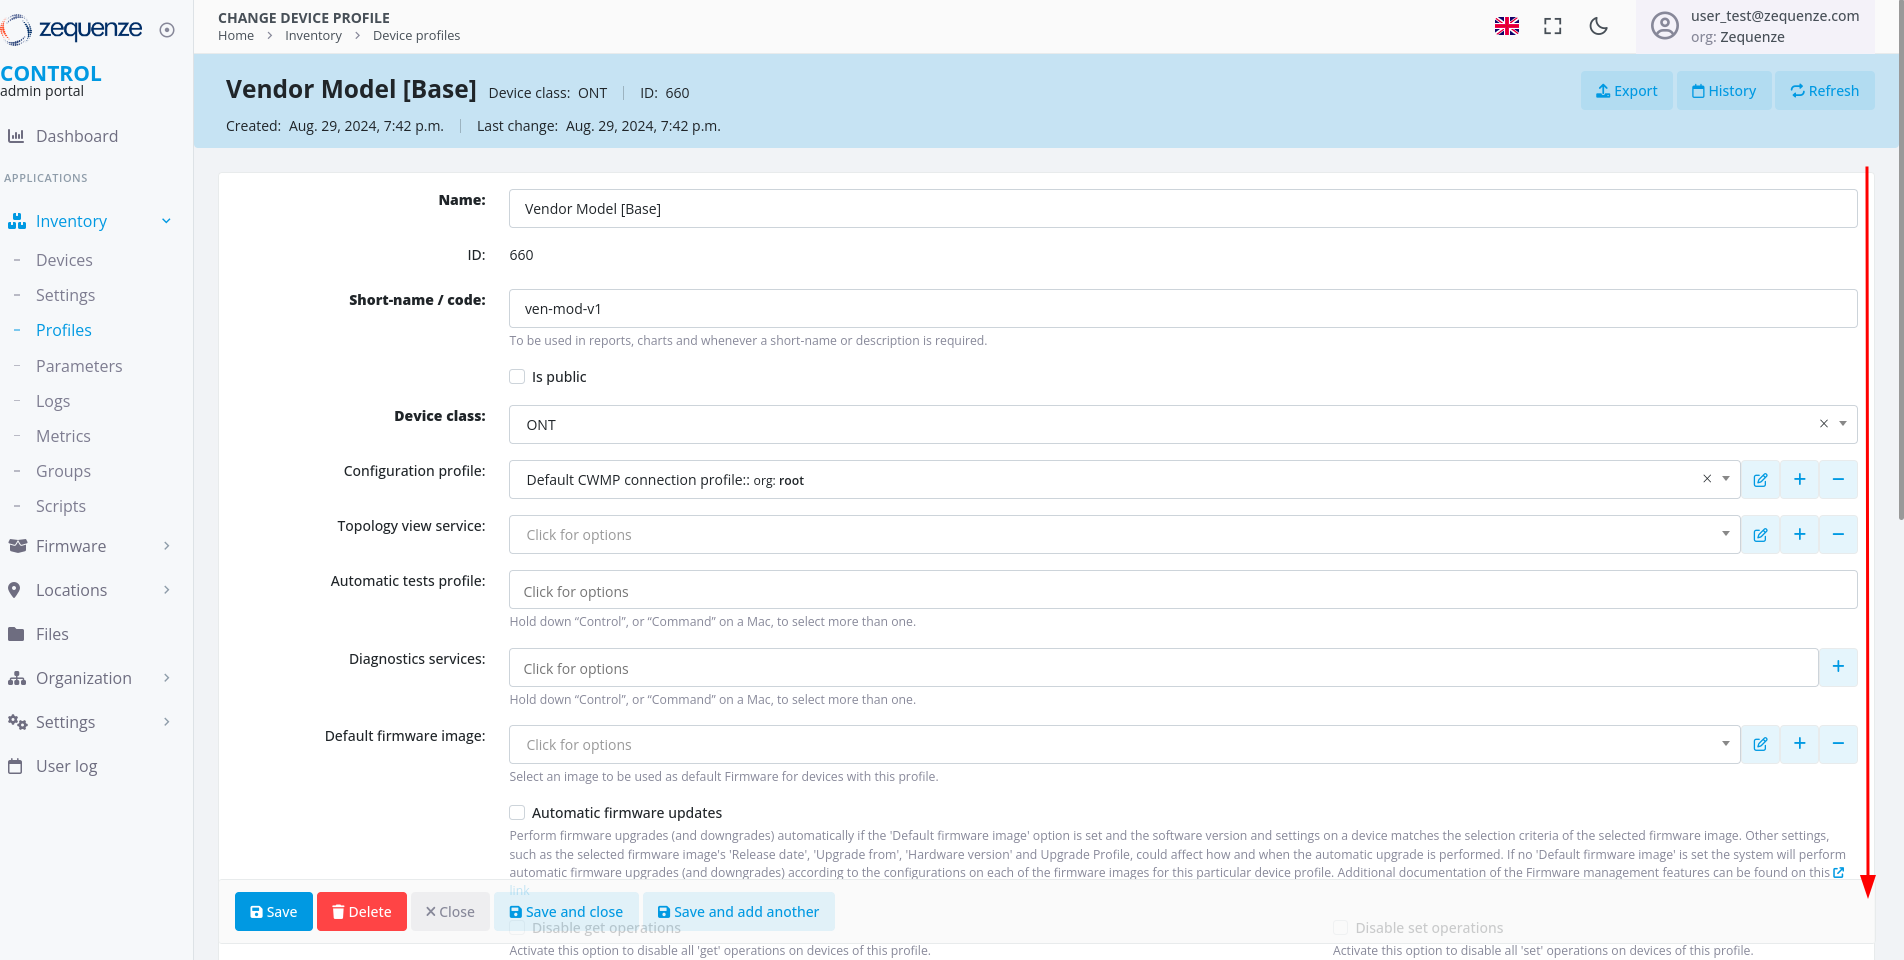 Locate the **"Parameter groups"** section:
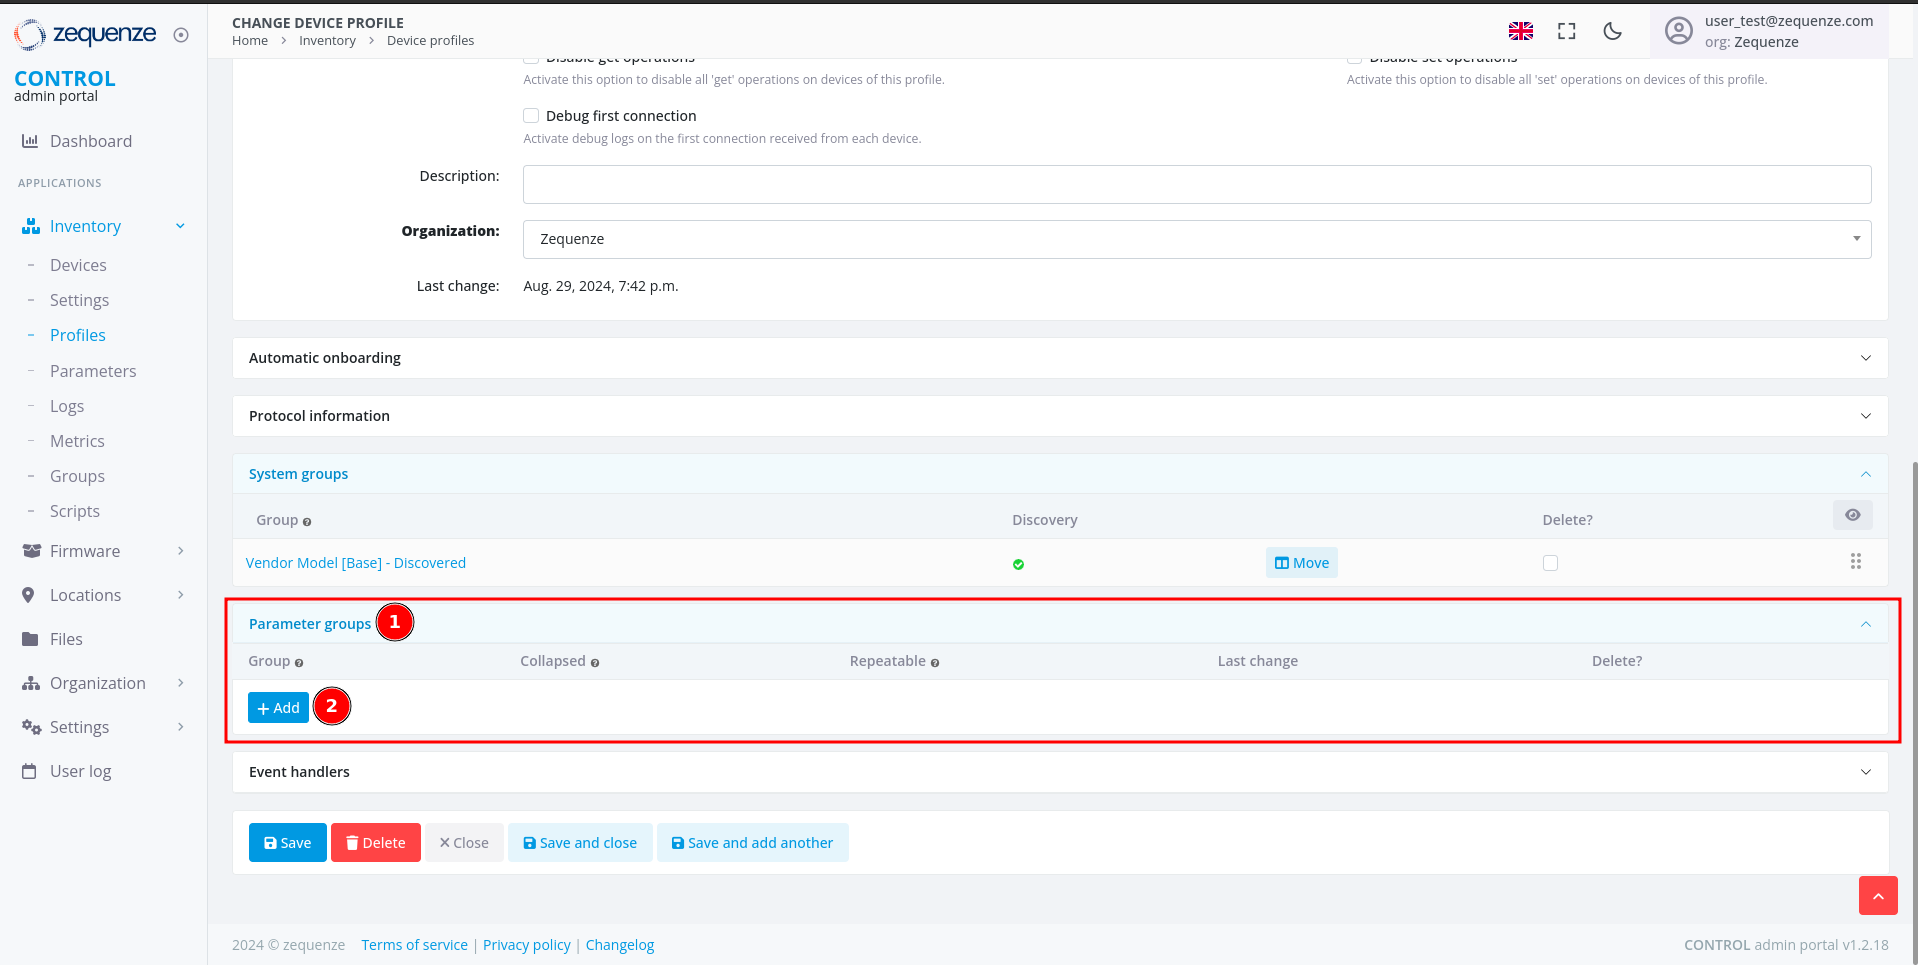 1. **Parameter groups** - This section allows you to create and organize parameter groups
2. **Add** - Click this button to create a new parameter group
### Step 2: Create a New Parameter Group
After clicking **Add**, you'll see the following interface:
1. **Parameter groups** - This section allows you to create and organize parameter groups
2. **Add** - Click this button to create a new parameter group
### Step 2: Create a New Parameter Group
After clicking **Add**, you'll see the following interface:
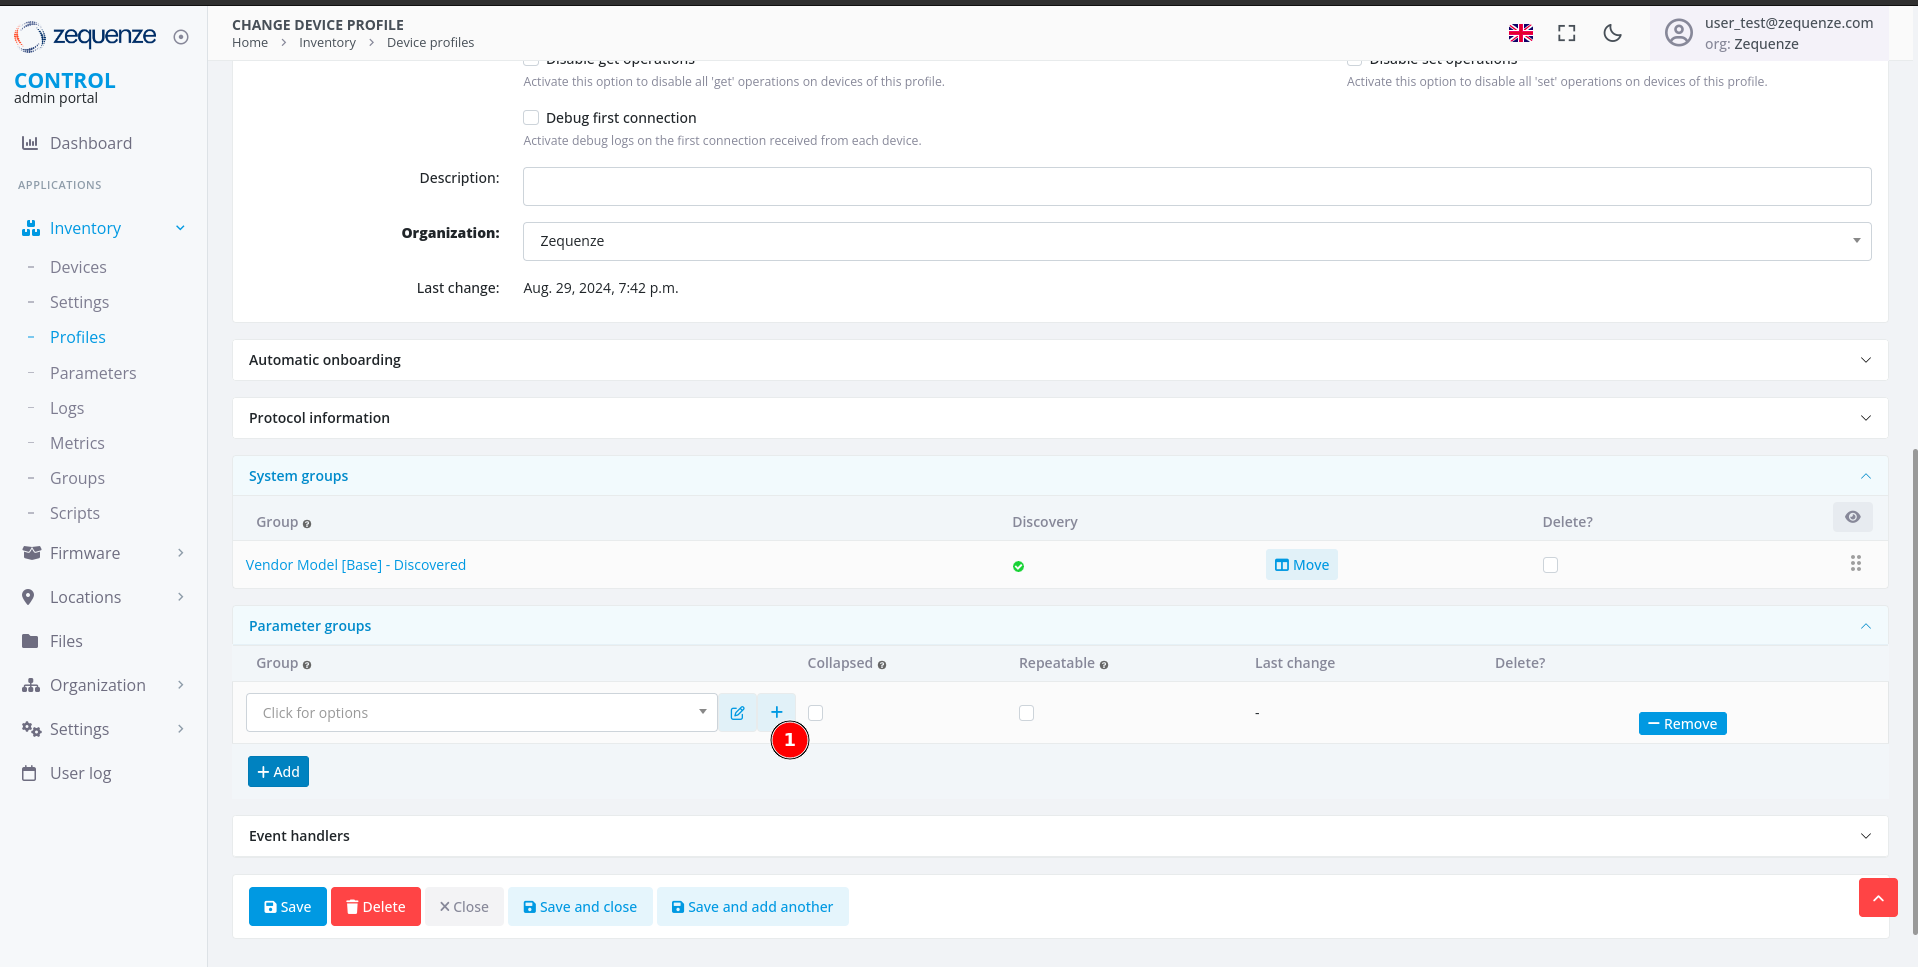 1. Click the **+** icon to open the parameter group configuration window
### Step 3: Configure the Parameter Group
A new window will open where you can configure your parameter group:
1. Click the **+** icon to open the parameter group configuration window
### Step 3: Configure the Parameter Group
A new window will open where you can configure your parameter group:
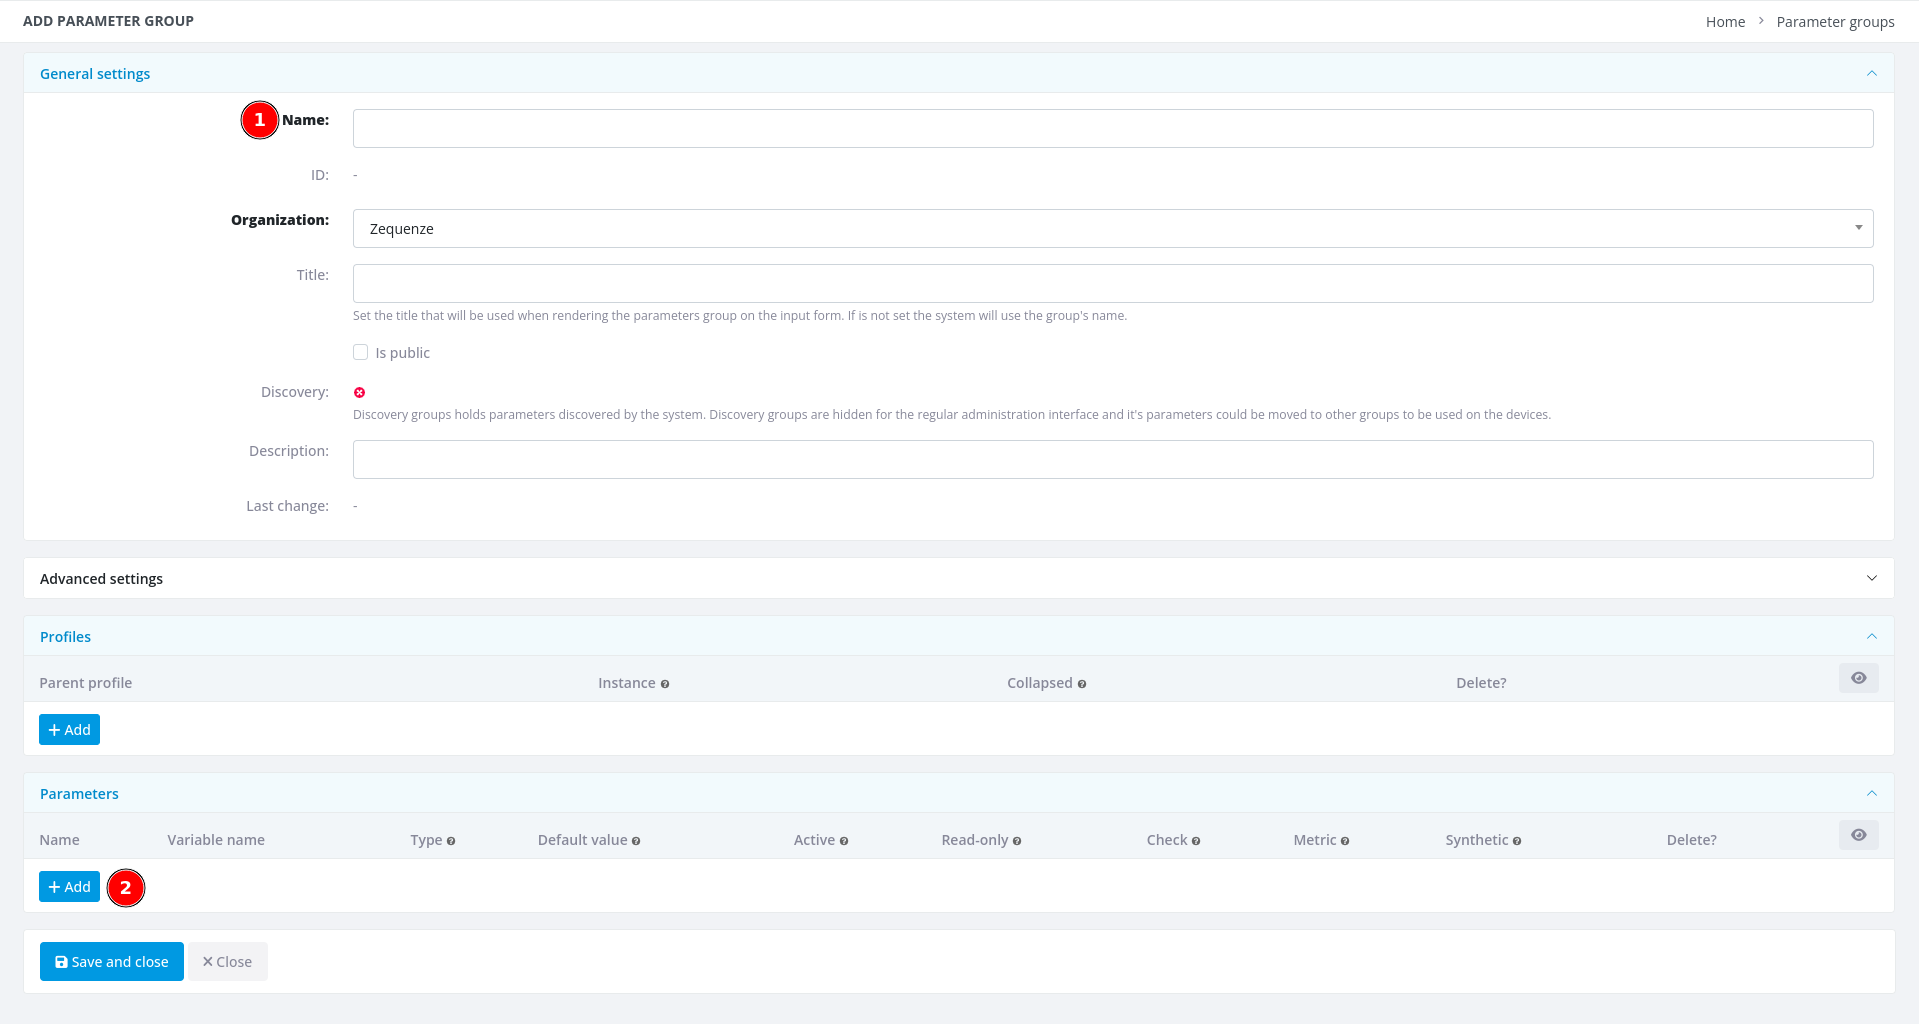 1. **Name** - Enter a descriptive name for this group (e.g., **"Model | Device Info"**)
2. **+ Add** - Click this button once for each parameter you want to add (in this example, we need 4 parameters)
### Step 4: Add Parameter Details
1. **Name** - Enter a descriptive name for this group (e.g., **"Model | Device Info"**)
2. **+ Add** - Click this button once for each parameter you want to add (in this example, we need 4 parameters)
### Step 4: Add Parameter Details
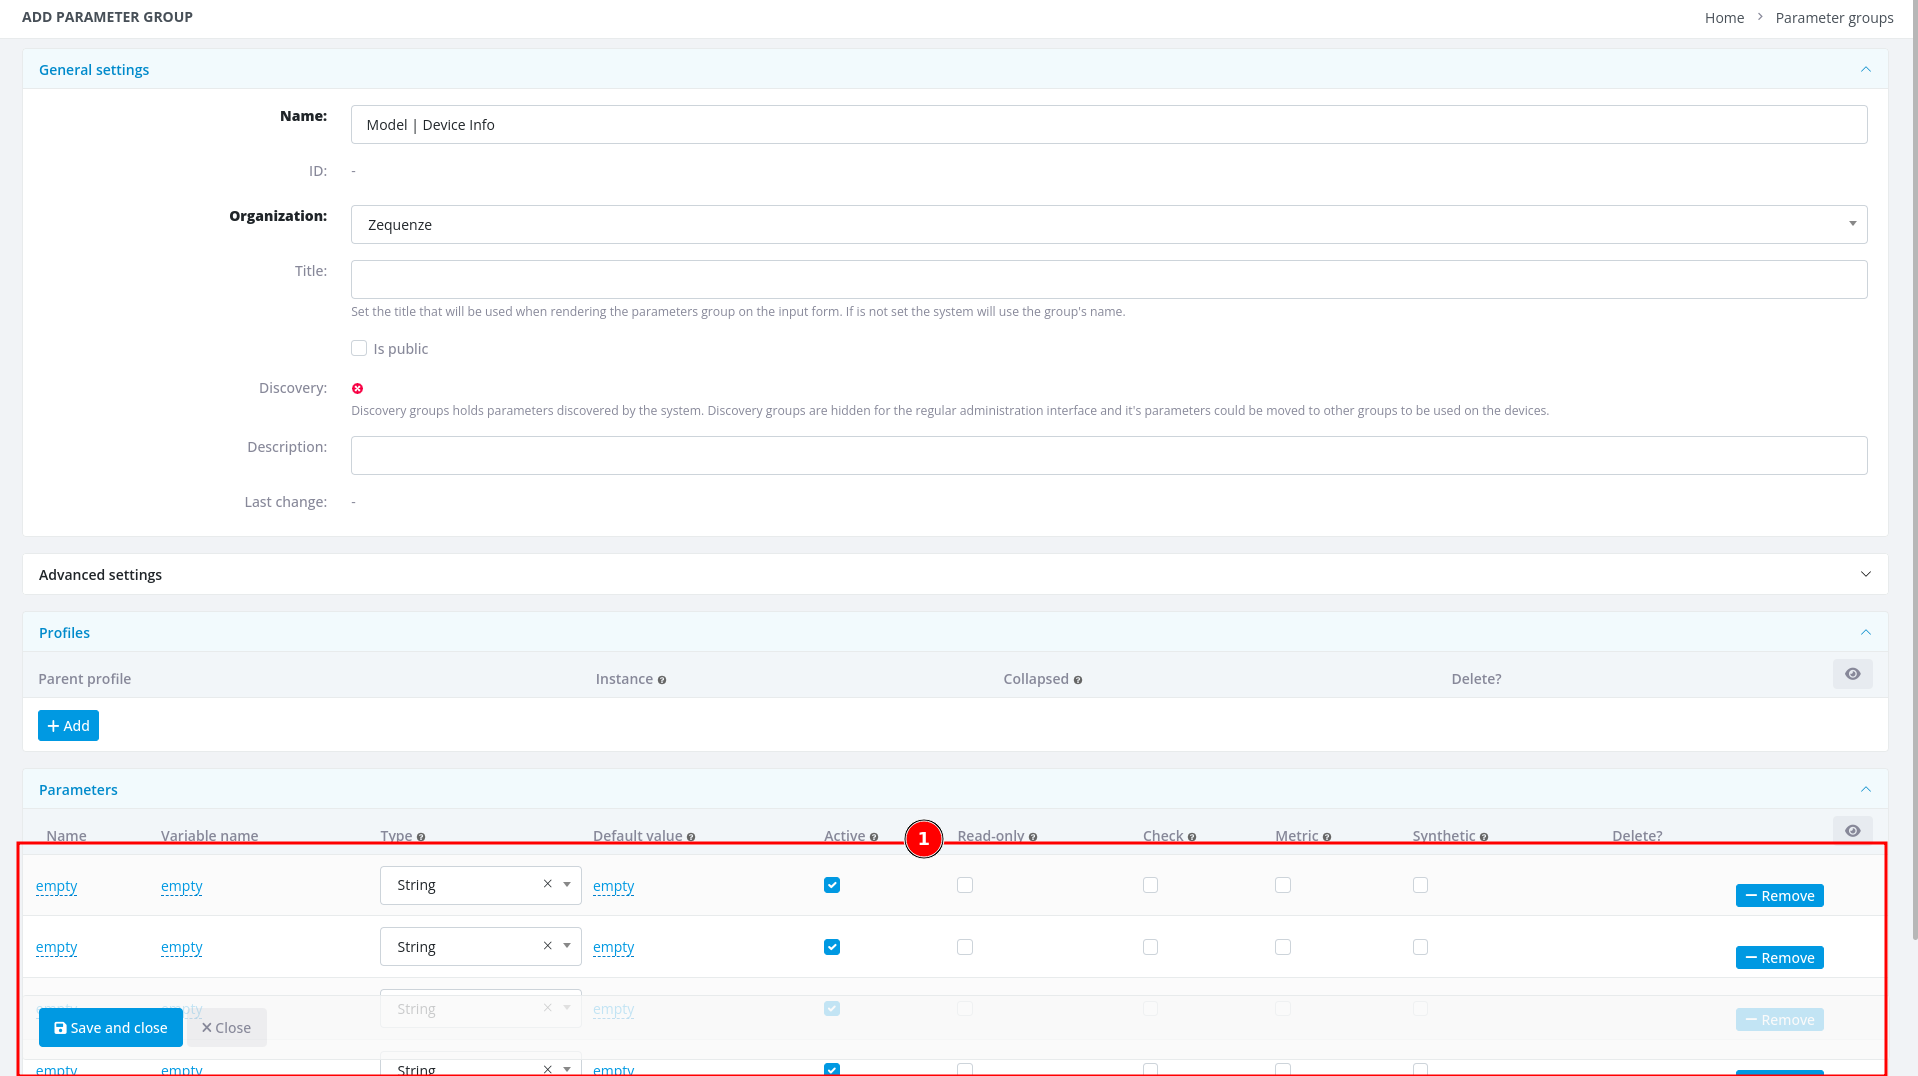 1. After entering the group name and adding 4 parameter slots, you're ready to fill in the parameter details
Now transfer the parameter information from your Excel or LibreOffice Calc spreadsheet into CONTROL:
1. After entering the group name and adding 4 parameter slots, you're ready to fill in the parameter details
Now transfer the parameter information from your Excel or LibreOffice Calc spreadsheet into CONTROL:
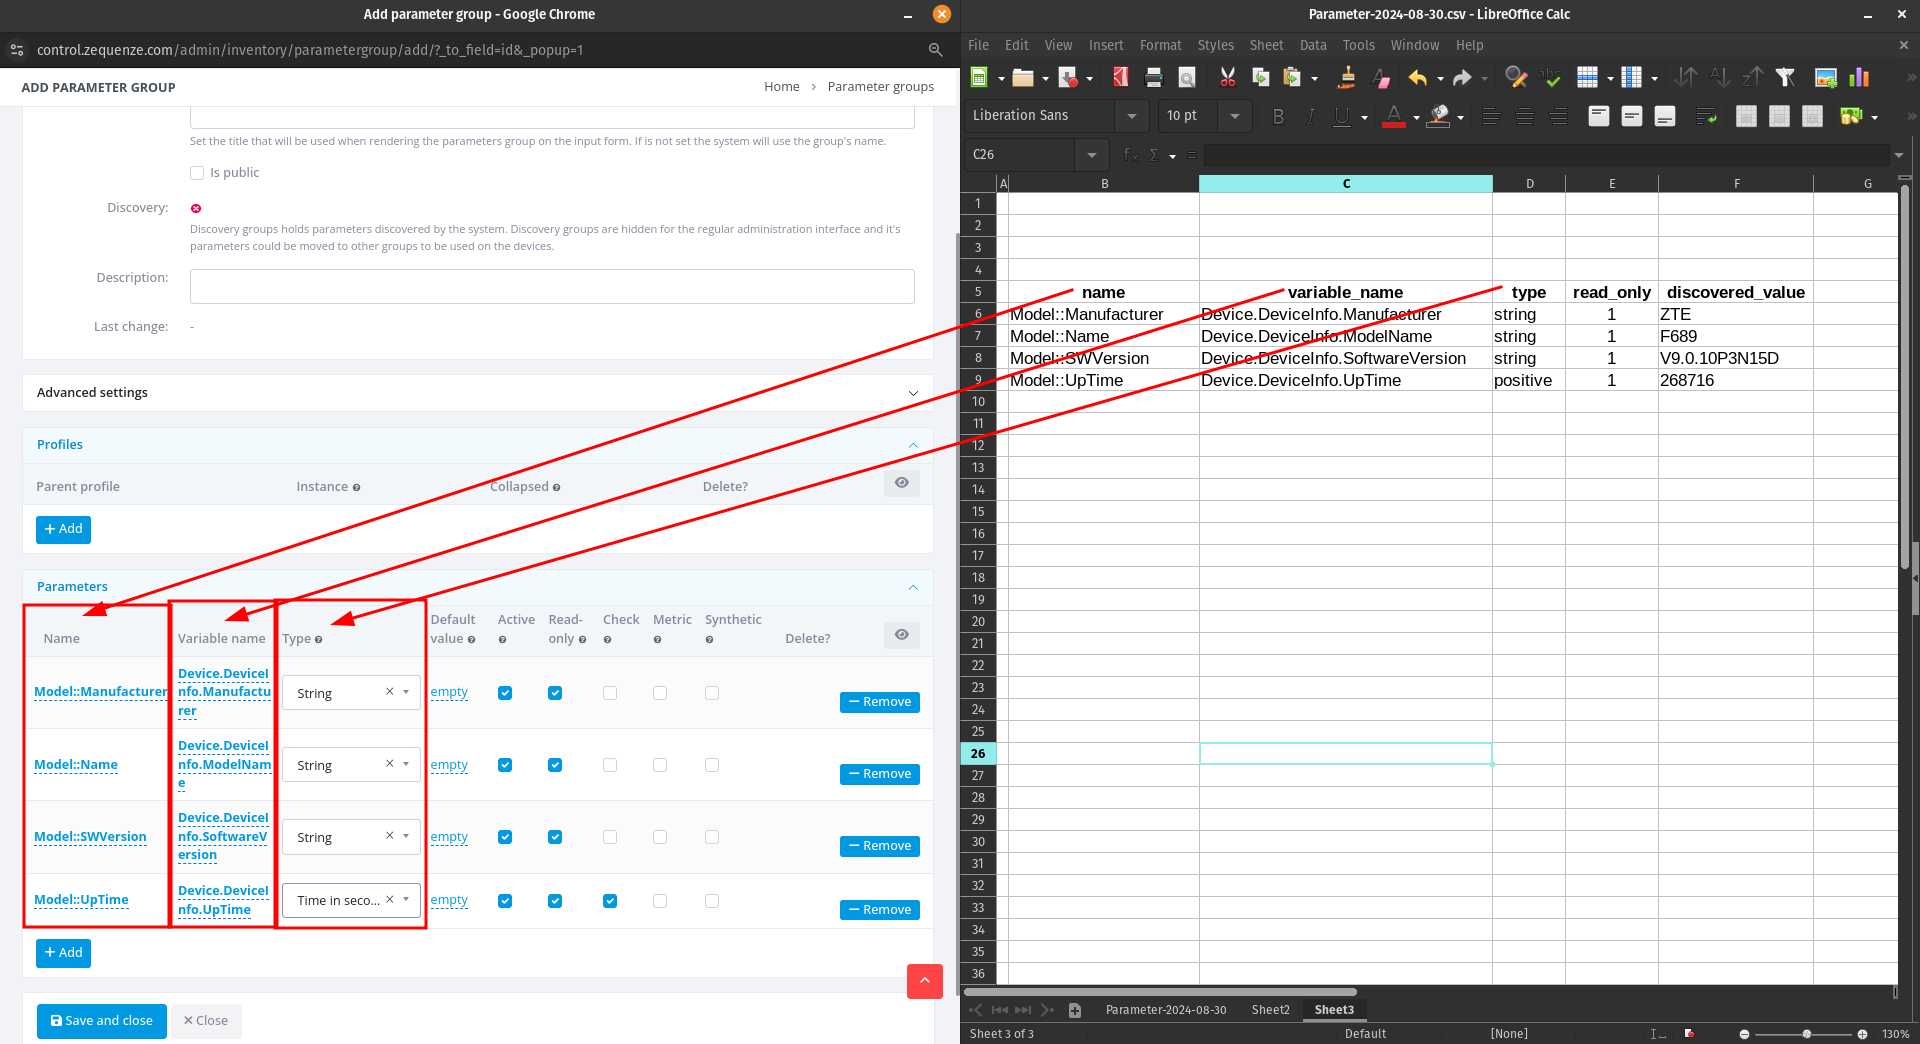 As you can see, there's now a clear correspondence between your spreadsheet and the CONTROL interface. When you've finished entering all parameters, click **"Save and close"**.
### Step 5: Save the Parameter Group
You'll now see your newly created parameter group:
As you can see, there's now a clear correspondence between your spreadsheet and the CONTROL interface. When you've finished entering all parameters, click **"Save and close"**.
### Step 5: Save the Parameter Group
You'll now see your newly created parameter group:
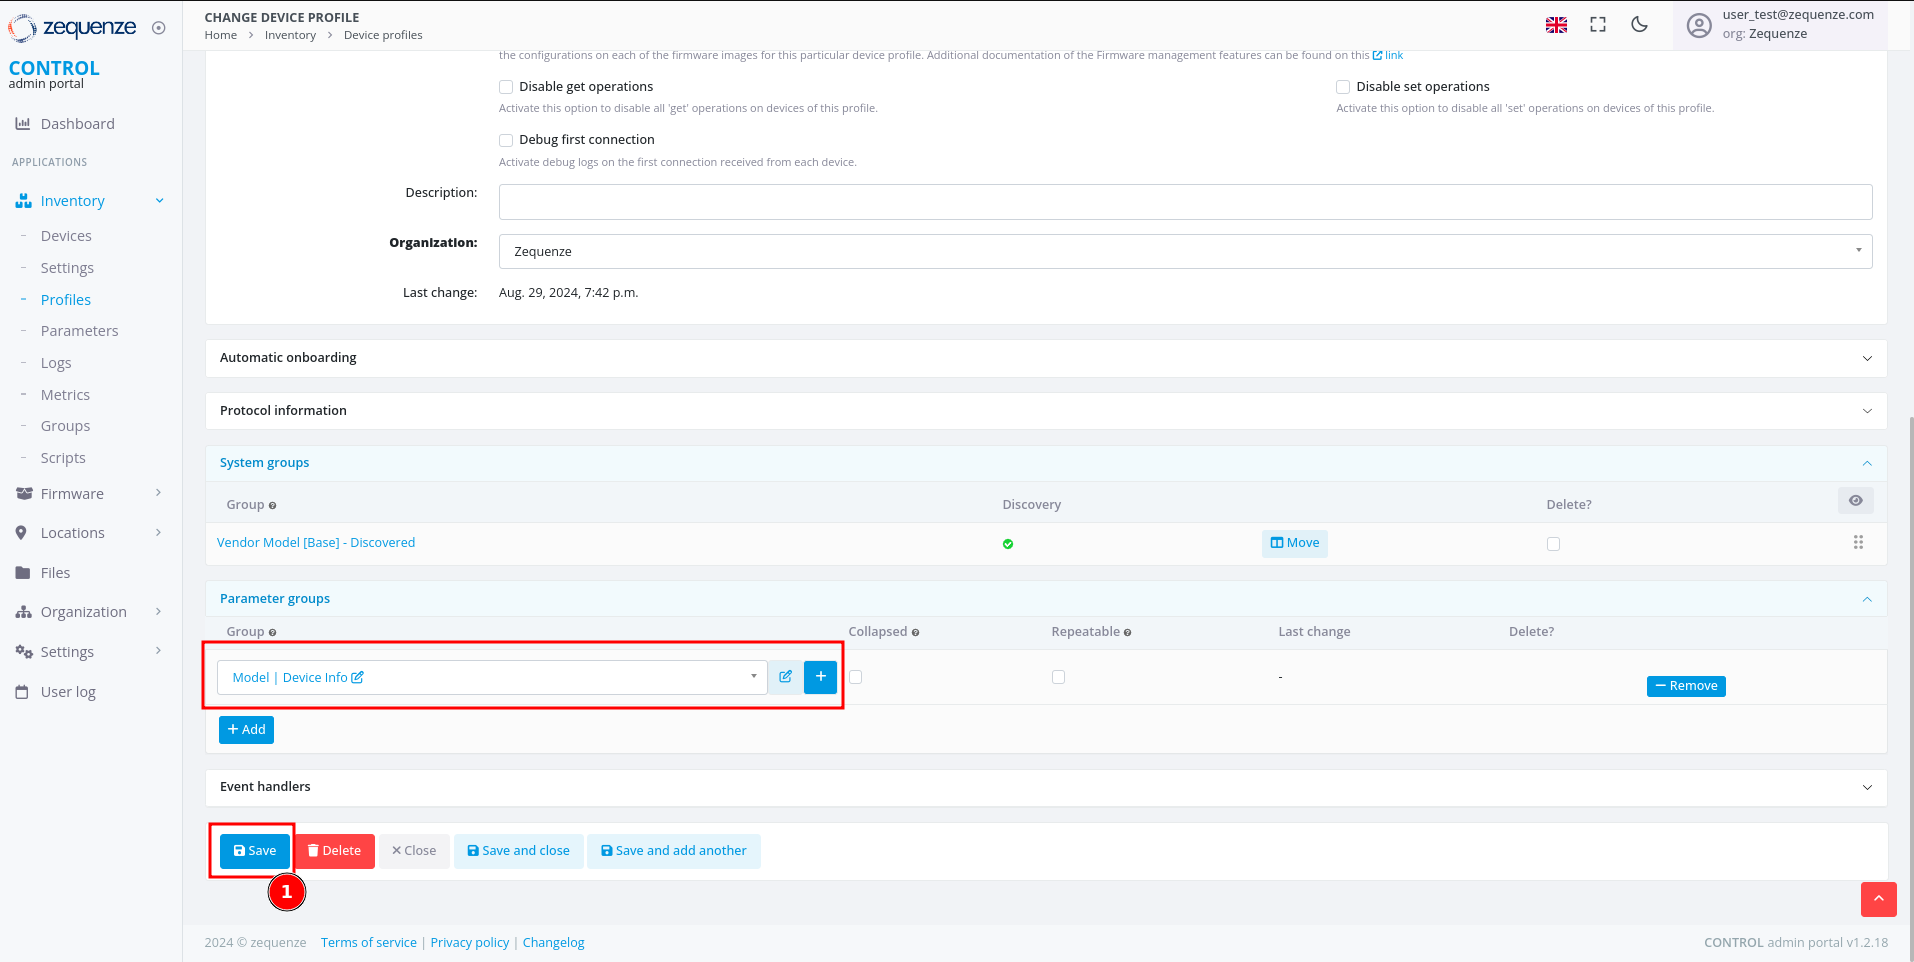 1. Click the **Save** button to save your changes to the profile
After saving, you'll see the organization name displayed in the parameter groups section:
1. Click the **Save** button to save your changes to the profile
After saving, you'll see the organization name displayed in the parameter groups section:
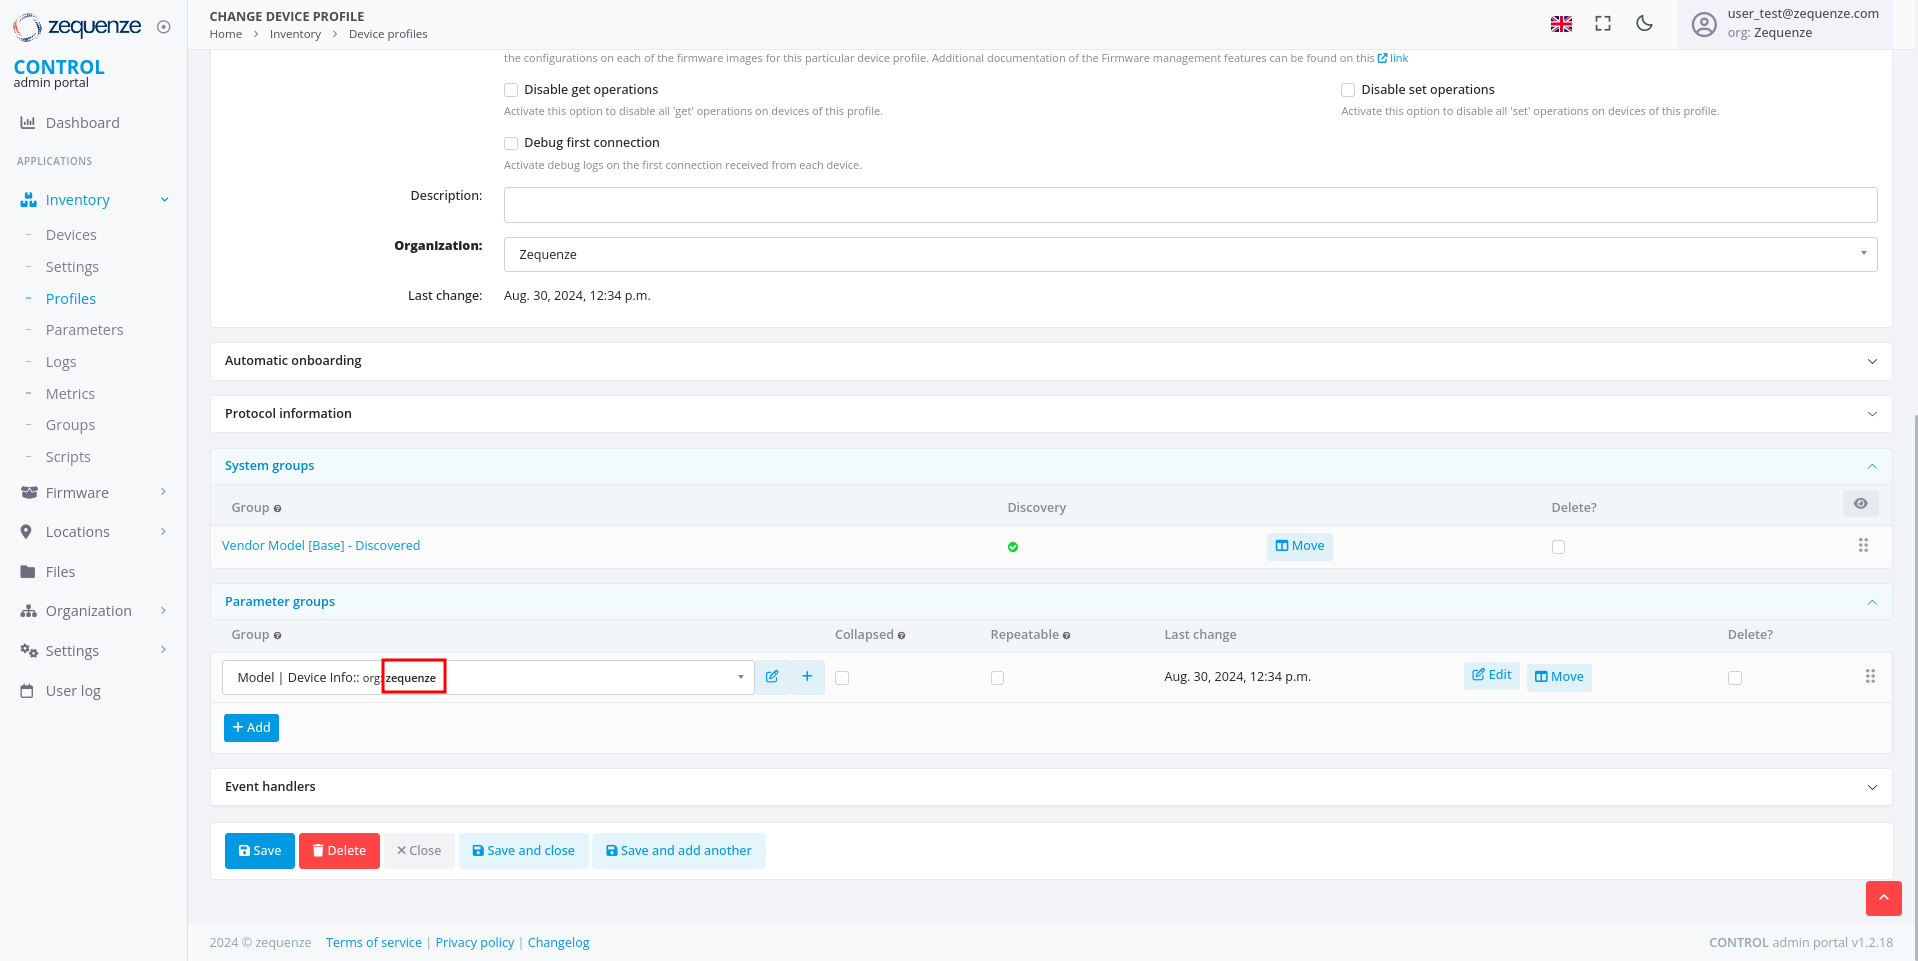 You can repeat this process to add additional parameter groups or parameters as needed.
---
## View Parameters on a Device
Now that you've configured your parameter groups, let's verify that they appear correctly on the device page.
### Step 1: Navigate to the Device
You can repeat this process to add additional parameter groups or parameters as needed.
---
## View Parameters on a Device
Now that you've configured your parameter groups, let's verify that they appear correctly on the device page.
### Step 1: Navigate to the Device
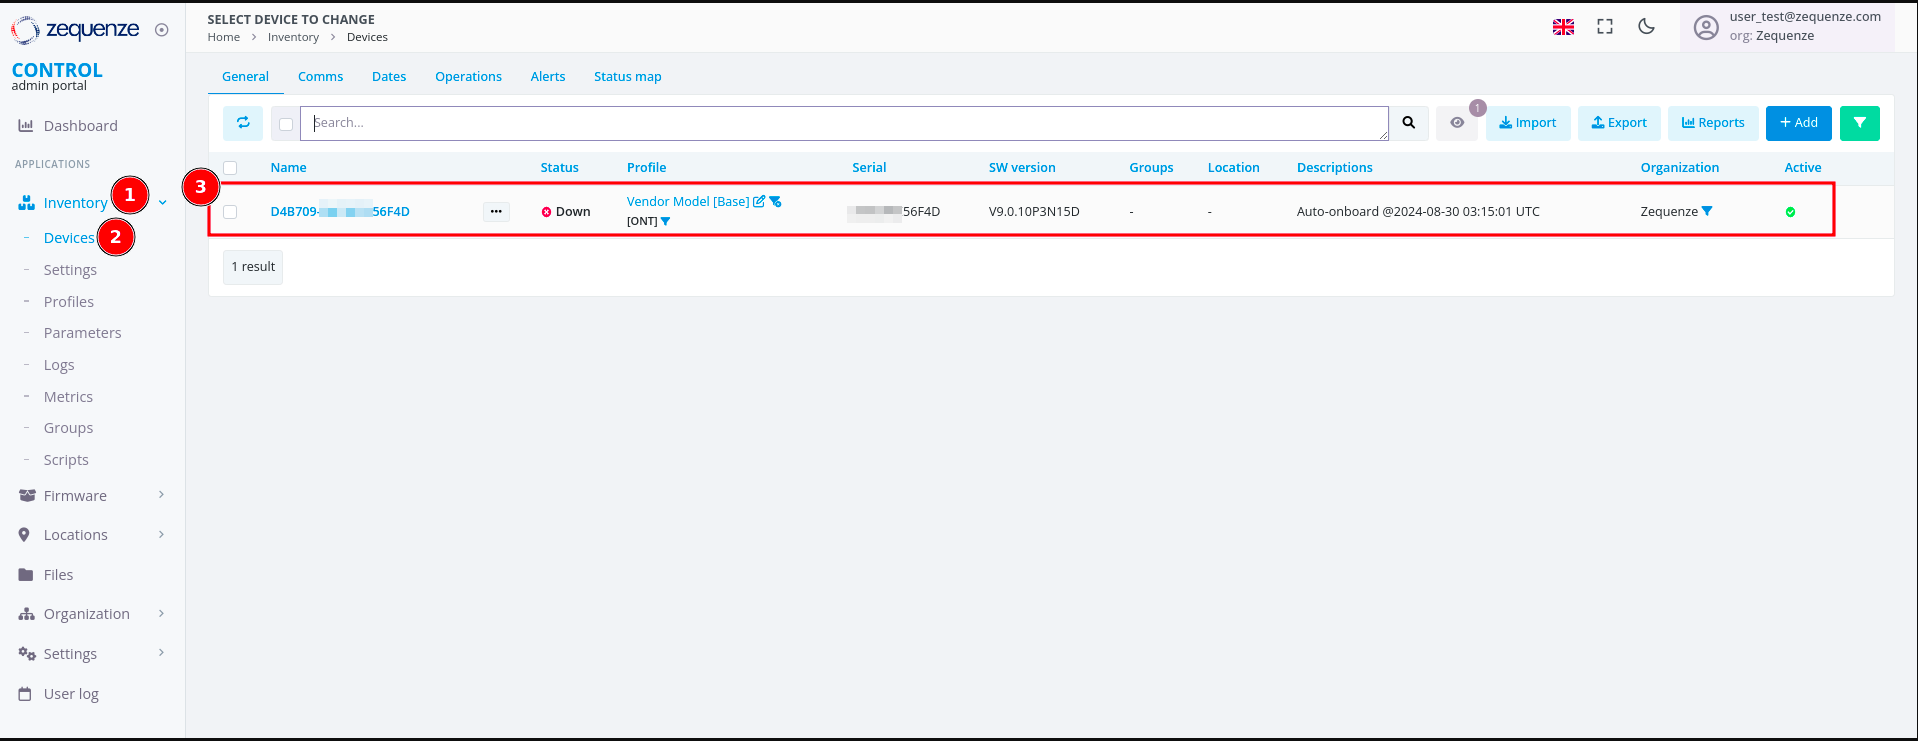 1. Click on **Inventory**
2. Select **Devices**
3. You'll see your previously connected devices. In this screenshot, the device shows as **Down** because it was powered off for this demonstration
Click on the device name to view its details:
1. Click on **Inventory**
2. Select **Devices**
3. You'll see your previously connected devices. In this screenshot, the device shows as **Down** because it was powered off for this demonstration
Click on the device name to view its details:
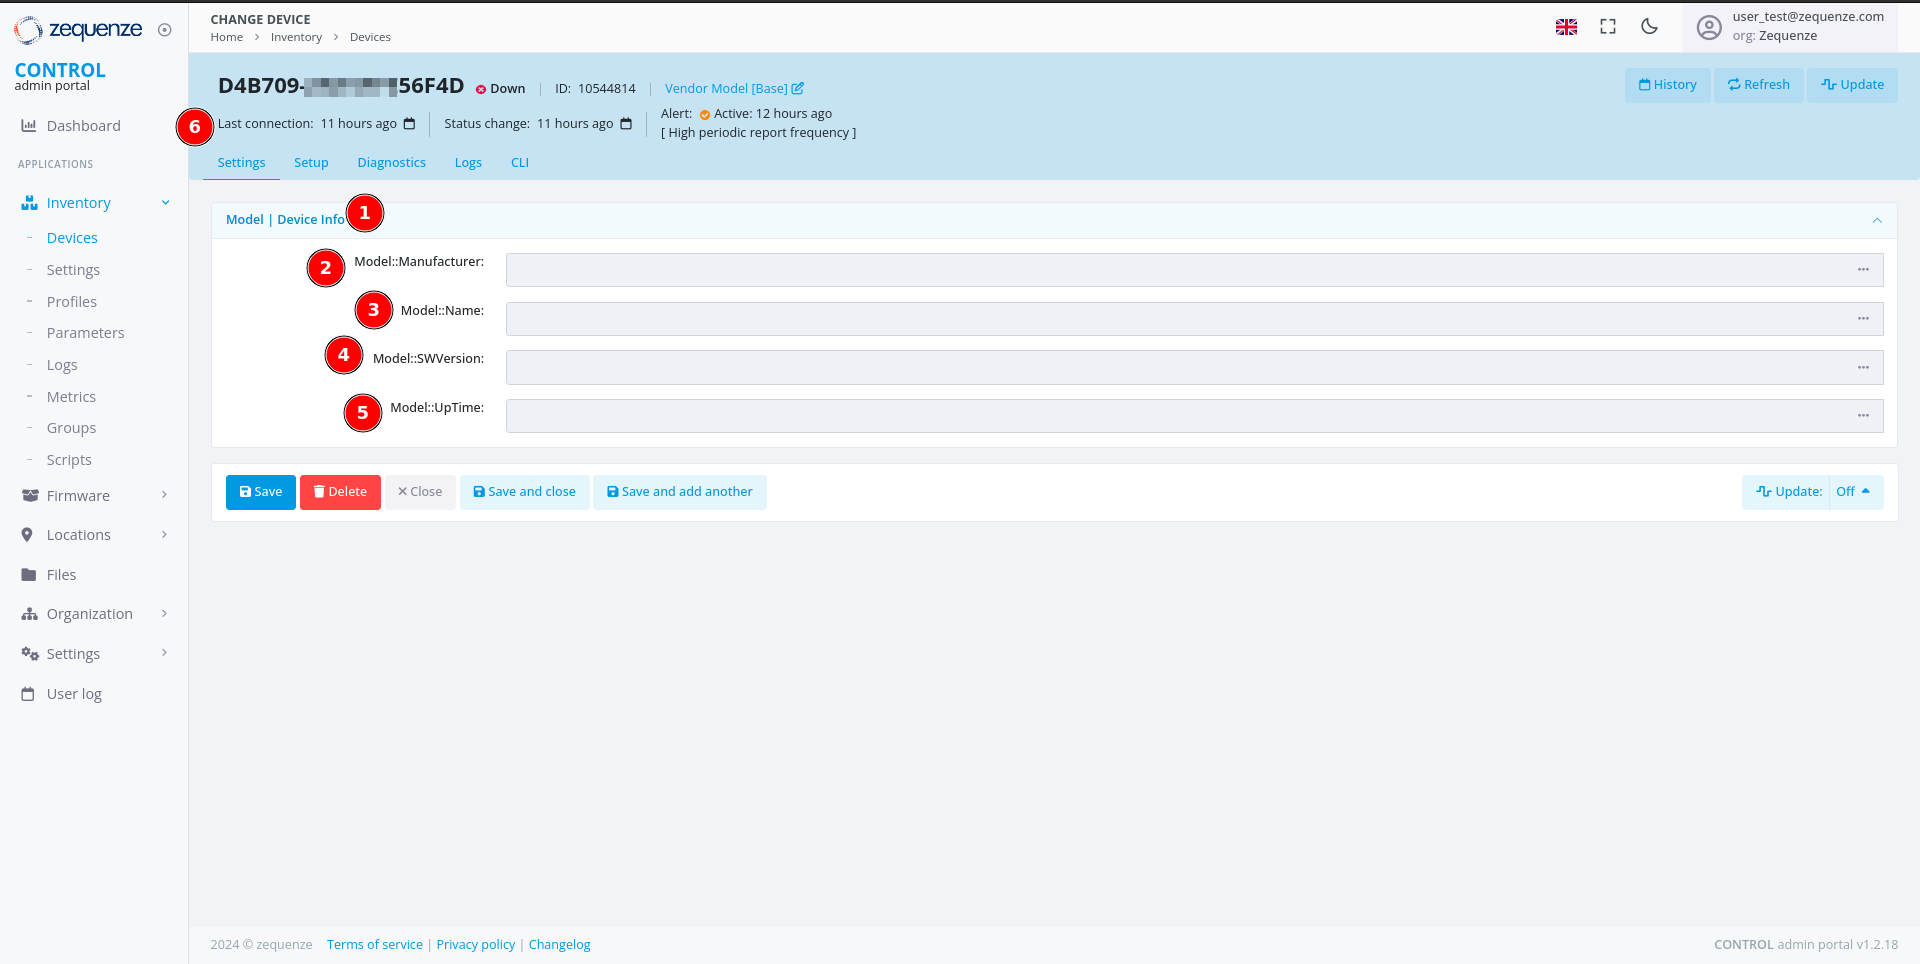 On the device page, you can now see:
1. The parameter group name you created
2. The first parameter: **"Model::Manufacturer"**
3. The second parameter: **"Model::Name"**
4. The third parameter: **"Model::SWVersion"**
5. The fourth parameter: **"Model::UpTime"**
6. The **Last connection** timestamp for this device in CONTROL
### Step 2: Wait for Parameter Values
It's normal for the parameter values to be empty at this stage. CONTROL will request and populate these values once the device connects to the platform.
After connecting the device:
On the device page, you can now see:
1. The parameter group name you created
2. The first parameter: **"Model::Manufacturer"**
3. The second parameter: **"Model::Name"**
4. The third parameter: **"Model::SWVersion"**
5. The fourth parameter: **"Model::UpTime"**
6. The **Last connection** timestamp for this device in CONTROL
### Step 2: Wait for Parameter Values
It's normal for the parameter values to be empty at this stage. CONTROL will request and populate these values once the device connects to the platform.
After connecting the device:
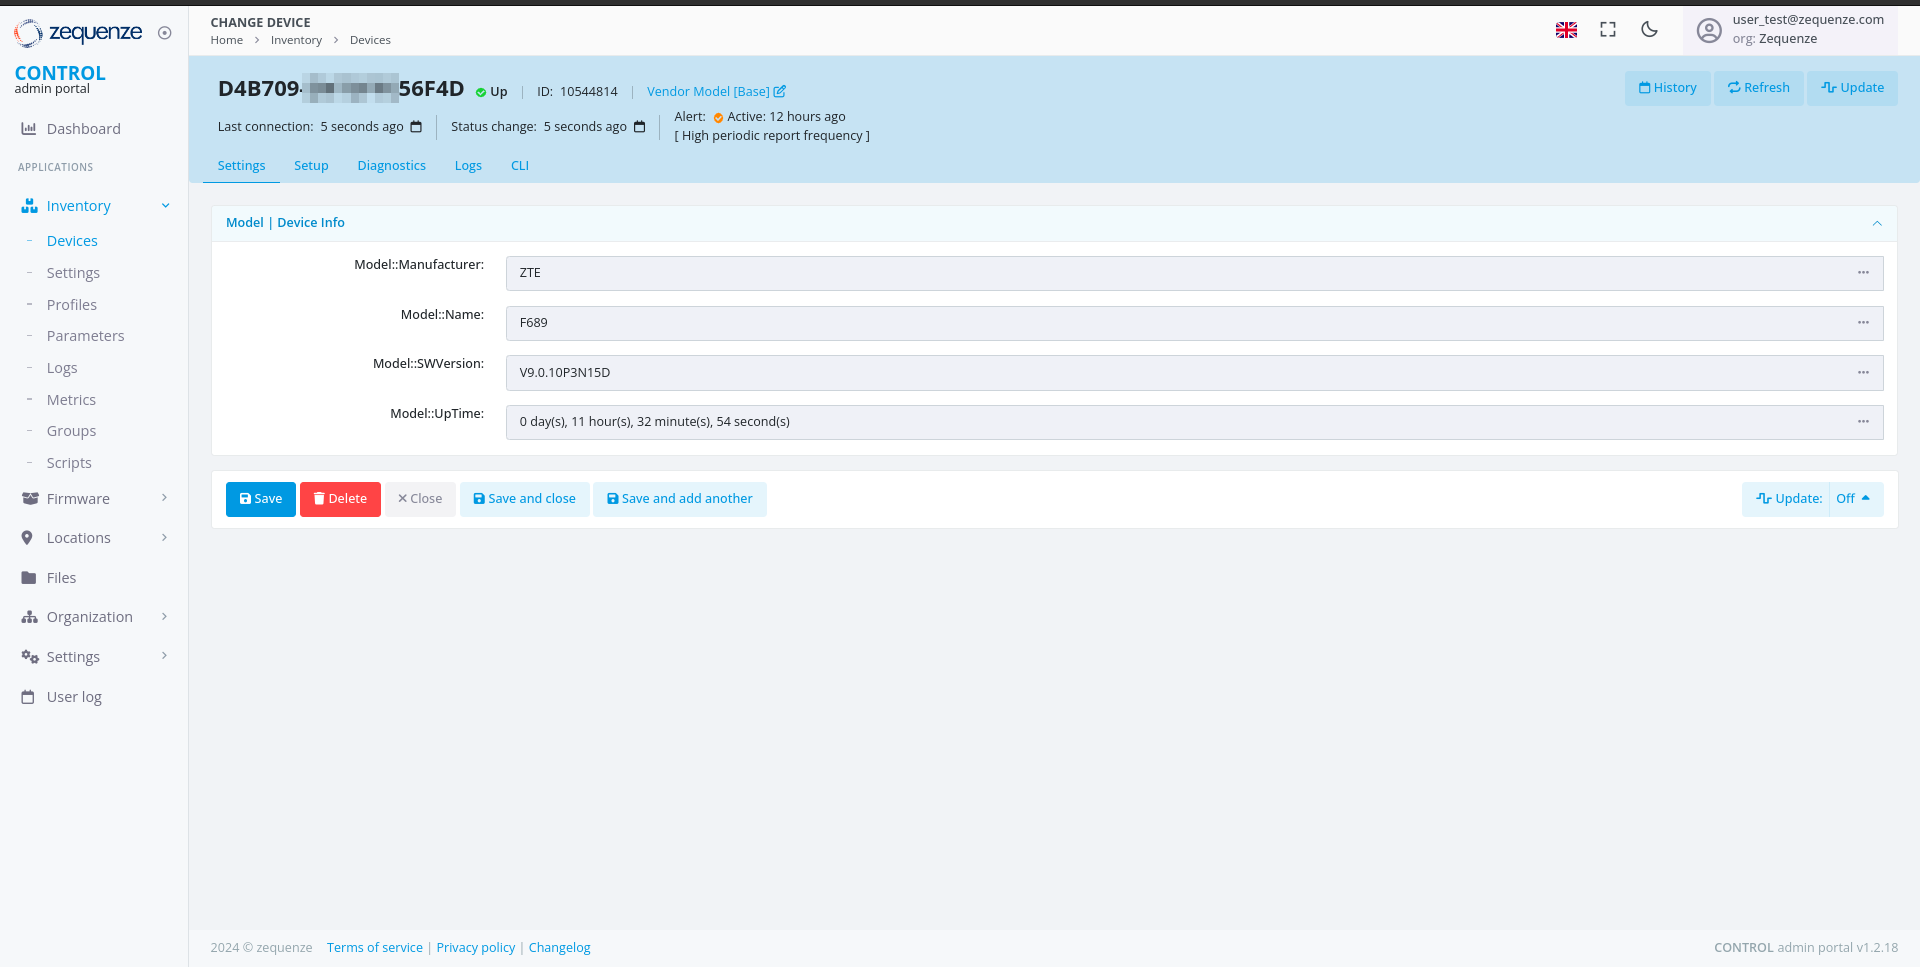 The parameter values are automatically retrieved and displayed once the device establishes a connection to CONTROL.
You can now create additional parameter groups or add more parameters to existing groups as needed for your deployment.
# User Groups and Permissions Guide
## Overview
The CONTROL platform implements a **role-based access control (RBAC)** system to manage user permissions and data access. Access control is organized through **Groups** — collections of permissions that define which modules, actions, and data a user can access within the platform.
Users can be assigned to **multiple groups simultaneously**, and their effective permissions represent the **union** of all permissions from their assigned groups. This flexible approach allows organizations to create precise permission sets that match their operational roles and security requirements.
### Key Concepts
| Concept | Description |
|---------|-------------|
| **Group** | A named collection of permissions. Users automatically inherit all permissions from their assigned groups. |
| **Permission** | A specific action allowed on a specific resource (e.g., "Can view device", "Can change parameter"). |
| **Organization** | Users can only access data belonging to their organization and its sub-organizations. This organizational boundary is enforced independently of group permissions. |
| **Expert Mode** | An optional toggle that reveals advanced features and configuration options for experienced users. Requires assignment to the "Users: Expert mode" group. |
## Available Groups
The CONTROL platform provides standard groups organized by platform module and access level. These groups cover all core functionality areas:
| Group Name | Module | Access Level |
|-----------|--------|-------------|
| CONTROL account admins | CONTROL | Administration |
| CONTROL API Logs read-only | CONTROL | Read-only |
| CONTROL inventory admins | CONTROL | Administration |
| CONTROL inventory basic users | CONTROL | Basic |
| CONTROL inventory read-only basic users | CONTROL | Read-only (basic) |
| CONTROL inventory read-only users | CONTROL | Read-only |
| CONTROL inventory scripting | CONTROL | Specialized |
| CONTROL inventory users | CONTROL | Standard |
| CONTROL portal admins | CONTROL | Administration |
| Link admin users | Link | Administration |
| Link read-only users | Link | Read-only |
| SecureDNS admins | SecureDNS | Administration |
| SecureDNS reports | SecureDNS | Read-only |
| SONDA admins | SONDA | Administration |
| SONDA reports | SONDA | Read-only |
| Users | General | Basic |
| Users: Expert mode | General | Specialized |
## Detailed Group Descriptions
### CONTROL Account Administration
#### CONTROL account admins
**Description:** CONTROL account administration access.
**Purpose:** Grants administrative control over account-level configuration of the CONTROL platform, including device profile management, parameter configuration, and service settings.
**Key Capabilities:**
| Area | Permissions |
|------|------------|
| **Device Profiles (Types)** | View, edit, and delete device profiles — the templates that define how the platform communicates with specific CPE device models. |
| **Parameters & Groups** | View, edit, and delete parameters and parameter groups — the configuration variables used by services (WiFi Analytics, throughput tests, etc.). |
| **Lists & Options** | View, edit, and delete list groups — dropdown/selection options used in service configuration. |
| **WiFi Remediation** | View remediation policies and manage remediation logs — automatic WiFi optimization actions. |
| **Task Scheduler** | View failed tasks and manage successful tasks in the background task queue. |
| **SecureDNS** | Add and edit DNS categories; view DNS transaction logs. |
| **Service Settings** | View extended service settings. |
| **Revision History** | Edit revision entries (audit log management). |
**Recommended For:** Platform administrators responsible for configuring device profiles and service parameters.
### CONTROL API Access
#### CONTROL API Logs read-only
**Description:** CONTROL read-only API Logs.
**Purpose:** Provides read-only access to API activity logs, enabling monitoring and auditing of all API transactions made to and from the platform.
**Key Capabilities:**
| Area | Permissions |
|------|------------|
| **API Methods** | View available API methods and their configurations. |
| **API Transaction Logs** | View API transaction logs — records of all API calls made to/from the platform including request/response details. |
| **API Transaction Details** | View detailed information for individual API transactions. |
**Recommended For:** Operations staff, auditors, and support teams who need to monitor API activity for troubleshooting or compliance purposes.
### CONTROL Inventory Management
#### CONTROL inventory admins
**Description:** CONTROL — inventory administration access.
**Purpose:** Full administrative access to the device inventory system, including device management, service configuration, reporting, and system tools.
**Key Capabilities:**
| Area | Permissions |
|------|------------|
| **Devices** | Add, edit, and view devices in the inventory. Manage device settings. |
| **Service Configuration** | Full CRUD on parameters, parameter groups, lists, list groups, and service classes — the building blocks of all services. |
| **Schedules & Scripts** | Create and manage inventory schedules and view script logs. |
| **Reports & Dashboards** | View dashboards. Manage report cache data. |
| **Locations** | Add locations and manage location groups. |
| **Portal** | View and manage portal profiles and templates. |
| **Performance Profiler** | Access the SQL query profiler for performance analysis. |
| **User Management** | Manage content types, permissions, user profiles, and sessions. |
| **Data Replication** | Full control over database replication processes. |
| **WiFi Analytics** | Manage WiFi remediation logs; view remediation policies. |
| **SecureDNS** | Manage categories, view rules and transaction logs. |
| **Validators** | Manage validation rules used by parameters. |
**Recommended For:** Senior administrators and engineering staff who need full control over the inventory and service configuration.
#### CONTROL inventory users
**Description:** CONTROL — inventory regular user access.
**Purpose:** Standard operational access to the device inventory, including device management, parameter editing, and report creation. This is the primary group for day-to-day operations.
**Key Capabilities:**
| Area | Permissions |
|------|------------|
| **Custom Reports** | Create custom reports for personal use. |
| **Dashboards** | Create new dashboards and manage elements. |
| **Service Configuration** | Full CRUD on parameters, lists, and validators — configure service behavior for devices. |
| **Device Settings** | Delete device settings (data cleanup). |
| **Group Variables** | Add group variables for device group configurations. |
| **Combined Logs** | Access combined device log views. |
| **Portal Templates** | Delete portal templates. |
**Recommended For:** NOC operators, field engineers, and support staff who actively manage devices and service configurations.
#### CONTROL inventory basic users
**Description:** CONTROL — inventory basic user access.
**Purpose:** Limited access for users who need to perform basic inventory operations such as creating custom reports and managing specific settings.
**Key Capabilities:**
| Area | Permissions |
|------|------------|
| **Custom Reports** | Create and delete custom reports — personal report configurations with saved filters. |
| **Dashboard Elements** | Remove dashboard widgets from personal views. |
| **Device Settings** | Delete device settings (cleanup operations). |
| **Parameters** | Delete parameters; view and change validators. |
| **Combined Logs** | Access to combined device logs view. |
**Recommended For:** Support staff who need basic report customization and limited inventory access.
#### CONTROL inventory read-only users
**Description:** CONTROL — inventory read-only access.
**Purpose:** Read-oriented access with the ability to create custom reports and dashboards for data visualization.
**Key Capabilities:**
| Area | Permissions |
|------|------------|
| **Custom Reports** | Create and delete custom reports. |
| **Dashboards** | Create dashboards and manage dashboard elements. |
| **Combined Logs** | Access combined device log views. |
| **Device Settings** | Delete device settings (for data cleanup). |
| **Validators** | Edit validator configurations. |
**Recommended For:** Monitoring staff and analysts who need to view inventory data and create custom visualizations.
#### CONTROL inventory read-only basic users
**Description:** CONTROL — inventory read-only basic access.
**Purpose:** Minimal access for users who primarily need to view data and create personal reports.
**Key Capabilities:**
| Area | Permissions |
|------|------------|
| **Custom Reports** | Create and delete custom reports for personal use. |
| **Dashboard Elements** | Add widgets to personal dashboard views. |
| **Validators** | Edit validator configurations. |
**Recommended For:** Users who need read-only access with the ability to create custom report views.
#### CONTROL inventory scripting
**Description:** CONTROL — inventory scripting management and execution.
**Purpose:** Access to script management and execution capabilities for automating device operations.
**Key Capabilities:**
| Area | Permissions |
|------|------------|
| **Scripts** | Execute and manage inventory scripts — automated procedures that run against devices (firmware upgrades, bulk configuration, diagnostics). |
| **Script Logs** | View execution logs and results from script runs. |
**Recommended For:** Operations engineers who need to run automated scripts against the device inventory.
### CONTROL Portal Management
#### CONTROL portal admins
**Description:** CONTROL — portal administration access.
**Purpose:** Administration of the CONTROL end-user portal — the customer-facing interface where end users can view their service status and device information.
**Key Capabilities:**
| Area | Permissions |
|------|------------|
| **Portal Pages** | Create, edit, and manage portal pages — the content displayed to end users. |
| **Portal Templates** | Design and manage page templates that control the portal's appearance. |
| **Portal Profiles** | Configure portal user profiles and access levels. |
| **Portal Services** | Manage which services are exposed through the portal. |
**Recommended For:** Staff responsible for managing and customizing the customer-facing portal.
### Link Management
#### Link admin users
**Description:** Link management application administration access.
**Purpose:** Full administrative access to the Link Management module — used for managing network link associations and interconnections between devices.
**Key Capabilities:**
| Area | Permissions |
|------|------------|
| **Links** | Create, edit, and delete network links and associations. |
| **Link Services** | Manage services associated with links. |
**Recommended For:** Network engineers managing device interconnections and link topology.
#### Link read-only users
**Description:** Link management application read-only access.
**Purpose:** View-only access to the Link Management module.
**Key Capabilities:**
| Area | Permissions |
|------|------------|
| **Links** | View network links and associations without the ability to modify them. |
**Recommended For:** Support staff who need visibility into network link topology without modification rights.
### SecureDNS
#### SecureDNS admins
**Description:** SecureDNS — administration access.
**Purpose:** Administrative access to the SecureDNS module — the DNS-based security filtering system that protects devices from malicious domains.
**Key Capabilities:**
| Area | Permissions |
|------|------------|
| **DNS Rules** | Create, edit, and delete DNS filtering rules — define which domains are blocked, allowed, or redirected. |
| **Categories** | Manage DNS categories (malware, phishing, adult content, etc.). |
| **Transaction Logs** | View DNS query logs and filtering statistics. |
| **Service Settings** | Manage SecureDNS service configuration. |
**Recommended For:** Security operations staff managing DNS-based protection policies.
#### SecureDNS reports
**Description:** SecureDNS — reports and transactions access.
**Purpose:** Read-only access to SecureDNS reporting and transaction data.
**Key Capabilities:**
| Area | Permissions |
|------|------------|
| **Reports** | View DNS filtering statistics, top blocked domains, category breakdowns, and response time metrics. |
| **Transaction Logs** | View DNS query logs to analyze filtering activity. |
**Recommended For:** Analysts and managers who need visibility into DNS security metrics without the ability to modify rules.
### SONDA (User Experience Monitoring)
#### SONDA admins
**Description:** SONDA / User experience — administration access.
**Purpose:** Administrative access to the SONDA module — the user experience monitoring system that runs automated tests (latency, jitter, throughput, WiFi quality) from probes and CPE devices.
**Key Capabilities:**
| Area | Permissions |
|------|------------|
| **Events** | View and delete events — automated alerts triggered by test results exceeding thresholds. |
| **Event Patterns** | Create event patterns — define which conditions trigger automated alerts. |
| **Event Origins** | Manage event origins — configure the sources (probes, devices) that generate events. |
| **Event Logs** | Add detailed event log entries. |
| **Test Profiles** | Configure test profiles that define which tests run on which schedules. |
| **Test Services** | Manage test service definitions (ping, throughput, WiFi analytics, etc.). |
**Recommended For:** Engineers configuring automated quality of experience (QoE) monitoring and alert thresholds.
#### SONDA reports
**Description:** SONDA / User experience — reports and transactions access.
**Purpose:** Read-only access to SONDA test results, metrics, and event data.
**Key Capabilities:**
| Area | Permissions |
|------|------------|
| **Event Logs** | View and edit event log entries. |
| **Event Origins** | View and edit event origin configurations. |
| **Test Results** | View test results — latency, jitter, throughput, WiFi scores, and other QoE metrics collected from probes and devices. |
| **Reports** | Access SONDA dashboards and metric reports. |
**Recommended For:** Operators and analysts monitoring service quality metrics.
### General User Access
#### Users
**Description:** Regular users — access to user's profile, change password operations, etc.
**Purpose:** Minimal access for basic user self-service operations.
**Key Capabilities:**
| Area | Permissions |
|------|------------|
| **User Profile** | View own user profile and personal information. |
| **Password** | Change own password. |
| **Site Settings** | View basic site configuration. |
**Recommended For:** Users who only need to manage their own account, such as portal-only users or external collaborators with limited access.
#### Users: Expert mode
**Description:** Expert mode users — users that can activate the "Expert Mode" option in admin interfaces.
**Purpose:** Enables the "Expert Mode" toggle in the admin interface. When activated, Expert Mode reveals advanced fields, options, and actions that are hidden by default to prevent accidental changes.
**Key Capabilities:**
| Area | Permissions |
|------|------------|
| **Expert Mode Toggle** | Access to the Expert Mode switch in the admin interface. When activated, shows advanced fields in device profiles, parameters, services, and other admin forms. |
| **Configuration Profiles** | Create new configuration profiles — advanced device provisioning templates. |
| **Advanced Actions** | In Expert Mode, additional actions become available on models that normally restrict certain operations (e.g., audit records, firmware logs). |
**Recommended For:** Senior engineers and administrators who need access to advanced configuration options. This group should be assigned selectively to users who understand the implications of advanced configuration changes.
## Recommended Group Combinations by Role
Users are typically assigned **combinations of groups** that together define their operational role. The following combinations provide templates for common organizational roles:
### Monitoring and Read-Only Roles
| Role | Recommended Groups | Description |
|------|-------------------|-------------|
| **Basic Monitoring** | • CONTROL API Logs read-only
The parameter values are automatically retrieved and displayed once the device establishes a connection to CONTROL.
You can now create additional parameter groups or add more parameters to existing groups as needed for your deployment.
# User Groups and Permissions Guide
## Overview
The CONTROL platform implements a **role-based access control (RBAC)** system to manage user permissions and data access. Access control is organized through **Groups** — collections of permissions that define which modules, actions, and data a user can access within the platform.
Users can be assigned to **multiple groups simultaneously**, and their effective permissions represent the **union** of all permissions from their assigned groups. This flexible approach allows organizations to create precise permission sets that match their operational roles and security requirements.
### Key Concepts
| Concept | Description |
|---------|-------------|
| **Group** | A named collection of permissions. Users automatically inherit all permissions from their assigned groups. |
| **Permission** | A specific action allowed on a specific resource (e.g., "Can view device", "Can change parameter"). |
| **Organization** | Users can only access data belonging to their organization and its sub-organizations. This organizational boundary is enforced independently of group permissions. |
| **Expert Mode** | An optional toggle that reveals advanced features and configuration options for experienced users. Requires assignment to the "Users: Expert mode" group. |
## Available Groups
The CONTROL platform provides standard groups organized by platform module and access level. These groups cover all core functionality areas:
| Group Name | Module | Access Level |
|-----------|--------|-------------|
| CONTROL account admins | CONTROL | Administration |
| CONTROL API Logs read-only | CONTROL | Read-only |
| CONTROL inventory admins | CONTROL | Administration |
| CONTROL inventory basic users | CONTROL | Basic |
| CONTROL inventory read-only basic users | CONTROL | Read-only (basic) |
| CONTROL inventory read-only users | CONTROL | Read-only |
| CONTROL inventory scripting | CONTROL | Specialized |
| CONTROL inventory users | CONTROL | Standard |
| CONTROL portal admins | CONTROL | Administration |
| Link admin users | Link | Administration |
| Link read-only users | Link | Read-only |
| SecureDNS admins | SecureDNS | Administration |
| SecureDNS reports | SecureDNS | Read-only |
| SONDA admins | SONDA | Administration |
| SONDA reports | SONDA | Read-only |
| Users | General | Basic |
| Users: Expert mode | General | Specialized |
## Detailed Group Descriptions
### CONTROL Account Administration
#### CONTROL account admins
**Description:** CONTROL account administration access.
**Purpose:** Grants administrative control over account-level configuration of the CONTROL platform, including device profile management, parameter configuration, and service settings.
**Key Capabilities:**
| Area | Permissions |
|------|------------|
| **Device Profiles (Types)** | View, edit, and delete device profiles — the templates that define how the platform communicates with specific CPE device models. |
| **Parameters & Groups** | View, edit, and delete parameters and parameter groups — the configuration variables used by services (WiFi Analytics, throughput tests, etc.). |
| **Lists & Options** | View, edit, and delete list groups — dropdown/selection options used in service configuration. |
| **WiFi Remediation** | View remediation policies and manage remediation logs — automatic WiFi optimization actions. |
| **Task Scheduler** | View failed tasks and manage successful tasks in the background task queue. |
| **SecureDNS** | Add and edit DNS categories; view DNS transaction logs. |
| **Service Settings** | View extended service settings. |
| **Revision History** | Edit revision entries (audit log management). |
**Recommended For:** Platform administrators responsible for configuring device profiles and service parameters.
### CONTROL API Access
#### CONTROL API Logs read-only
**Description:** CONTROL read-only API Logs.
**Purpose:** Provides read-only access to API activity logs, enabling monitoring and auditing of all API transactions made to and from the platform.
**Key Capabilities:**
| Area | Permissions |
|------|------------|
| **API Methods** | View available API methods and their configurations. |
| **API Transaction Logs** | View API transaction logs — records of all API calls made to/from the platform including request/response details. |
| **API Transaction Details** | View detailed information for individual API transactions. |
**Recommended For:** Operations staff, auditors, and support teams who need to monitor API activity for troubleshooting or compliance purposes.
### CONTROL Inventory Management
#### CONTROL inventory admins
**Description:** CONTROL — inventory administration access.
**Purpose:** Full administrative access to the device inventory system, including device management, service configuration, reporting, and system tools.
**Key Capabilities:**
| Area | Permissions |
|------|------------|
| **Devices** | Add, edit, and view devices in the inventory. Manage device settings. |
| **Service Configuration** | Full CRUD on parameters, parameter groups, lists, list groups, and service classes — the building blocks of all services. |
| **Schedules & Scripts** | Create and manage inventory schedules and view script logs. |
| **Reports & Dashboards** | View dashboards. Manage report cache data. |
| **Locations** | Add locations and manage location groups. |
| **Portal** | View and manage portal profiles and templates. |
| **Performance Profiler** | Access the SQL query profiler for performance analysis. |
| **User Management** | Manage content types, permissions, user profiles, and sessions. |
| **Data Replication** | Full control over database replication processes. |
| **WiFi Analytics** | Manage WiFi remediation logs; view remediation policies. |
| **SecureDNS** | Manage categories, view rules and transaction logs. |
| **Validators** | Manage validation rules used by parameters. |
**Recommended For:** Senior administrators and engineering staff who need full control over the inventory and service configuration.
#### CONTROL inventory users
**Description:** CONTROL — inventory regular user access.
**Purpose:** Standard operational access to the device inventory, including device management, parameter editing, and report creation. This is the primary group for day-to-day operations.
**Key Capabilities:**
| Area | Permissions |
|------|------------|
| **Custom Reports** | Create custom reports for personal use. |
| **Dashboards** | Create new dashboards and manage elements. |
| **Service Configuration** | Full CRUD on parameters, lists, and validators — configure service behavior for devices. |
| **Device Settings** | Delete device settings (data cleanup). |
| **Group Variables** | Add group variables for device group configurations. |
| **Combined Logs** | Access combined device log views. |
| **Portal Templates** | Delete portal templates. |
**Recommended For:** NOC operators, field engineers, and support staff who actively manage devices and service configurations.
#### CONTROL inventory basic users
**Description:** CONTROL — inventory basic user access.
**Purpose:** Limited access for users who need to perform basic inventory operations such as creating custom reports and managing specific settings.
**Key Capabilities:**
| Area | Permissions |
|------|------------|
| **Custom Reports** | Create and delete custom reports — personal report configurations with saved filters. |
| **Dashboard Elements** | Remove dashboard widgets from personal views. |
| **Device Settings** | Delete device settings (cleanup operations). |
| **Parameters** | Delete parameters; view and change validators. |
| **Combined Logs** | Access to combined device logs view. |
**Recommended For:** Support staff who need basic report customization and limited inventory access.
#### CONTROL inventory read-only users
**Description:** CONTROL — inventory read-only access.
**Purpose:** Read-oriented access with the ability to create custom reports and dashboards for data visualization.
**Key Capabilities:**
| Area | Permissions |
|------|------------|
| **Custom Reports** | Create and delete custom reports. |
| **Dashboards** | Create dashboards and manage dashboard elements. |
| **Combined Logs** | Access combined device log views. |
| **Device Settings** | Delete device settings (for data cleanup). |
| **Validators** | Edit validator configurations. |
**Recommended For:** Monitoring staff and analysts who need to view inventory data and create custom visualizations.
#### CONTROL inventory read-only basic users
**Description:** CONTROL — inventory read-only basic access.
**Purpose:** Minimal access for users who primarily need to view data and create personal reports.
**Key Capabilities:**
| Area | Permissions |
|------|------------|
| **Custom Reports** | Create and delete custom reports for personal use. |
| **Dashboard Elements** | Add widgets to personal dashboard views. |
| **Validators** | Edit validator configurations. |
**Recommended For:** Users who need read-only access with the ability to create custom report views.
#### CONTROL inventory scripting
**Description:** CONTROL — inventory scripting management and execution.
**Purpose:** Access to script management and execution capabilities for automating device operations.
**Key Capabilities:**
| Area | Permissions |
|------|------------|
| **Scripts** | Execute and manage inventory scripts — automated procedures that run against devices (firmware upgrades, bulk configuration, diagnostics). |
| **Script Logs** | View execution logs and results from script runs. |
**Recommended For:** Operations engineers who need to run automated scripts against the device inventory.
### CONTROL Portal Management
#### CONTROL portal admins
**Description:** CONTROL — portal administration access.
**Purpose:** Administration of the CONTROL end-user portal — the customer-facing interface where end users can view their service status and device information.
**Key Capabilities:**
| Area | Permissions |
|------|------------|
| **Portal Pages** | Create, edit, and manage portal pages — the content displayed to end users. |
| **Portal Templates** | Design and manage page templates that control the portal's appearance. |
| **Portal Profiles** | Configure portal user profiles and access levels. |
| **Portal Services** | Manage which services are exposed through the portal. |
**Recommended For:** Staff responsible for managing and customizing the customer-facing portal.
### Link Management
#### Link admin users
**Description:** Link management application administration access.
**Purpose:** Full administrative access to the Link Management module — used for managing network link associations and interconnections between devices.
**Key Capabilities:**
| Area | Permissions |
|------|------------|
| **Links** | Create, edit, and delete network links and associations. |
| **Link Services** | Manage services associated with links. |
**Recommended For:** Network engineers managing device interconnections and link topology.
#### Link read-only users
**Description:** Link management application read-only access.
**Purpose:** View-only access to the Link Management module.
**Key Capabilities:**
| Area | Permissions |
|------|------------|
| **Links** | View network links and associations without the ability to modify them. |
**Recommended For:** Support staff who need visibility into network link topology without modification rights.
### SecureDNS
#### SecureDNS admins
**Description:** SecureDNS — administration access.
**Purpose:** Administrative access to the SecureDNS module — the DNS-based security filtering system that protects devices from malicious domains.
**Key Capabilities:**
| Area | Permissions |
|------|------------|
| **DNS Rules** | Create, edit, and delete DNS filtering rules — define which domains are blocked, allowed, or redirected. |
| **Categories** | Manage DNS categories (malware, phishing, adult content, etc.). |
| **Transaction Logs** | View DNS query logs and filtering statistics. |
| **Service Settings** | Manage SecureDNS service configuration. |
**Recommended For:** Security operations staff managing DNS-based protection policies.
#### SecureDNS reports
**Description:** SecureDNS — reports and transactions access.
**Purpose:** Read-only access to SecureDNS reporting and transaction data.
**Key Capabilities:**
| Area | Permissions |
|------|------------|
| **Reports** | View DNS filtering statistics, top blocked domains, category breakdowns, and response time metrics. |
| **Transaction Logs** | View DNS query logs to analyze filtering activity. |
**Recommended For:** Analysts and managers who need visibility into DNS security metrics without the ability to modify rules.
### SONDA (User Experience Monitoring)
#### SONDA admins
**Description:** SONDA / User experience — administration access.
**Purpose:** Administrative access to the SONDA module — the user experience monitoring system that runs automated tests (latency, jitter, throughput, WiFi quality) from probes and CPE devices.
**Key Capabilities:**
| Area | Permissions |
|------|------------|
| **Events** | View and delete events — automated alerts triggered by test results exceeding thresholds. |
| **Event Patterns** | Create event patterns — define which conditions trigger automated alerts. |
| **Event Origins** | Manage event origins — configure the sources (probes, devices) that generate events. |
| **Event Logs** | Add detailed event log entries. |
| **Test Profiles** | Configure test profiles that define which tests run on which schedules. |
| **Test Services** | Manage test service definitions (ping, throughput, WiFi analytics, etc.). |
**Recommended For:** Engineers configuring automated quality of experience (QoE) monitoring and alert thresholds.
#### SONDA reports
**Description:** SONDA / User experience — reports and transactions access.
**Purpose:** Read-only access to SONDA test results, metrics, and event data.
**Key Capabilities:**
| Area | Permissions |
|------|------------|
| **Event Logs** | View and edit event log entries. |
| **Event Origins** | View and edit event origin configurations. |
| **Test Results** | View test results — latency, jitter, throughput, WiFi scores, and other QoE metrics collected from probes and devices. |
| **Reports** | Access SONDA dashboards and metric reports. |
**Recommended For:** Operators and analysts monitoring service quality metrics.
### General User Access
#### Users
**Description:** Regular users — access to user's profile, change password operations, etc.
**Purpose:** Minimal access for basic user self-service operations.
**Key Capabilities:**
| Area | Permissions |
|------|------------|
| **User Profile** | View own user profile and personal information. |
| **Password** | Change own password. |
| **Site Settings** | View basic site configuration. |
**Recommended For:** Users who only need to manage their own account, such as portal-only users or external collaborators with limited access.
#### Users: Expert mode
**Description:** Expert mode users — users that can activate the "Expert Mode" option in admin interfaces.
**Purpose:** Enables the "Expert Mode" toggle in the admin interface. When activated, Expert Mode reveals advanced fields, options, and actions that are hidden by default to prevent accidental changes.
**Key Capabilities:**
| Area | Permissions |
|------|------------|
| **Expert Mode Toggle** | Access to the Expert Mode switch in the admin interface. When activated, shows advanced fields in device profiles, parameters, services, and other admin forms. |
| **Configuration Profiles** | Create new configuration profiles — advanced device provisioning templates. |
| **Advanced Actions** | In Expert Mode, additional actions become available on models that normally restrict certain operations (e.g., audit records, firmware logs). |
**Recommended For:** Senior engineers and administrators who need access to advanced configuration options. This group should be assigned selectively to users who understand the implications of advanced configuration changes.
## Recommended Group Combinations by Role
Users are typically assigned **combinations of groups** that together define their operational role. The following combinations provide templates for common organizational roles:
### Monitoring and Read-Only Roles
| Role | Recommended Groups | Description |
|------|-------------------|-------------|
| **Basic Monitoring** | • CONTROL API Logs read-only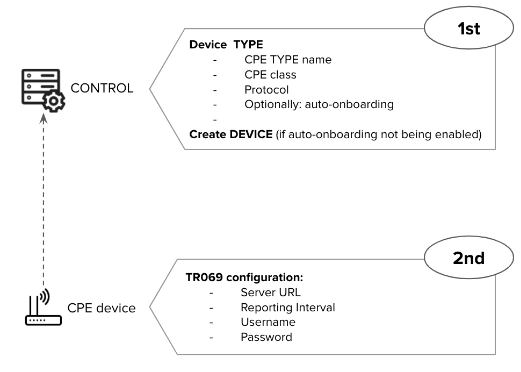
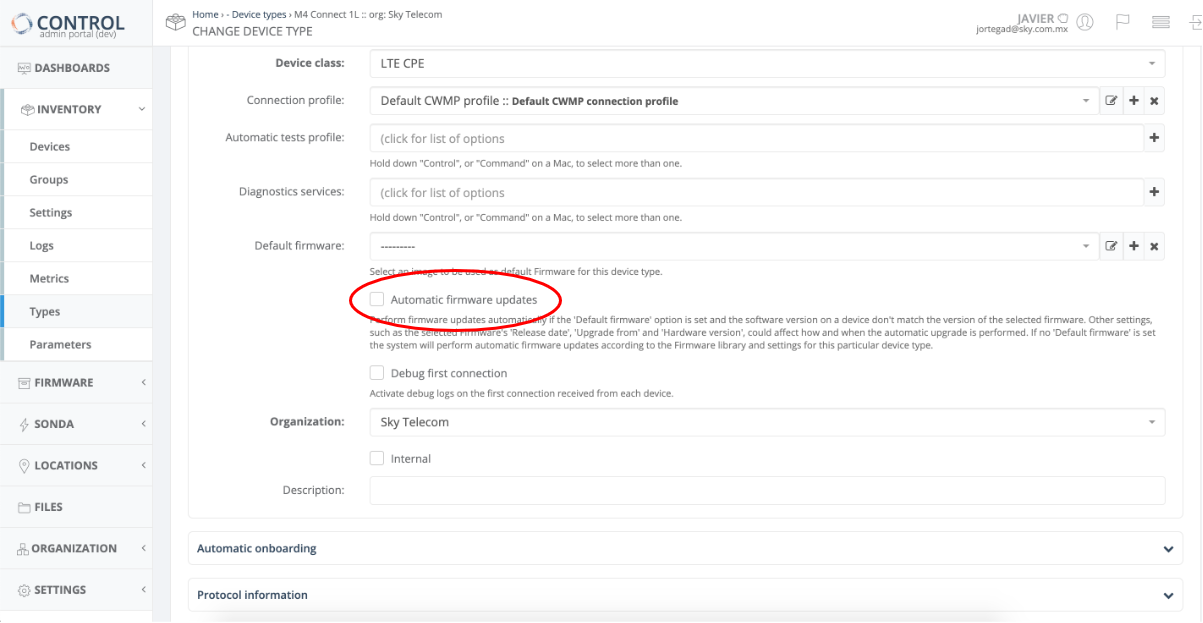
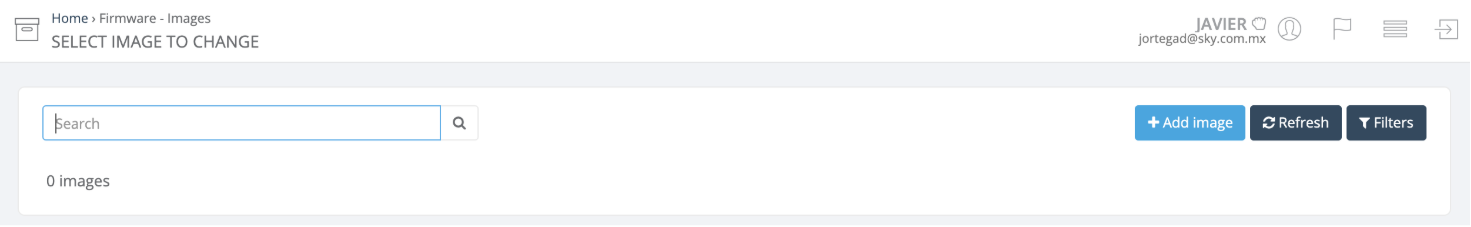
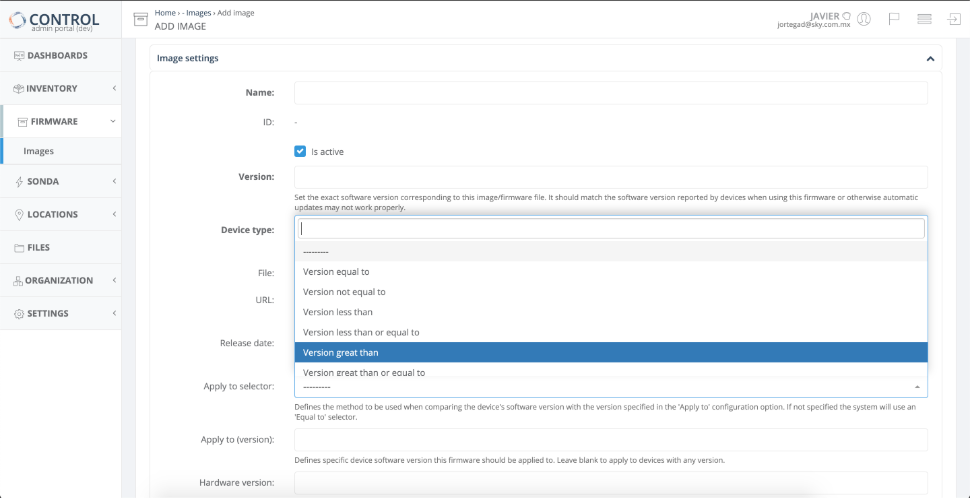
 ---
### Step 1: Configure Profiles (Phase 1)
The profile defines Phase 1 parameters for the IPsec connection.
1. Click the **Profiles** tab in the center panel
2. Click **Add New** to create a new profile
---
### Step 1: Configure Profiles (Phase 1)
The profile defines Phase 1 parameters for the IPsec connection.
1. Click the **Profiles** tab in the center panel
2. Click **Add New** to create a new profile
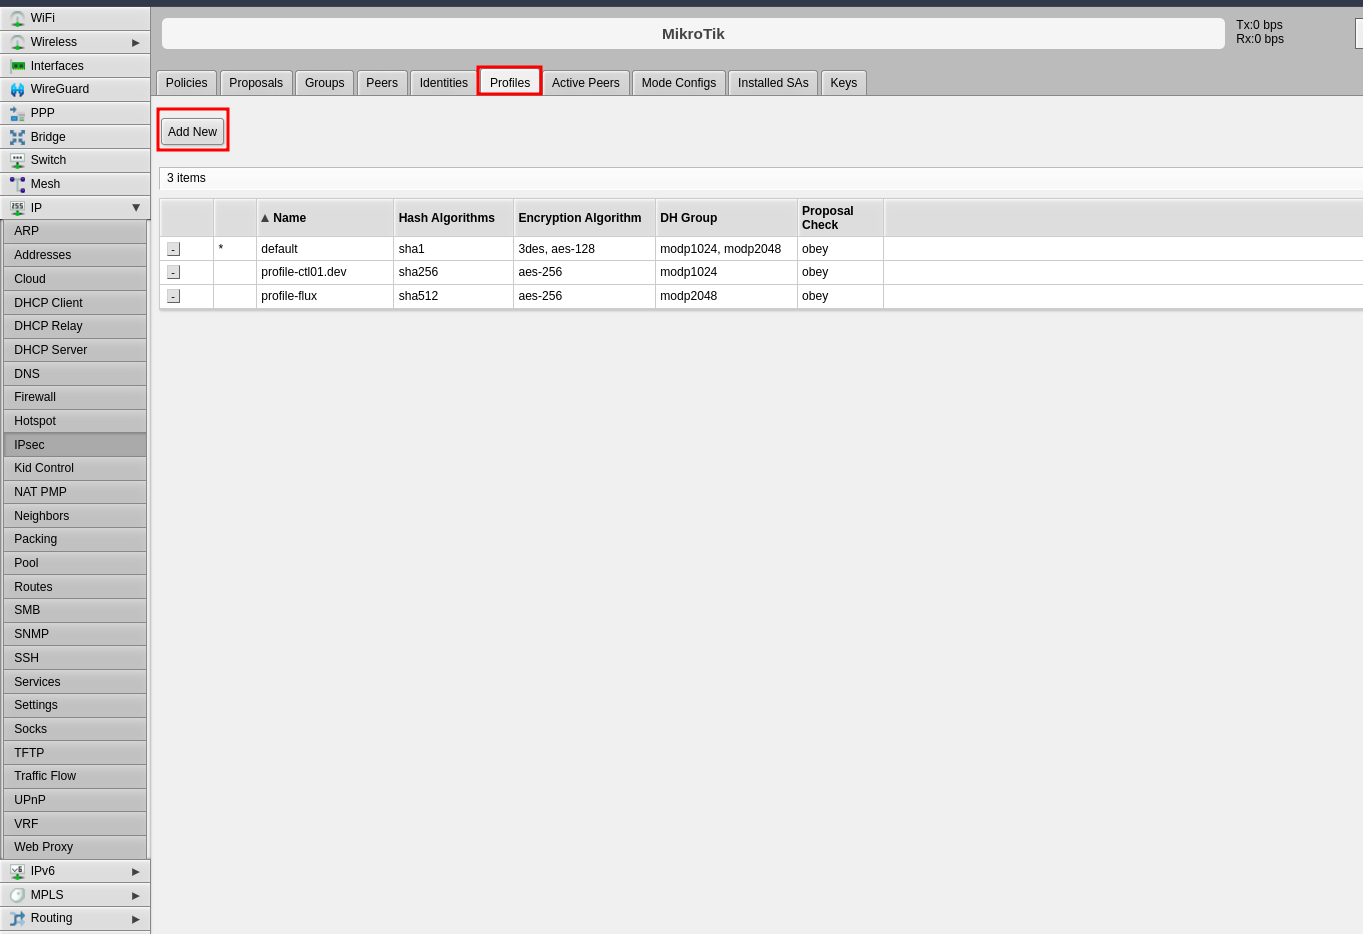 3. Configure the following Phase 1 parameters:
- **Name**: Enter a descriptive name to identify the profile (e.g., "profile-to-ctl01.dev")
- **Hash Algorithms**: Select a hash algorithm that matches the configuration on the remote endpoint
- **Encryption Algorithm**: Choose an encryption algorithm that matches the remote endpoint configuration
- **Lifetime**: Leave the default value (measured in seconds)
- **NAT Traversal**: Enable this option if the router is behind NAT
- **DPD Interval**: Leave the default value for Dead Peer Detection and note this number
- **DPD Maximum Failures**: Leave the default value
4. Click **Apply**, then click **OK**
3. Configure the following Phase 1 parameters:
- **Name**: Enter a descriptive name to identify the profile (e.g., "profile-to-ctl01.dev")
- **Hash Algorithms**: Select a hash algorithm that matches the configuration on the remote endpoint
- **Encryption Algorithm**: Choose an encryption algorithm that matches the remote endpoint configuration
- **Lifetime**: Leave the default value (measured in seconds)
- **NAT Traversal**: Enable this option if the router is behind NAT
- **DPD Interval**: Leave the default value for Dead Peer Detection and note this number
- **DPD Maximum Failures**: Leave the default value
4. Click **Apply**, then click **OK**
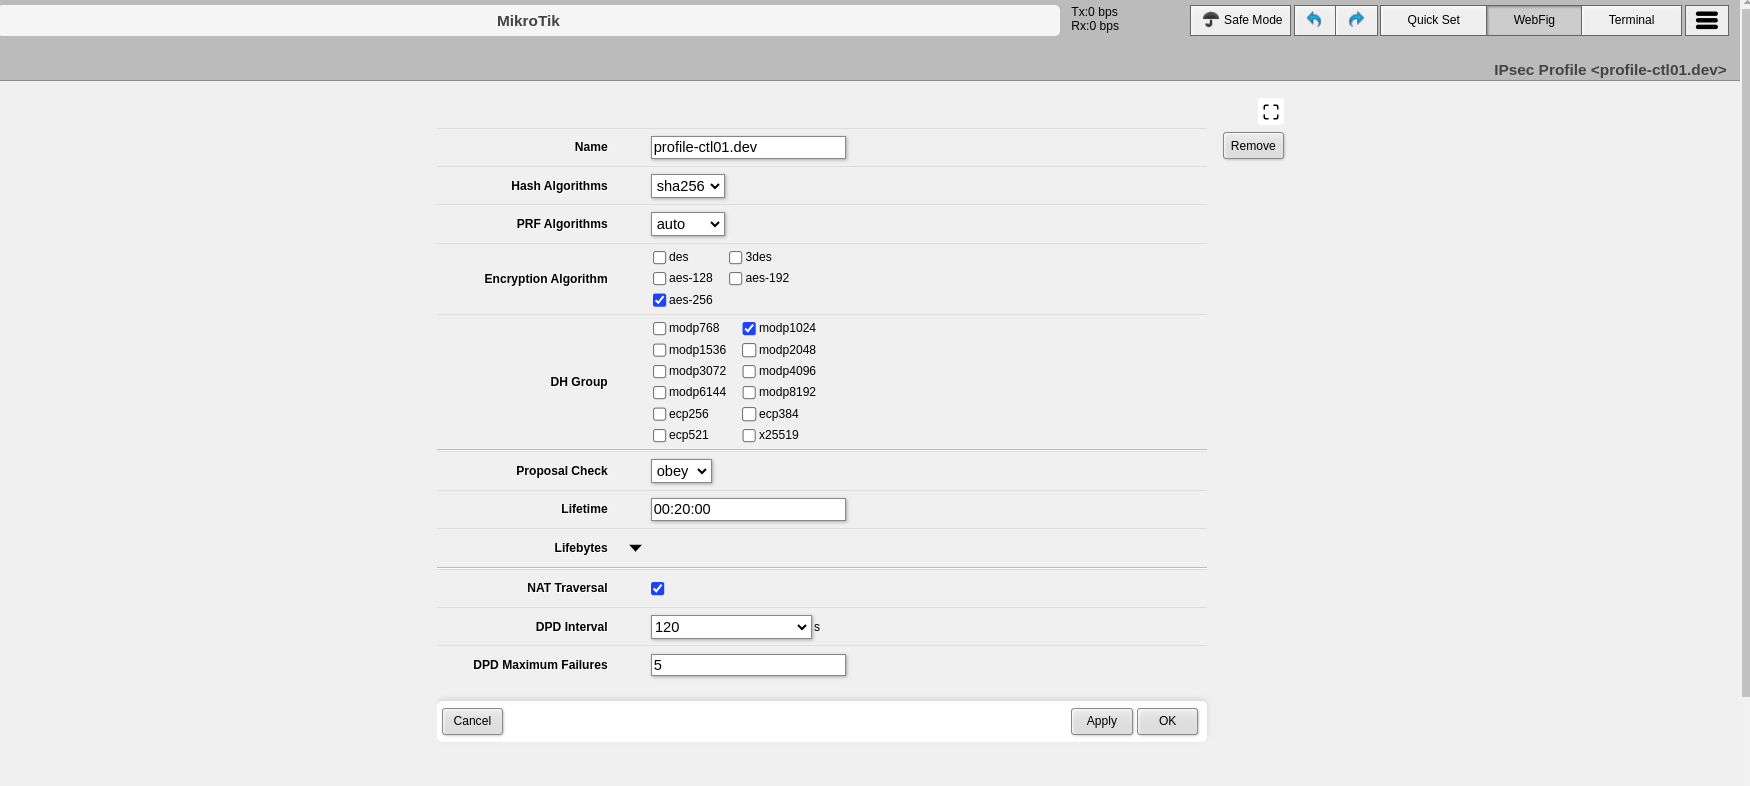 ---
### Step 2: Configure Peers
The peer configuration defines the remote VPN endpoint.
1. Click the **Peers** tab
2. Click **Add New**
---
### Step 2: Configure Peers
The peer configuration defines the remote VPN endpoint.
1. Click the **Peers** tab
2. Click **Add New**
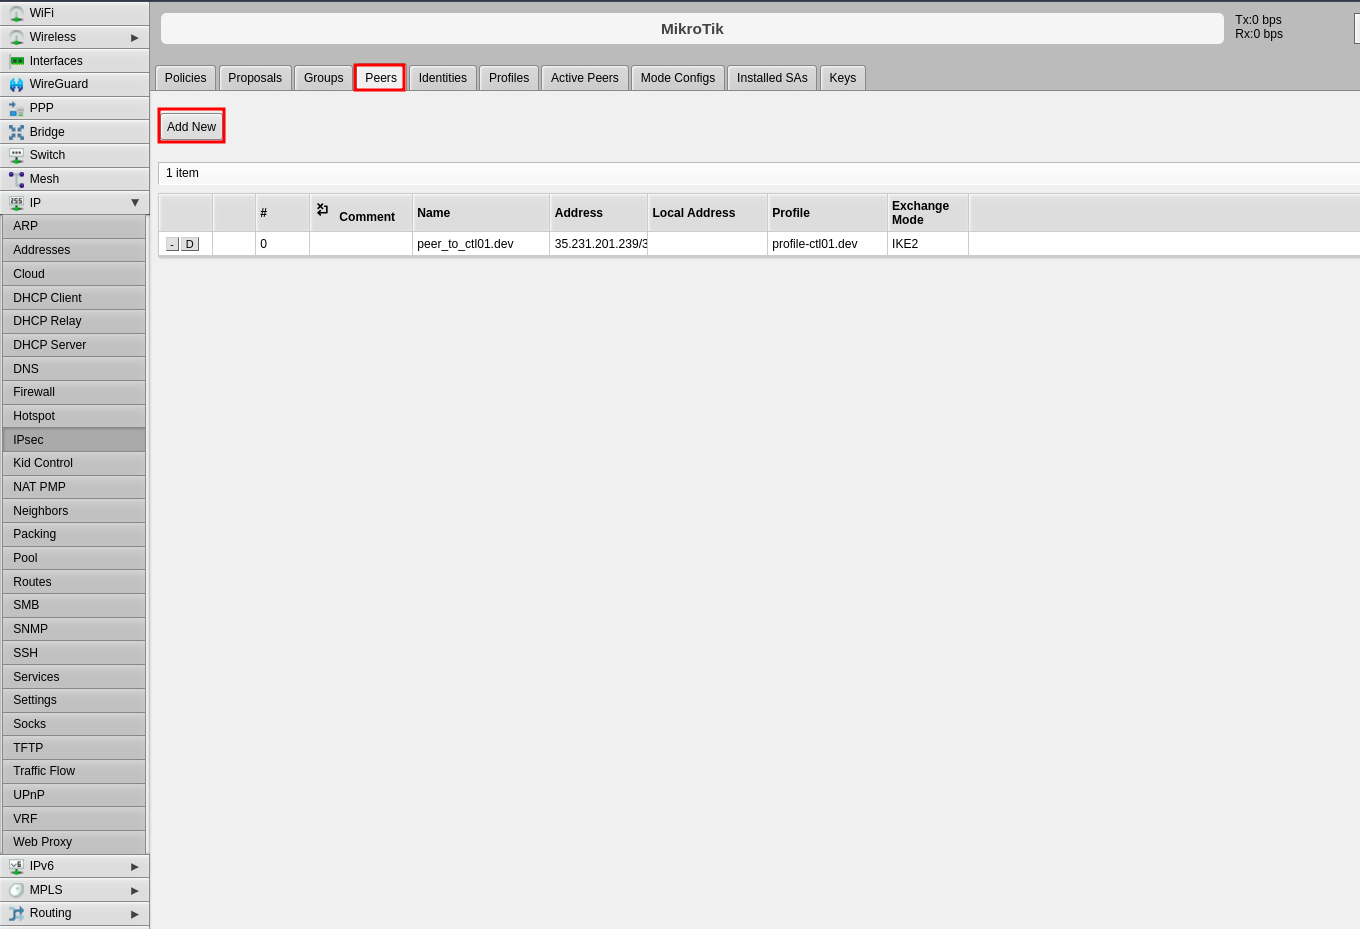 3. Configure the following fields:
- **Name**: Enter a name to identify the remote peer
- **Address**: Enter the remote public IP address (e.g., 35.35.35.22/32)
- **Profile**: Select the profile created in Step 1
- **Exchange Mode**: Select the exchange mode (IKE2 is recommended)
4. Click **Apply**, then click **OK**
3. Configure the following fields:
- **Name**: Enter a name to identify the remote peer
- **Address**: Enter the remote public IP address (e.g., 35.35.35.22/32)
- **Profile**: Select the profile created in Step 1
- **Exchange Mode**: Select the exchange mode (IKE2 is recommended)
4. Click **Apply**, then click **OK**
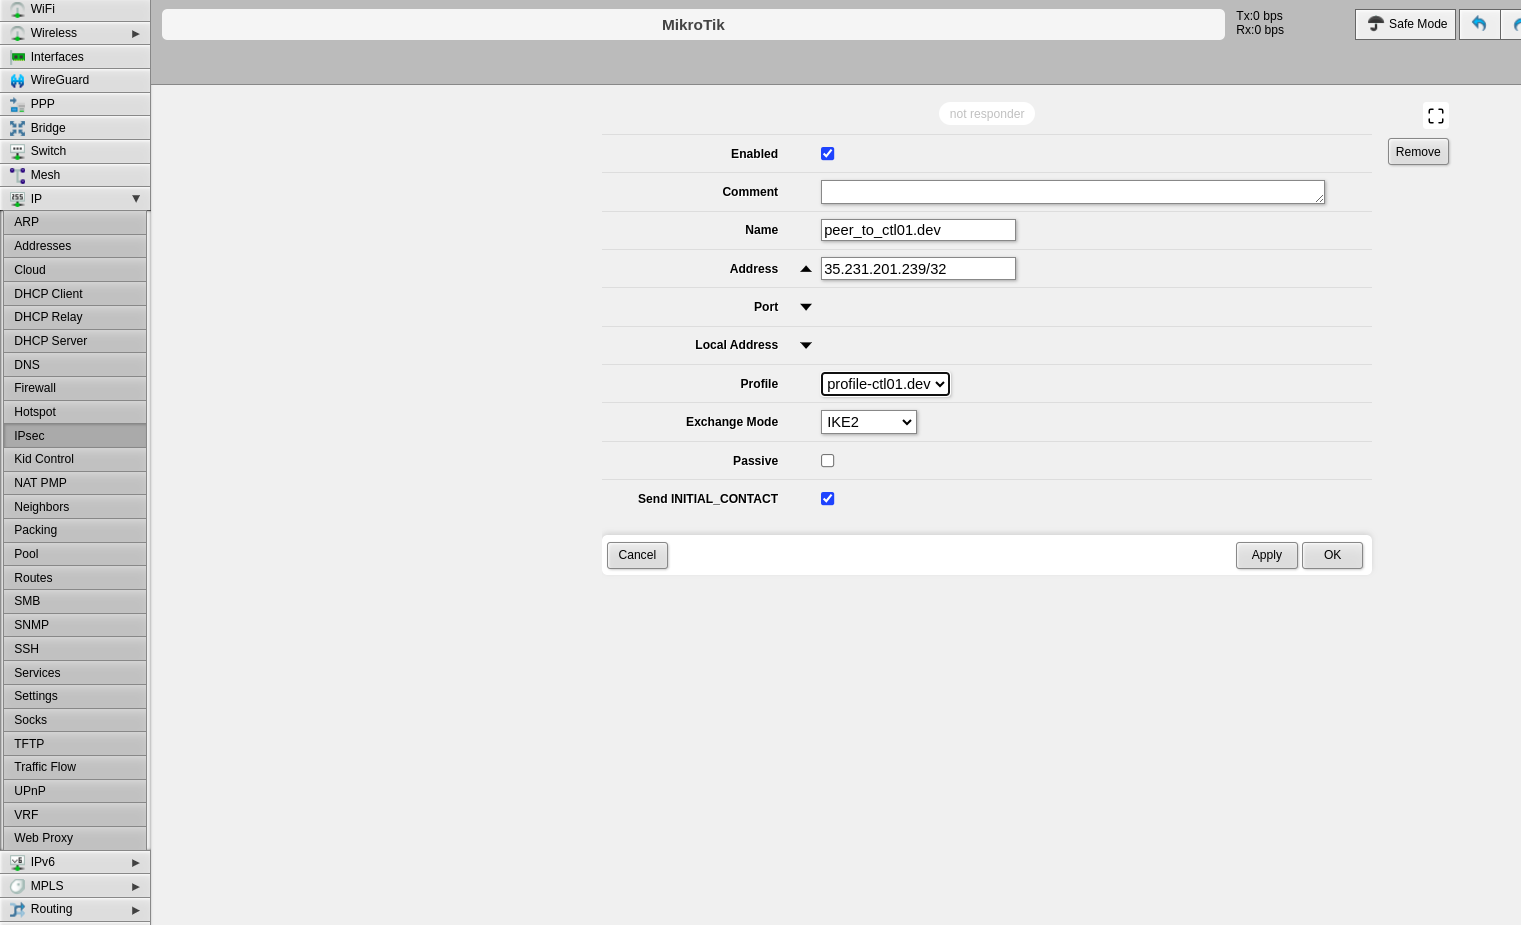 ---
### Step 3: Configure Identities
The identities configuration defines authentication credentials.
1. Click the **Identities** tab
2. Click **Add New**
---
### Step 3: Configure Identities
The identities configuration defines authentication credentials.
1. Click the **Identities** tab
2. Click **Add New**
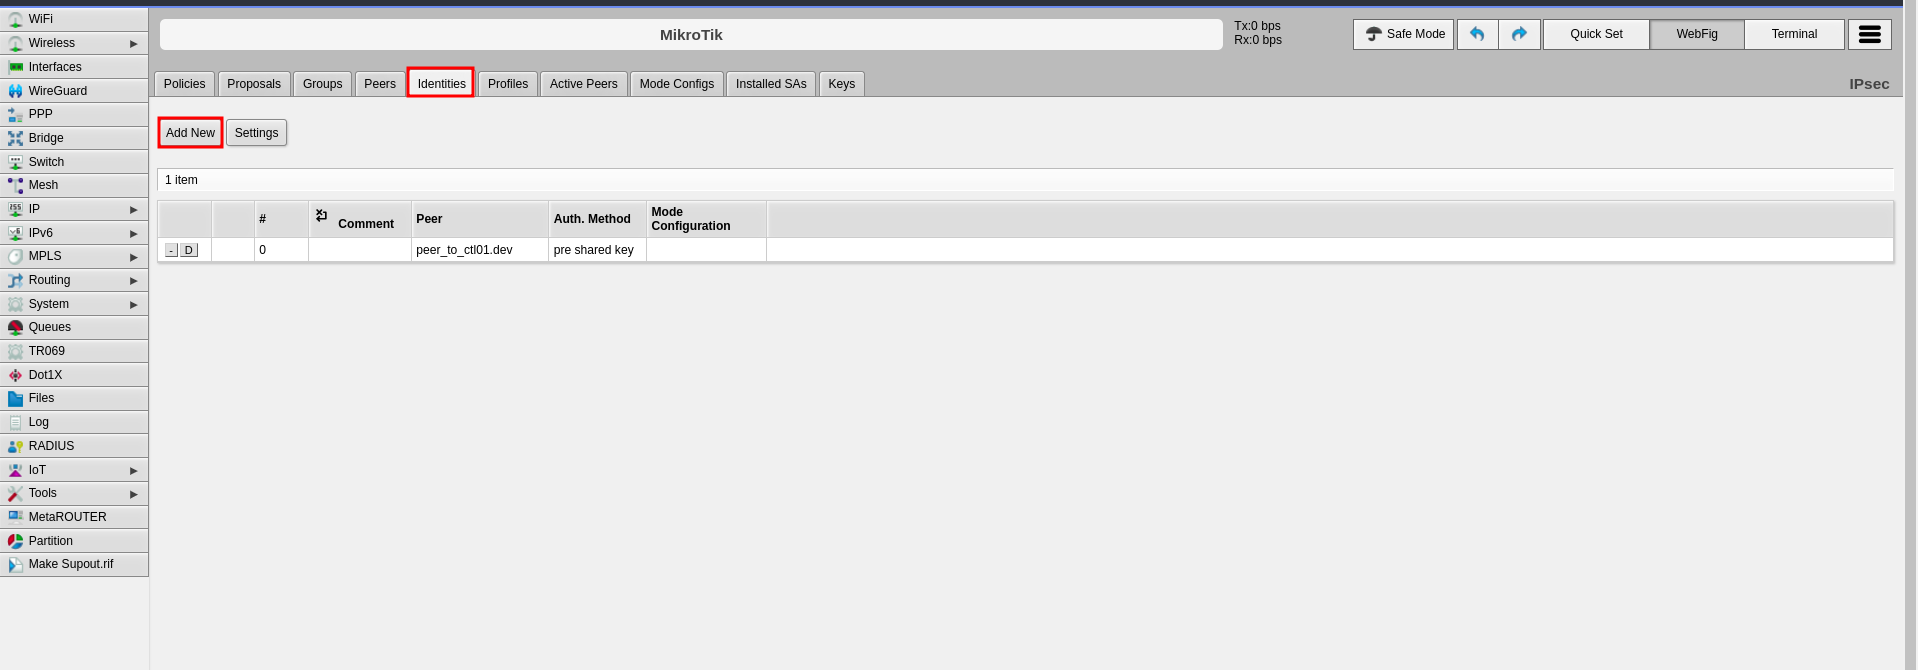 3. Configure the following fields:
- **Peer**: Select the peer configured in Step 2
- **Auth. Method**: Select "pre shared key"
- **Secret**: Enter the pre-shared key that will be configured on both endpoints
4. Click **Apply**, then click **OK**
3. Configure the following fields:
- **Peer**: Select the peer configured in Step 2
- **Auth. Method**: Select "pre shared key"
- **Secret**: Enter the pre-shared key that will be configured on both endpoints
4. Click **Apply**, then click **OK**
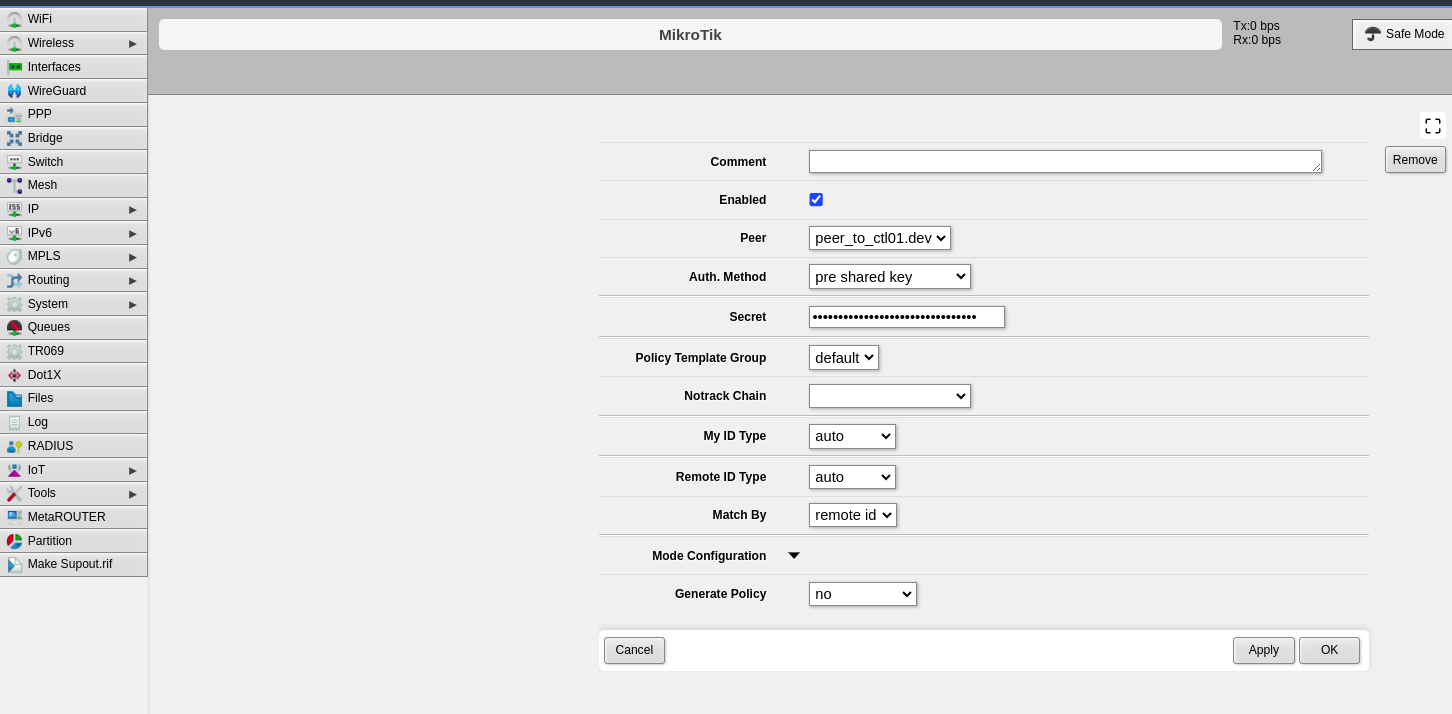 ---
### Step 4: Configure Proposals (Phase 2)
The proposal defines Phase 2 parameters for the IPsec connection.
1. Click the **Proposals** tab
2. Click **Add New**
---
### Step 4: Configure Proposals (Phase 2)
The proposal defines Phase 2 parameters for the IPsec connection.
1. Click the **Proposals** tab
2. Click **Add New**
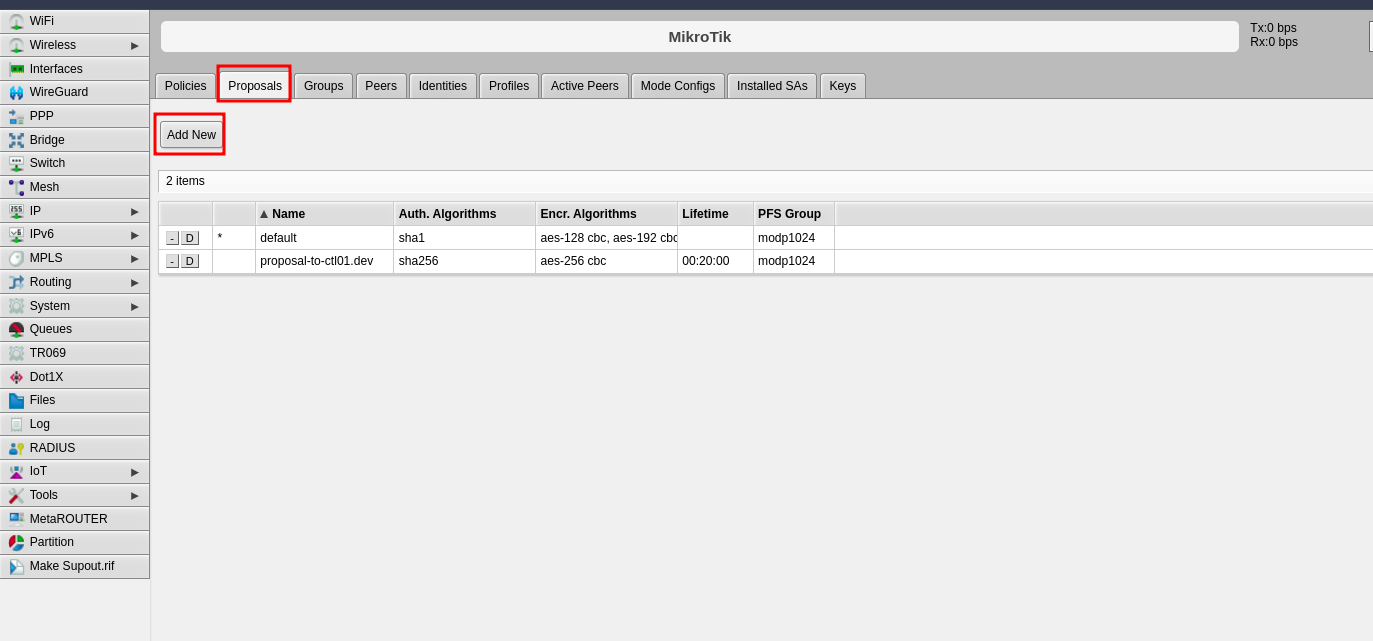 3. Configure the following Phase 2 parameters:
- **Name**: Enter a name to identify this proposal
- **Auth. Algorithms**: Select the authentication algorithm to be used on both endpoints
- **Encr. Algorithms**: Select the encryption algorithm to be used on both endpoints
- **Lifetime**: Set the lifetime for Phase 2
- **PFS Group**: Select the Diffie-Hellman group for Perfect Forward Secrecy (PFS). This determines the session key generation during key exchange
4. Click **Apply**, then click **OK**
3. Configure the following Phase 2 parameters:
- **Name**: Enter a name to identify this proposal
- **Auth. Algorithms**: Select the authentication algorithm to be used on both endpoints
- **Encr. Algorithms**: Select the encryption algorithm to be used on both endpoints
- **Lifetime**: Set the lifetime for Phase 2
- **PFS Group**: Select the Diffie-Hellman group for Perfect Forward Secrecy (PFS). This determines the session key generation during key exchange
4. Click **Apply**, then click **OK**
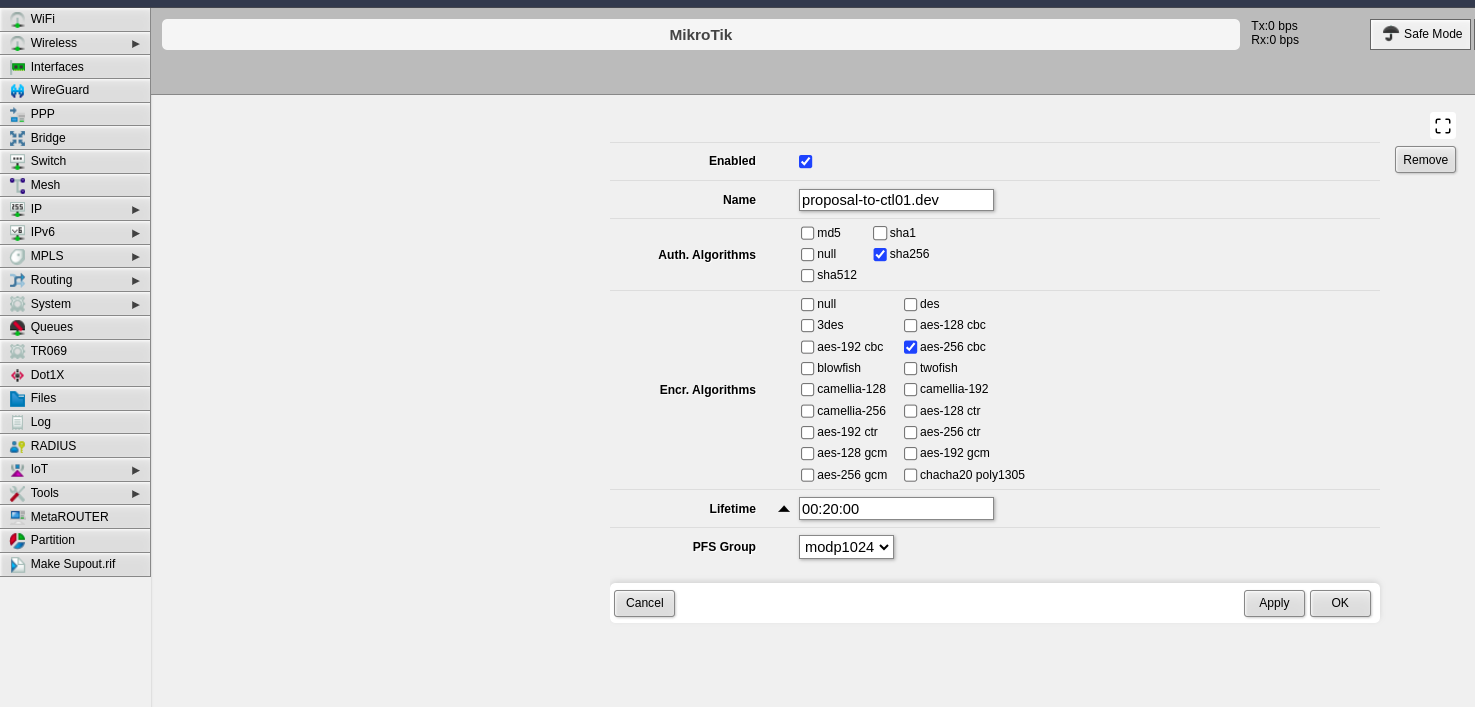 ---
### Step 5: Configure Policies
The policy defines which traffic should pass through the VPN tunnel.
1. Click the **Policies** tab
2. Click **Add New**
---
### Step 5: Configure Policies
The policy defines which traffic should pass through the VPN tunnel.
1. Click the **Policies** tab
2. Click **Add New**
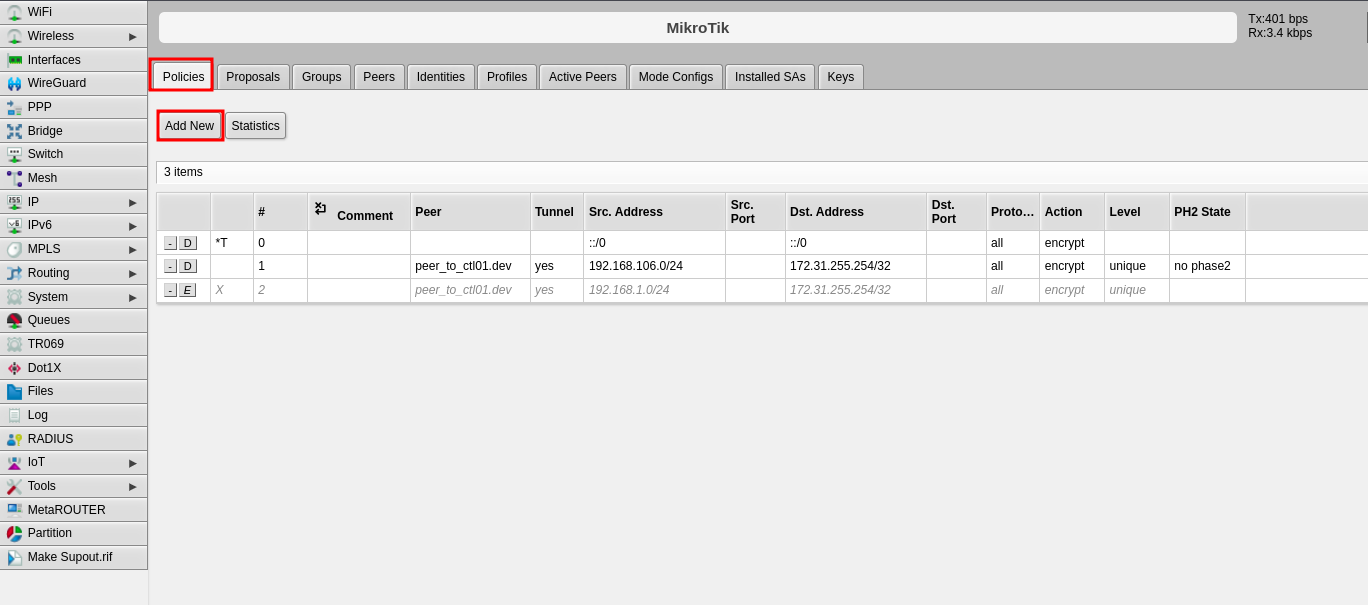 3. Configure the following fields:
- **Peer**: Select the peer configured in Step 2
- **Tunnel**: Enable this option to establish the tunnel between both sites
- **Src. Address**: Enter the local IP address or network that will pass through the tunnel
- **Dst. Address**: Enter the remote IP address or network that will be received from the other end
- **Level**: Select "unique"
- **Proposal**: Select the proposal created in Step 4
4. Click **Apply**, then click **OK**
3. Configure the following fields:
- **Peer**: Select the peer configured in Step 2
- **Tunnel**: Enable this option to establish the tunnel between both sites
- **Src. Address**: Enter the local IP address or network that will pass through the tunnel
- **Dst. Address**: Enter the remote IP address or network that will be received from the other end
- **Level**: Select "unique"
- **Proposal**: Select the proposal created in Step 4
4. Click **Apply**, then click **OK**
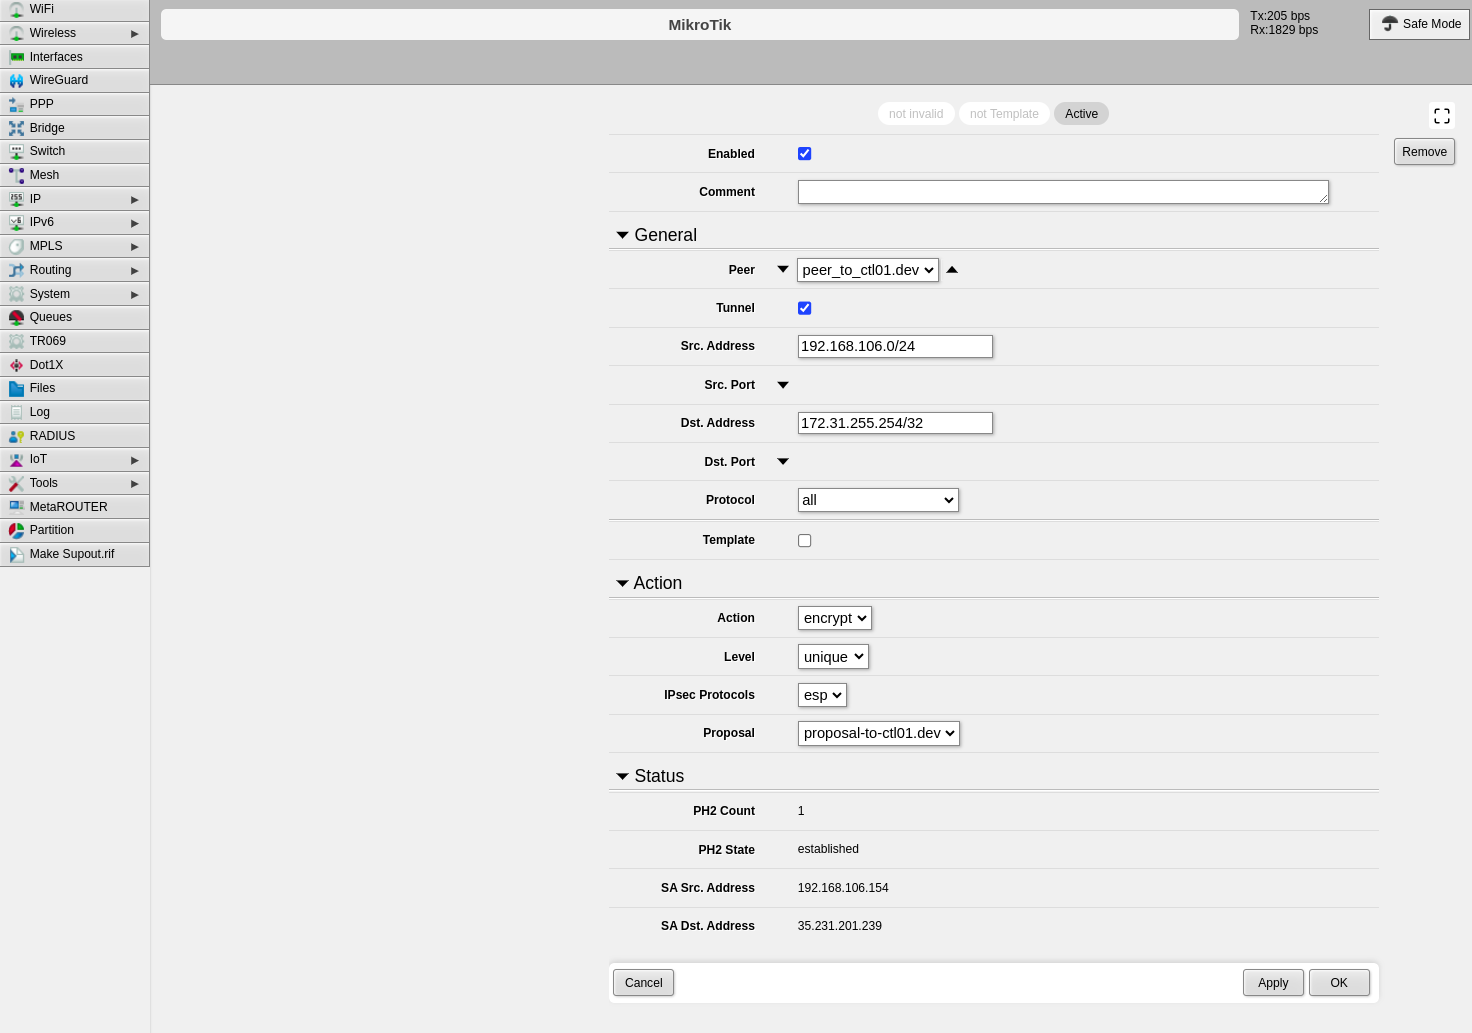 ---
## Part 2: CONTROL Configuration
### Initial Navigation
1. Navigate to the **Links** section in the left-side menu
2. Select the **Services** tab at the top
3. Click the **+Add** button
---
## Part 2: CONTROL Configuration
### Initial Navigation
1. Navigate to the **Links** section in the left-side menu
2. Select the **Services** tab at the top
3. Click the **+Add** button
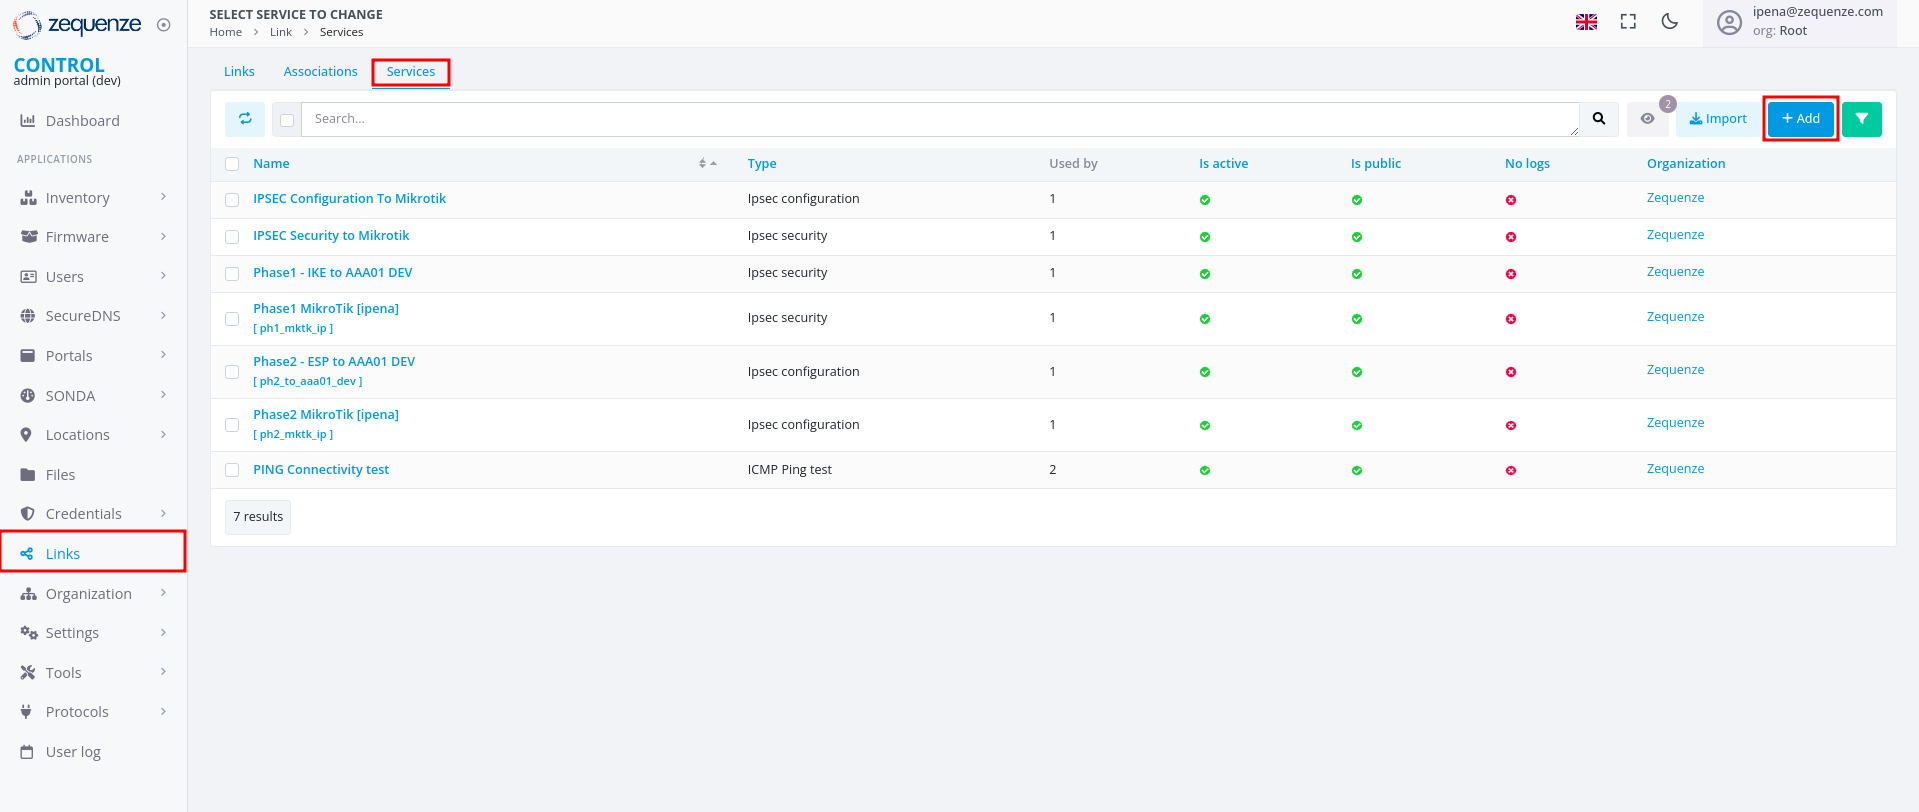 ---
### Step 1: Create IPsec Security Service (Phase 1)
1. Configure the basic information:
- **Name**: Enter a name to identify Phase 1
- **Short-name/code**: Enter a short identifier for quick reference
- **Organization**: Select the organization that will use this connection
- **Type**: Select "IPsec Security"
2. Click **Save** at the bottom
---
### Step 1: Create IPsec Security Service (Phase 1)
1. Configure the basic information:
- **Name**: Enter a name to identify Phase 1
- **Short-name/code**: Enter a short identifier for quick reference
- **Organization**: Select the organization that will use this connection
- **Type**: Select "IPsec Security"
2. Click **Save** at the bottom
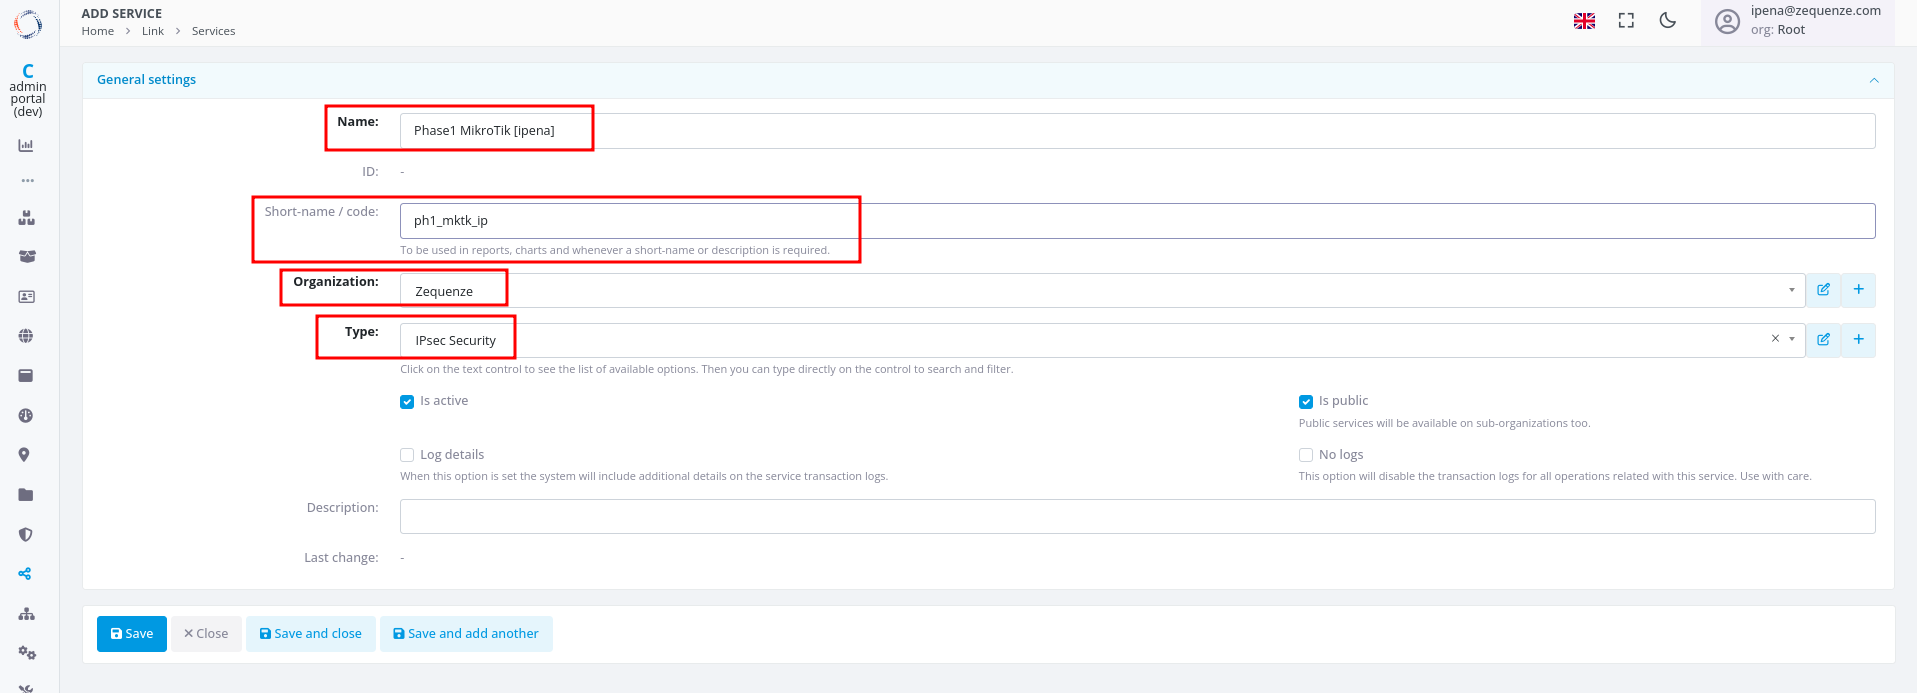 3. Configure the Phase 1 parameters to match your RouterOS configuration:
- **Authentication method**: Select "PSK"
- **IKE version**: Select "Version 2"
- **Encryption algorithm**: Enter "aes256"
- **Integrity algorithm**: Enter "sha256" or "sha2_256"
- **Diffie Hellman group (PFS)**: Enter "modp1024"
- **Lifetime**: Enter 1200 (equivalent to 20 minutes)
- **Key negotiation retries**: Enter "0"
- **Aggressive Mode**: Enable this option
4. Click **Save and close** at the bottom
3. Configure the Phase 1 parameters to match your RouterOS configuration:
- **Authentication method**: Select "PSK"
- **IKE version**: Select "Version 2"
- **Encryption algorithm**: Enter "aes256"
- **Integrity algorithm**: Enter "sha256" or "sha2_256"
- **Diffie Hellman group (PFS)**: Enter "modp1024"
- **Lifetime**: Enter 1200 (equivalent to 20 minutes)
- **Key negotiation retries**: Enter "0"
- **Aggressive Mode**: Enable this option
4. Click **Save and close** at the bottom
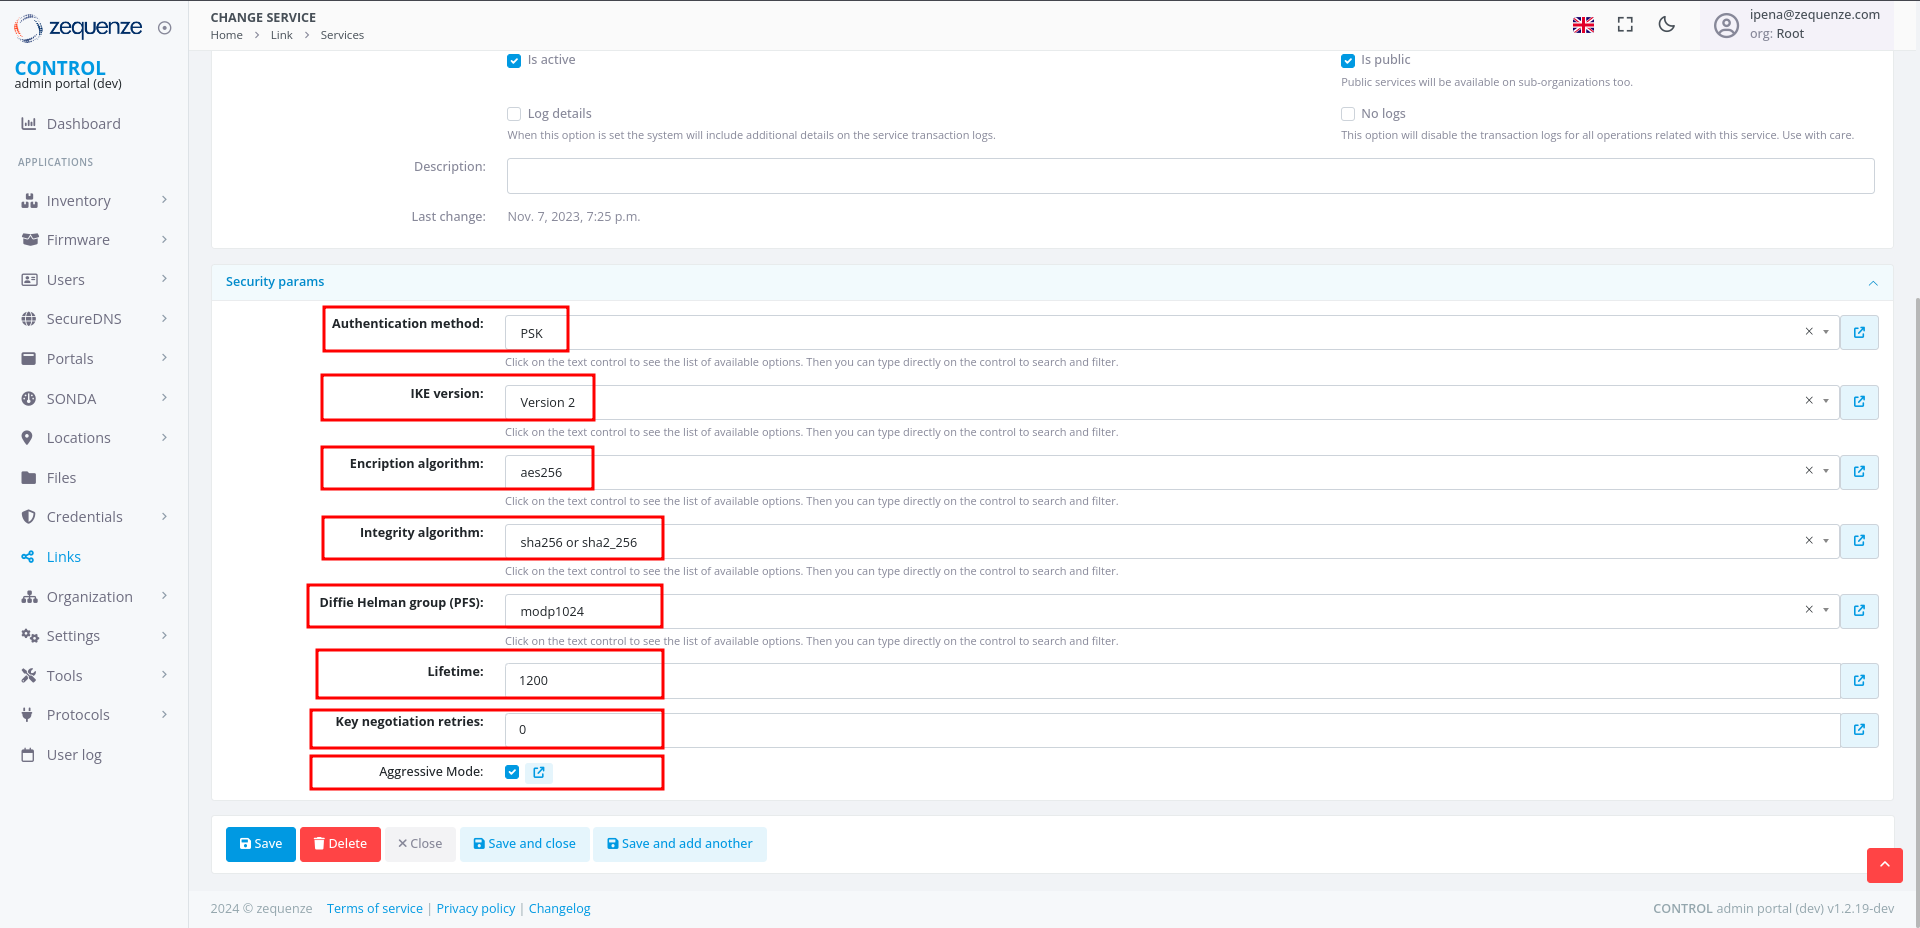 ---
### Step 2: Create IPsec Configuration Service (Phase 2)
1. In the **Services** tab, click **+Add** again to create another service
2. Configure the basic information:
- **Name**: Enter a name to identify Phase 2
- **Short-name/code**: Enter a short identifier for quick reference
- **Organization**: Select the organization that will use this connection
- **Type**: Select "IPsec Configuration"
---
### Step 2: Create IPsec Configuration Service (Phase 2)
1. In the **Services** tab, click **+Add** again to create another service
2. Configure the basic information:
- **Name**: Enter a name to identify Phase 2
- **Short-name/code**: Enter a short identifier for quick reference
- **Organization**: Select the organization that will use this connection
- **Type**: Select "IPsec Configuration"
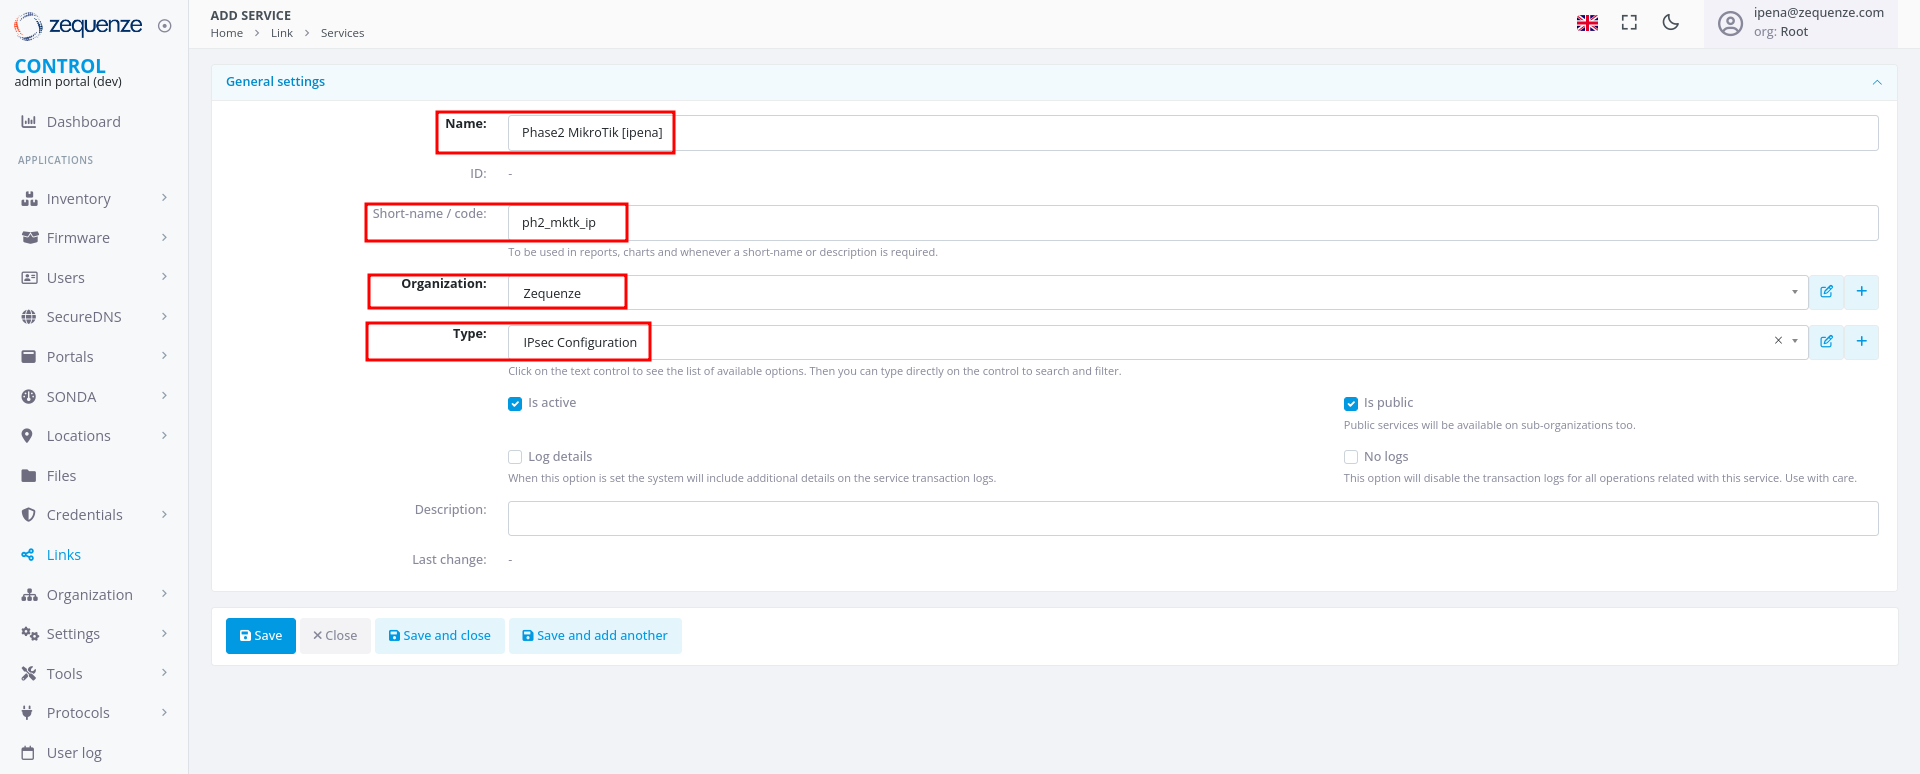 3. Configure the Phase 2 parameters to match your RouterOS configuration:
- **Tunnel type**: Select "Tunnel (ESP)"
- **Encryption algorithm**: Enter "aes256"
- **Integrity algorithm**: Enter "sha256" or "sha2_256"
- **Diffie Hellman group (PFS)**: Enter "modp1024"
- **Lifetime**: Enter 1200 (equivalent to 20 minutes)
3. Configure the Phase 2 parameters to match your RouterOS configuration:
- **Tunnel type**: Select "Tunnel (ESP)"
- **Encryption algorithm**: Enter "aes256"
- **Integrity algorithm**: Enter "sha256" or "sha2_256"
- **Diffie Hellman group (PFS)**: Enter "modp1024"
- **Lifetime**: Enter 1200 (equivalent to 20 minutes)
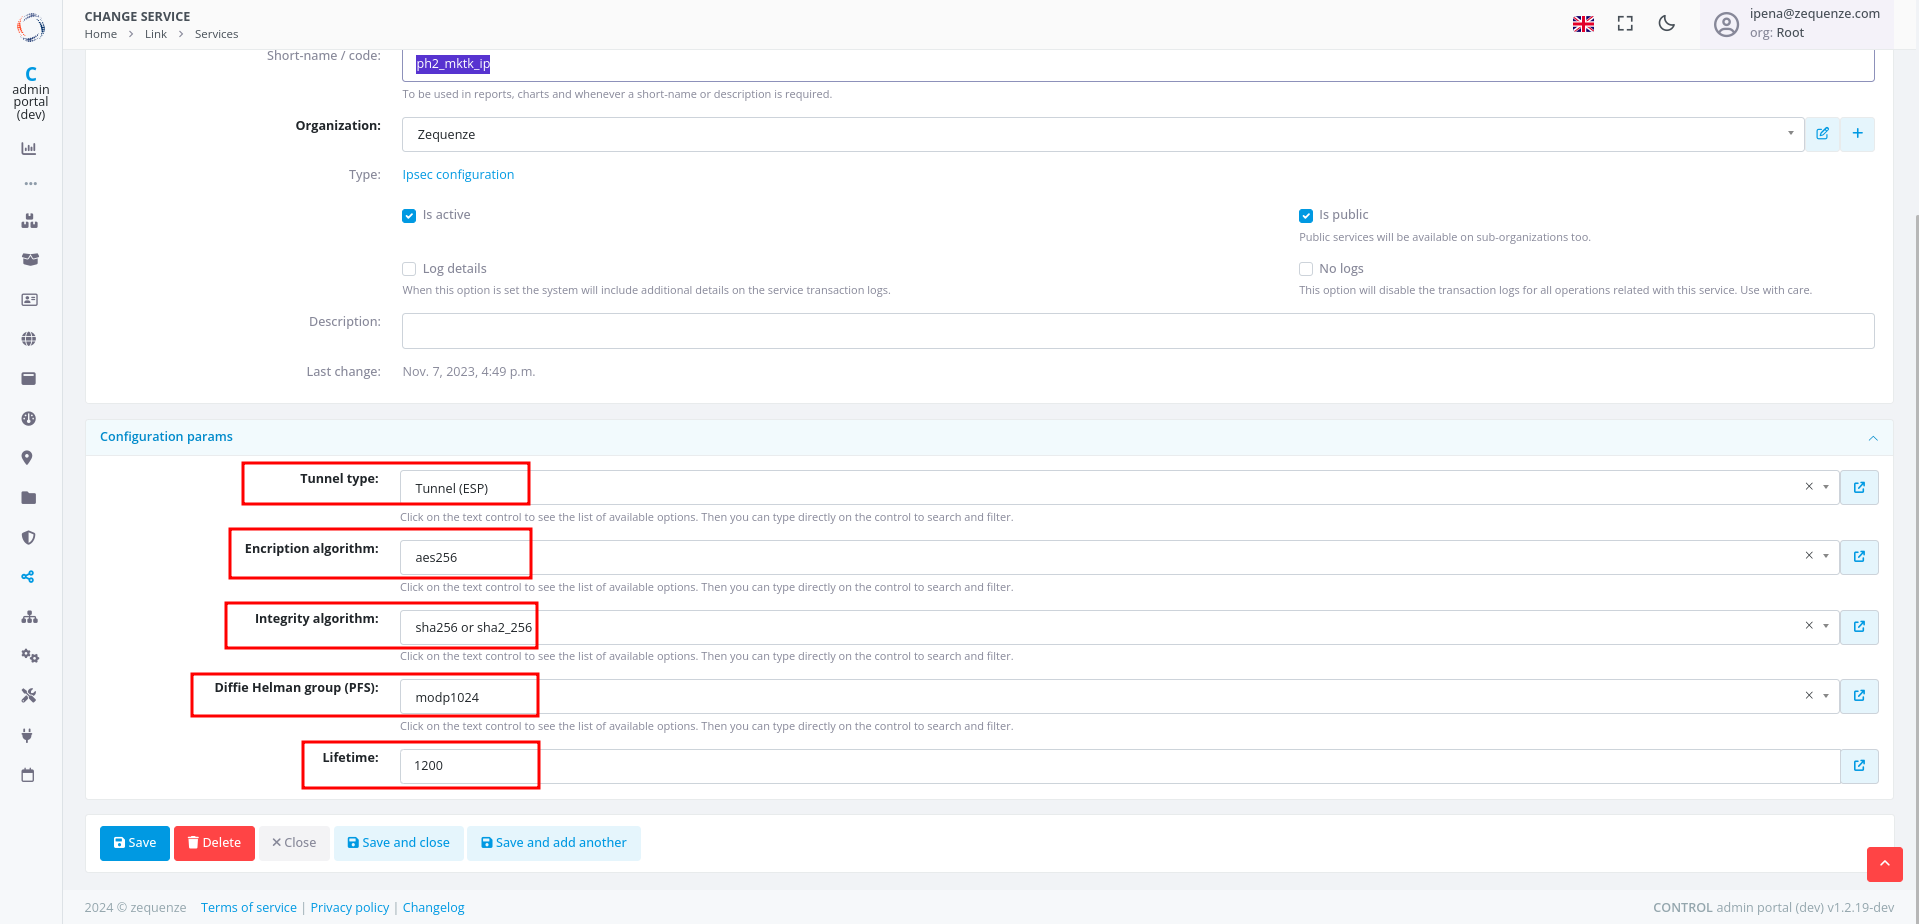 ---
### Step 3: Create Association
1. In the **Links** section, select the **Association** tab
2. Click the **+Add** button
---
### Step 3: Create Association
1. In the **Links** section, select the **Association** tab
2. Click the **+Add** button
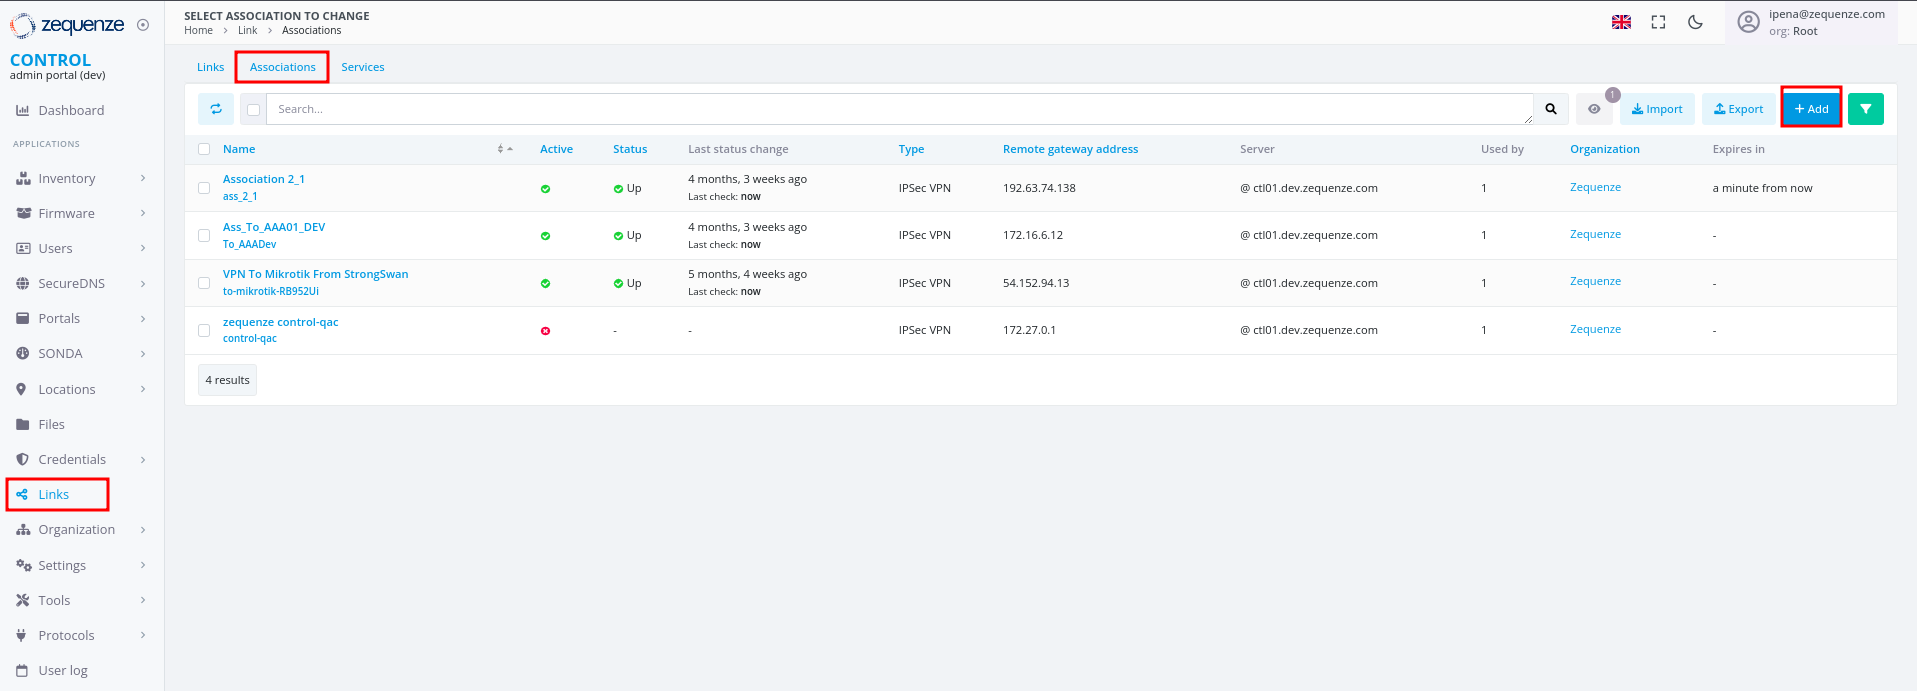 3. Configure the following fields:
- **Name**: Enter a name to identify this association
- **Short-name / code**: Enter a short identifier for quick reference
- **Type**: Leave "IPSec VPN" selected
- **Local gateway type**: Leave "Private IP" selected
- **Remote gateway address**: Enter the remote public IP address you are connecting to
- **Remote gateway id**: Enter the WAN interface IP of the RouterOS device
- **Secret**: Enter the pre-shared key (must match the secret configured in RouterOS)
- **Security service**: Select the IPsec Security service created in Step 1
- **Configuration service**: Select the IPsec Configuration service created in Step 2
- **Server**: Select the internal server to use
- **Organization**: Select the organization that will use this connection
3. Configure the following fields:
- **Name**: Enter a name to identify this association
- **Short-name / code**: Enter a short identifier for quick reference
- **Type**: Leave "IPSec VPN" selected
- **Local gateway type**: Leave "Private IP" selected
- **Remote gateway address**: Enter the remote public IP address you are connecting to
- **Remote gateway id**: Enter the WAN interface IP of the RouterOS device
- **Secret**: Enter the pre-shared key (must match the secret configured in RouterOS)
- **Security service**: Select the IPsec Security service created in Step 1
- **Configuration service**: Select the IPsec Configuration service created in Step 2
- **Server**: Select the internal server to use
- **Organization**: Select the organization that will use this connection
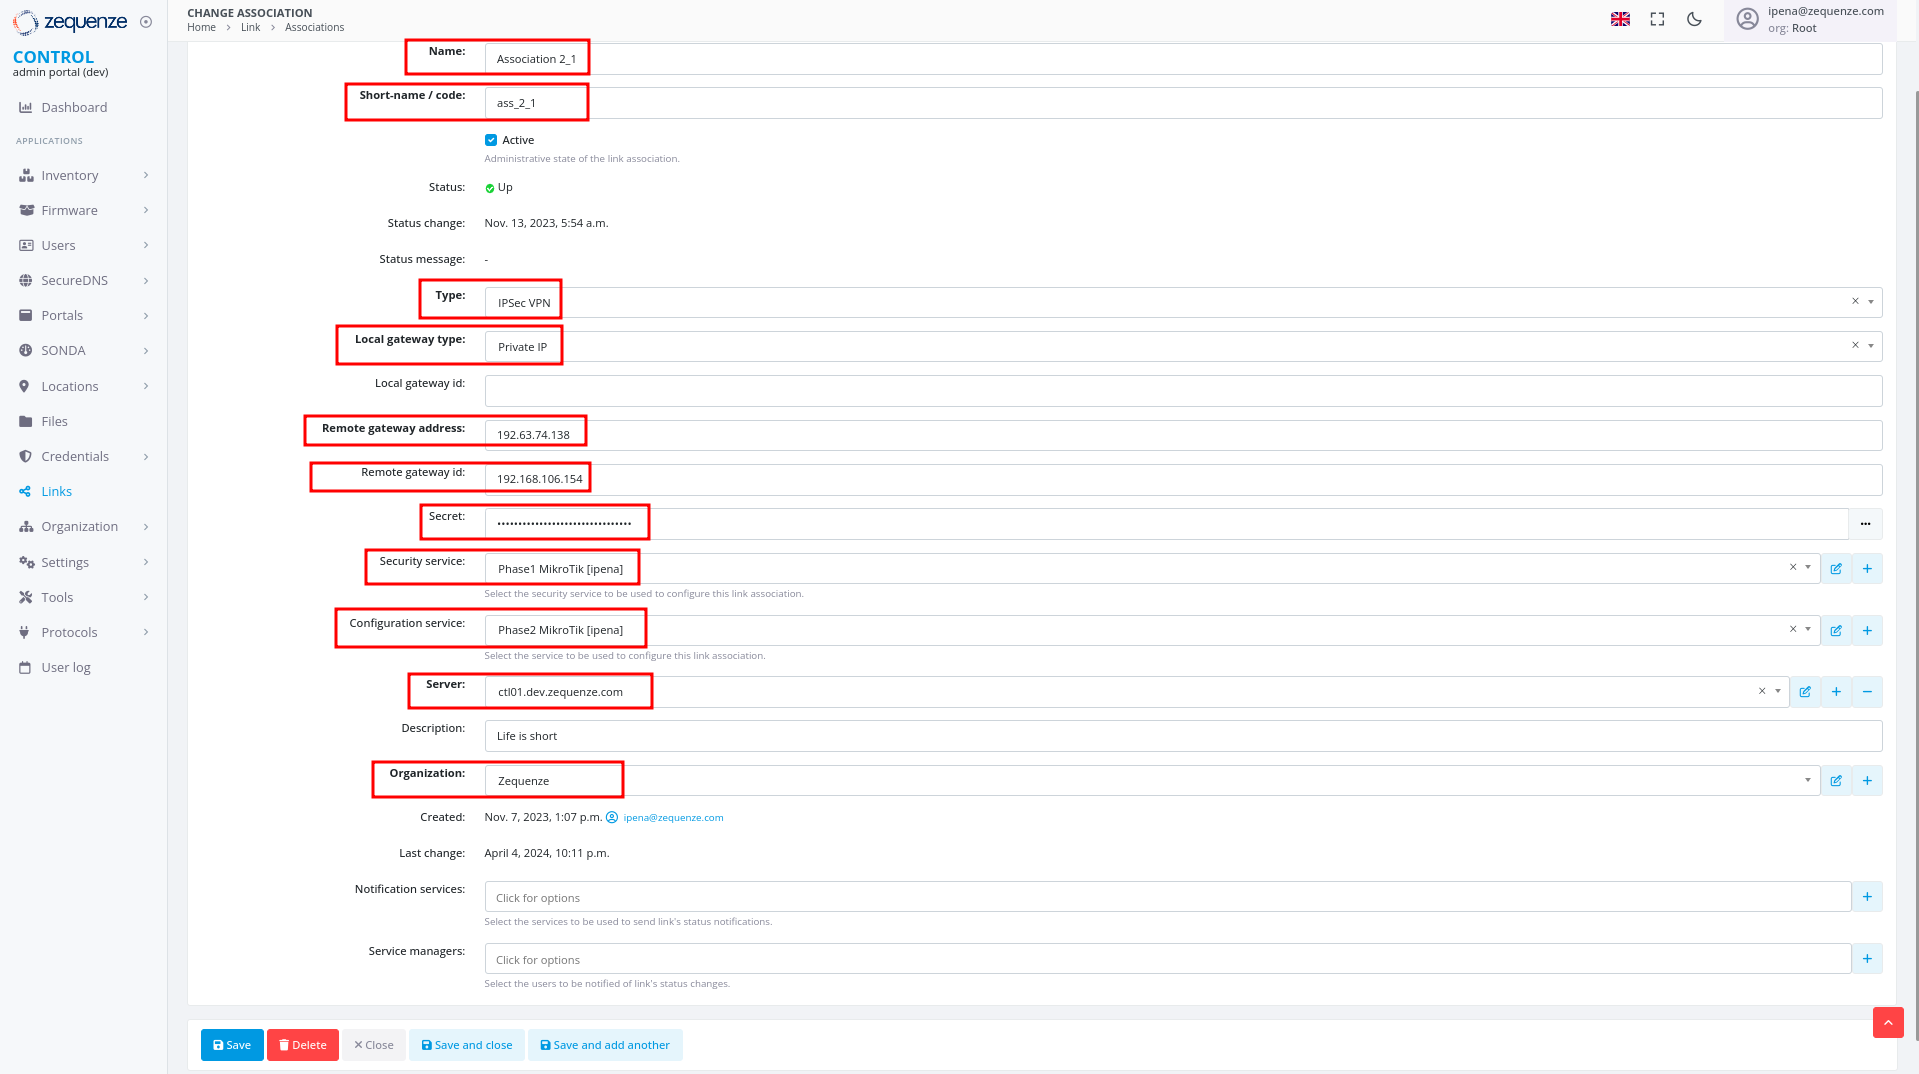 ---
### Step 4: Create Link
1. In the **Links** section, ensure you are on the **Links** tab
2. Click the **+Add** button
---
### Step 4: Create Link
1. In the **Links** section, ensure you are on the **Links** tab
2. Click the **+Add** button
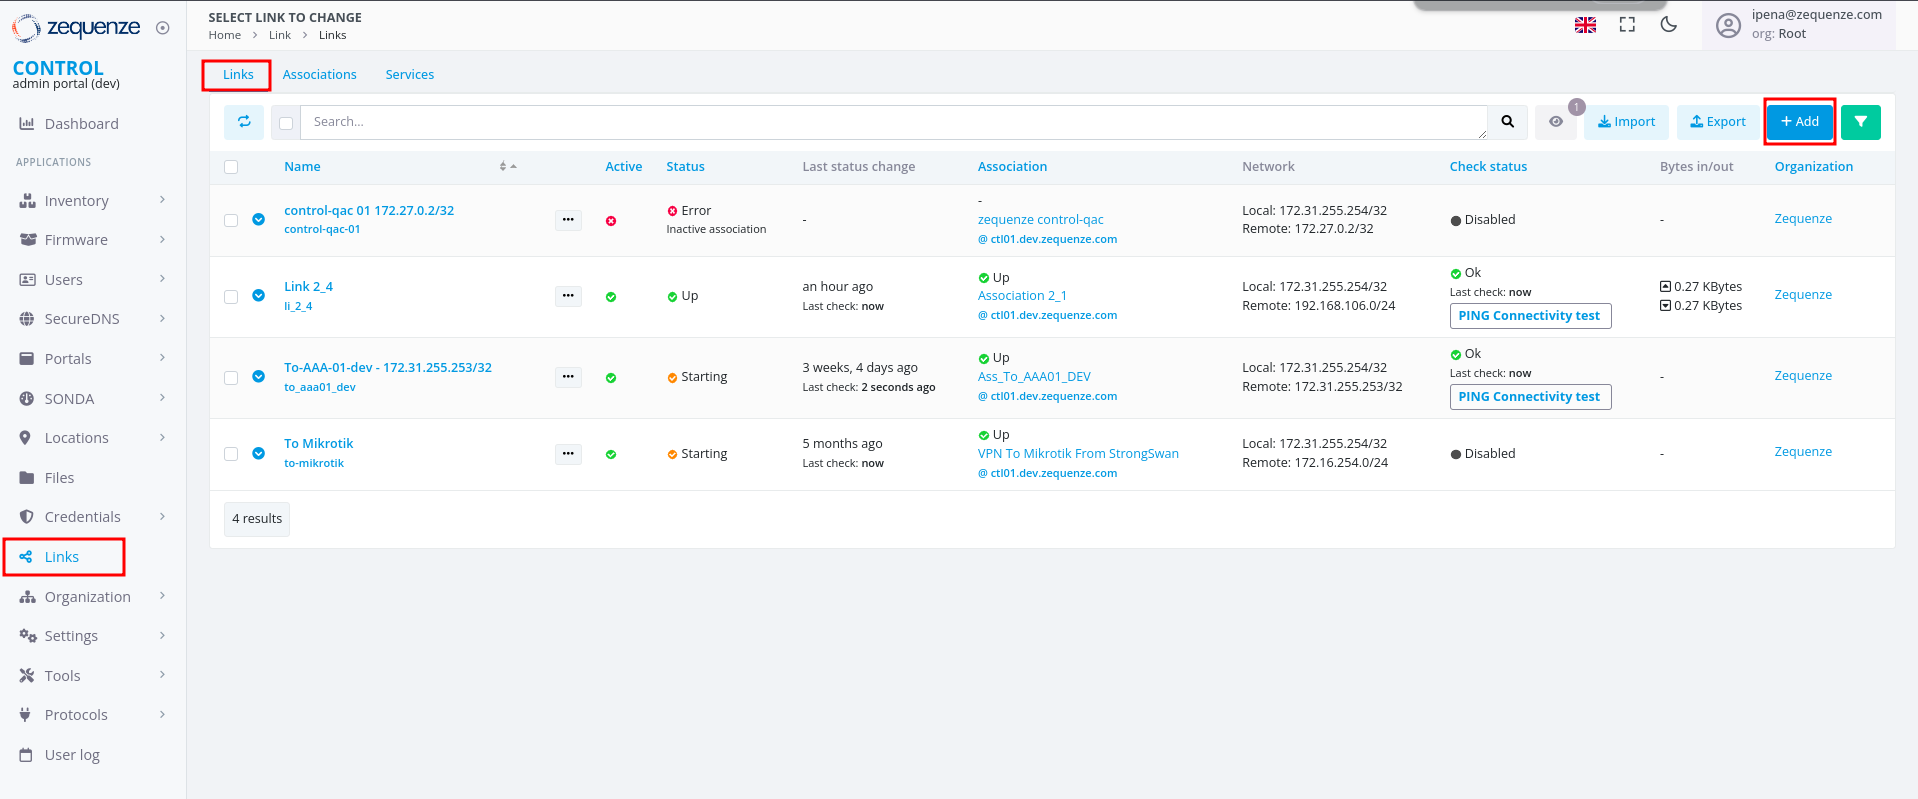 3. Configure the following fields:
- **Name**: Enter a name to identify this link
- **Short-name / code**: Enter a short identifier
- **Active**: Enable this option to activate the link
- **Association**: Select the association created in Step 3
- **Local network**: Enter the local Zequenze IP address
- For CONTROL: typically `172.31.255.254/32`
- For GATE: typically `172.31.255.253/32`
- (Verify the correct IP internally before configuring)
- **Remote network**: Enter the remote network or IP address that will pass through the tunnel to Zequenze
- **Check services**: Select "PING Connectivity test" to validate tunnel communication
- **Check address/hostname**: Enter a remote IP address that is always active for connectivity testing (typically the remote gateway, e.g., 192.168.106.154)
- **Organization**: Select the organization that will use this VPN connectivity
3. Configure the following fields:
- **Name**: Enter a name to identify this link
- **Short-name / code**: Enter a short identifier
- **Active**: Enable this option to activate the link
- **Association**: Select the association created in Step 3
- **Local network**: Enter the local Zequenze IP address
- For CONTROL: typically `172.31.255.254/32`
- For GATE: typically `172.31.255.253/32`
- (Verify the correct IP internally before configuring)
- **Remote network**: Enter the remote network or IP address that will pass through the tunnel to Zequenze
- **Check services**: Select "PING Connectivity test" to validate tunnel communication
- **Check address/hostname**: Enter a remote IP address that is always active for connectivity testing (typically the remote gateway, e.g., 192.168.106.154)
- **Organization**: Select the organization that will use this VPN connectivity
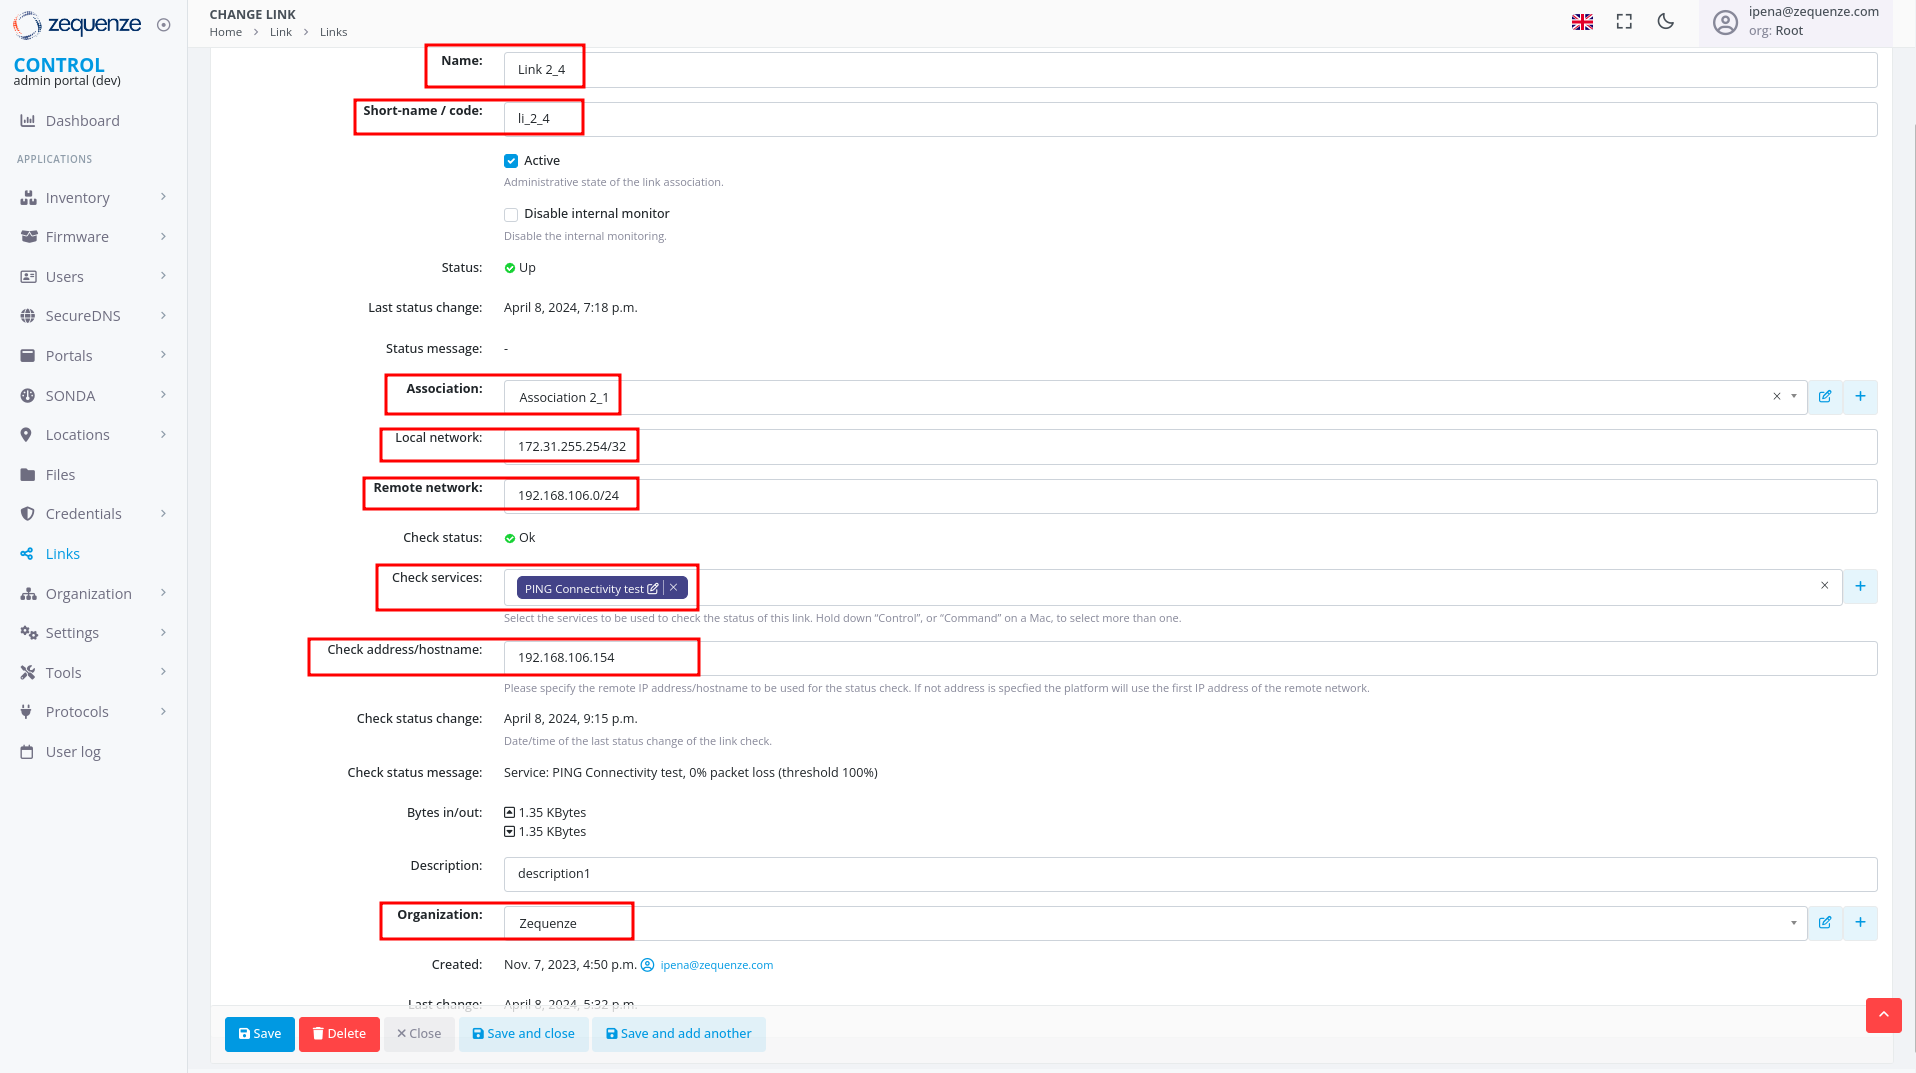 ---
## Verification and Summary
### RouterOS Connection Status
Once the configuration is complete, you should see the connection established in RouterOS as shown below:
---
## Verification and Summary
### RouterOS Connection Status
Once the configuration is complete, you should see the connection established in RouterOS as shown below:
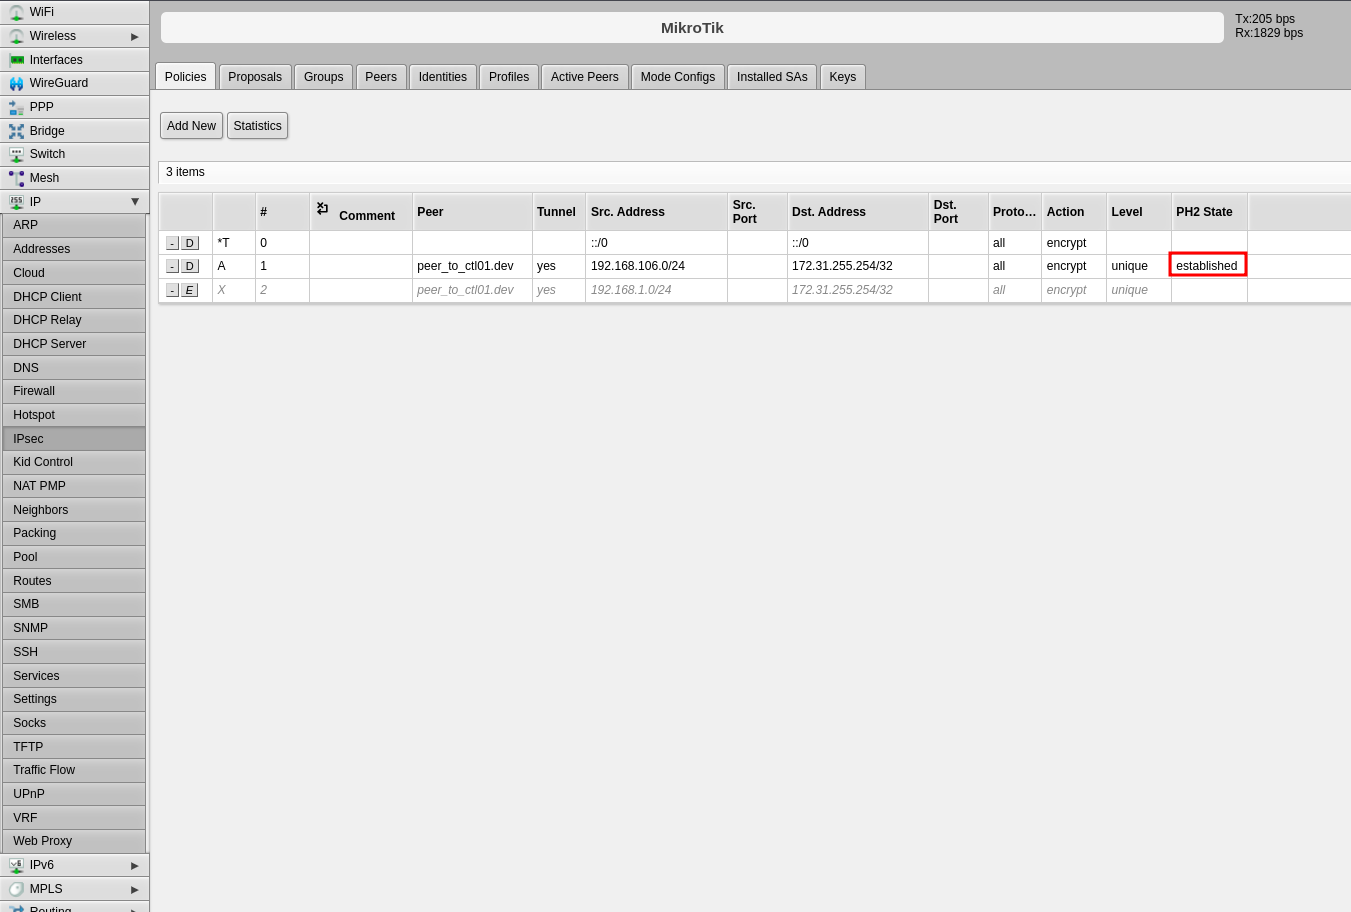 ### CONTROL Connection Status
The Link within CONTROL should appear as follows when successfully established:
### CONTROL Connection Status
The Link within CONTROL should appear as follows when successfully established:
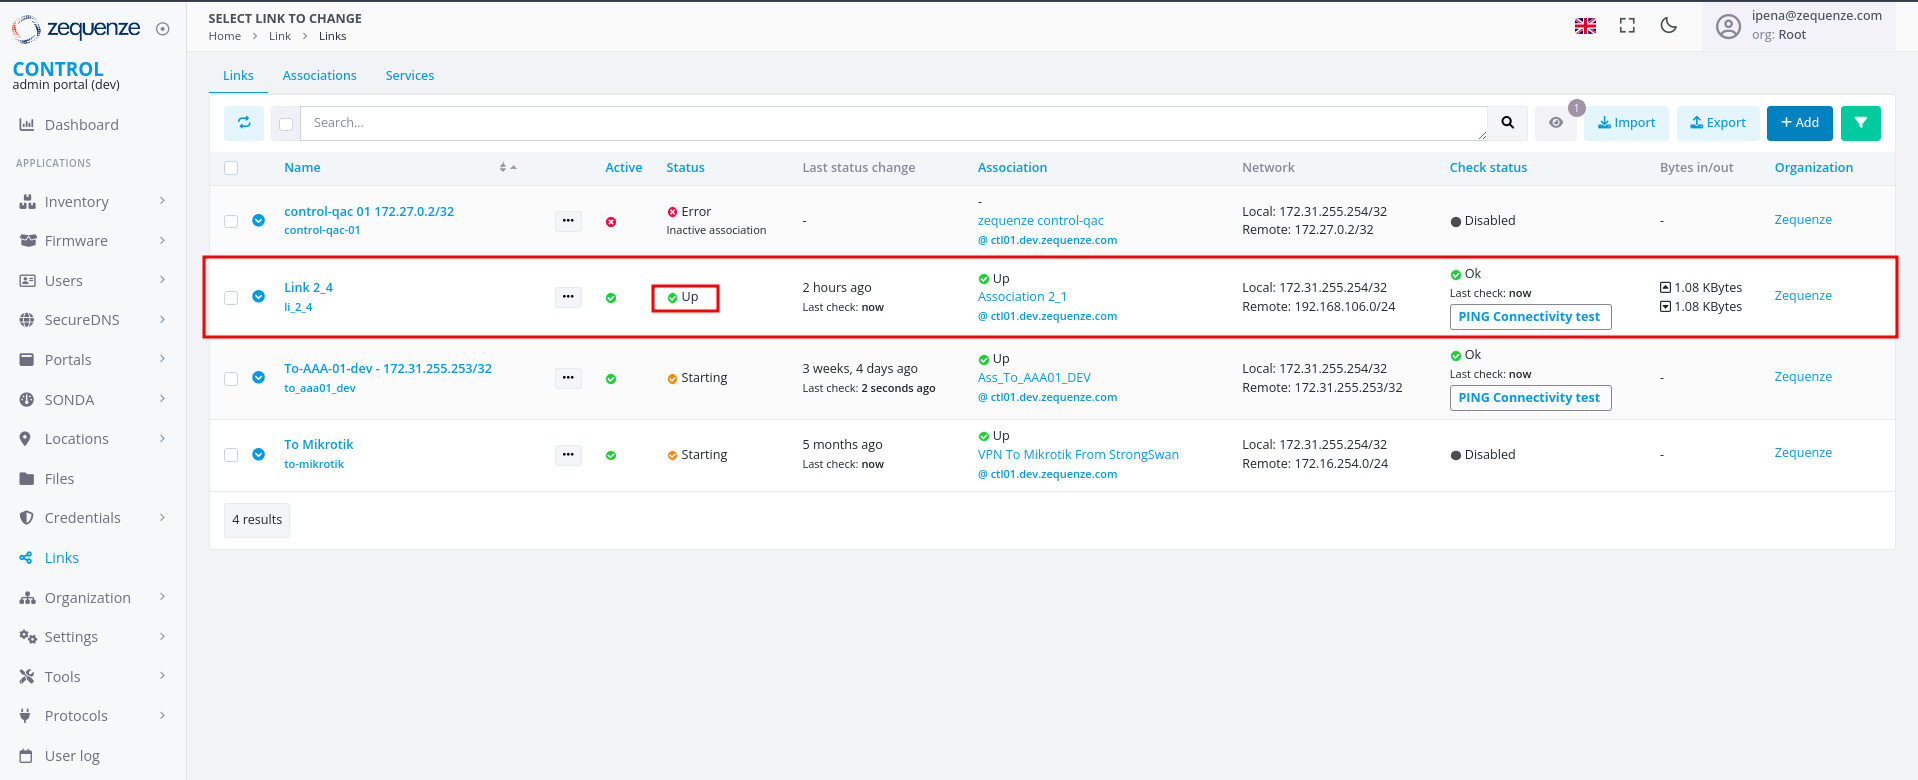 This completes the IPsec VPN tunnel configuration between RouterOS and CONTROL. The tunnel should now be active and passing traffic between the configured networks.
# Setting up TR-069 client on mikrotik hAP ac2
## Prerequisites
Before configuring the TR-069 client, ensure your MikroTik hAP ac2 device has an active internet connection.
## Required Configuration Parameters
You will need the following credentials and settings to configure the TR-069 client in CONTROL:
- **ACS URL:** The endpoint URL where your device will report its status and receive management commands
- **Username:** Authentication username for the ACS URL
- **Password:** Authentication password for the ACS URL
> **Note:** These credentials should be provided by your CONTROL administrator or obtained from your CONTROL portal settings.
## Configuration Steps
Follow the video tutorial below for step-by-step instructions on configuring the TR-069 client on your MikroTik hAP ac2:
## Additional Information
The TR-069 protocol enables remote management and monitoring of your MikroTik device through the CONTROL platform. Once configured, your device will automatically establish communication with the ACS server and appear in your CONTROL dashboard.
# Stun and Ejabberd monitoring
# Ejabberd API
## Overview
The Ejabberd API provides RESTful endpoints for managing and monitoring XMPP server operations within CONTROL. All requests require HTTP basic authentication and use JSON for request/response payloads.
## Authentication
All API endpoints require basic authentication using admin credentials:
- **Username**: `root@control-xmpp-dev.zequenze.com`
- **Password**: Your admin API token
- **Base URL**: `https://127.0.0.1:5443/api/`
## API Endpoints
### Get Registered Stats Hosts
Retrieves statistics for registered hosts, including online user counts.
**Endpoint**: `/stats_host`
**Request Parameters**:
- `name` - The statistic name (e.g., "onlineusers")
- `host` - The XMPP host domain
**Example**:
```bash
curl -k --basic --user root@control-xmpp-dev.zequenze.com:6N3Zne3ByoSCnZ3d46Gerf452nxLBcNp \
-H 'Content-Type: application/json' \
-d '{ "name": "onlineusers", "host": "control-xmpp-dev.zequenze.com" }' \
'https://127.0.0.1:5443/api/stats_host'
```
### Get Connected Users
Returns a list of all currently connected users.
**Endpoint**: `/connected_users`
**Example**:
```bash
curl -k --basic --user root@control-xmpp-dev.zequenze.com:6N3Zne3ByoSCnZ3d46Gerf452nxLBcNp \
'https://127.0.0.1:5443/api/connected_users'
```
### Get Registered Users
Retrieves all registered users for a specific host.
**Endpoint**: `/registered_users`
**Request Parameters**:
- `host` - The XMPP host domain
**Example**:
```bash
curl -k --basic --user root@control-xmpp-dev.zequenze.com:6N3Zne3ByoSCnZ3d46Gerf452nxLBcNp \
-H 'Content-Type: application/json' \
-d '{ "host": "control-xmpp-dev.zequenze.com" }' \
'https://127.0.0.1:5443/api/registered_users'
```
### Get Connected Users Info
Returns detailed information about all connected users.
**Endpoint**: `/connected_users_info`
**Example**:
```bash
curl -k --basic --user root@control-xmpp-dev.zequenze.com:6N3Zne3ByoSCnZ3d46Gerf452nxLBcNp \
'https://127.0.0.1:5443/api/connected_users_info'
```
### Get User Presence
Retrieves the presence status for a specific user.
**Endpoint**: `/get_presence`
**Request Parameters**:
- `user` - The username
- `host` - The XMPP host domain
**Example**:
```bash
curl -k --basic --user root@control-xmpp-dev.zequenze.com:6N3Zne3ByoSCnZ3d46Gerf452nxLBcNp \
-H 'Content-Type: application/json' \
-d '{ "user": "hy400219100000286", "host": "control-xmpp-dev.zequenze.com" }' \
'https://127.0.0.1:5443/api/get_presence'
```
### Get User Session Info
Returns detailed session information for a specific user.
**Endpoint**: `/user_sessions_info`
**Request Parameters**:
- `user` - The username
- `host` - The XMPP host domain
**Example**:
```bash
curl -k --basic --user root@control-xmpp-dev.zequenze.com:6N3Zne3ByoSCnZ3d46Gerf452nxLBcNp \
-H 'Content-Type: application/json' \
-d '{ "user": "hy400219100000286", "host": "control-xmpp-dev.zequenze.com" }' \
'https://127.0.0.1:5443/api/user_sessions_info'
```
### Get User Resources
Retrieves all active resources (connections) for a specific user.
**Endpoint**: `/user_resources`
**Request Parameters**:
- `user` - The username
- `host` - The XMPP host domain
**Example**:
```bash
curl -k --basic --user root@control-xmpp-dev.zequenze.com:6N3Zne3ByoSCnZ3d46Gerf452nxLBcNp \
-H 'Content-Type: application/json' \
-d '{ "user": "hy400219100000286", "host": "control-xmpp-dev.zequenze.com" }' \
'https://127.0.0.1:5443/api/user_resources'
```
# Customer Engineering
# ACS Operational Launch Checklist
## Overview
This checklist ensures a successful ACS operational launch for CONTROL. Complete each step in sequence before deploying devices to end-customers.
---
## Prerequisites Checklist
### 1. Device Testing and Integration
All devices **must be tested and integrated** in the development platform before proceeding to production.
**Development Platform:** [control-dev.zequenze.com](https://control-dev.zequenze.com/admin/)
Ensure all device profiles are validated and functioning correctly in this environment.
---
### 2. DNS Configuration
Configure your own [FQDN](https://en.wikipedia.org/wiki/Fully_qualified_domain_name) pointing to Zequenze's production environment. This allows your devices to use a domain under your management.
**Typical DNS Configuration:**
```
acs.myMVNO.com CNAME control.zequenze.com.
```
Replace `myMVNO.com` with your actual domain name.
---
### 3. TR-069 Credentials Configuration
All devices (modems) must have TR-069 credentials properly configured with the following parameters:
- **URL:** `https://acs.myMVNO.com/cwmp`
- **Username:** To be agreed (typically the same as used in the development platform)
- **Password:** To be agreed (typically the same as used in the development platform)
**Important:** These TR-069 settings **must** be configured by default in the device's firmware/software. This ensures that devices continue reporting to the ACS platform even after a factory reset.
---
## Production Validation Testing
Before deploying to end-customers, perform the following validation tests on the production environment. This step requires completion of steps 1-3 above.
### Required Validation Tests
- [ ] **Configure test modem** — Ensure the modem has Internet access and can reach the ACS
- [ ] **Validate onboarding** — Verify proper device onboarding and visualization through both WebGUI and REST API
- [ ] **Validate operations** — Test configuration changes and operational commands (Reboot, Factory Reset)
- [ ] **Validate use cases** — Test any additional validations or specific use cases required for your deployment
All tests must complete successfully before proceeding to deployment.
---
## Deployment Authorization
Once all validation tests are successful, you are authorized to begin deploying devices to end-customers.
**Final Verification:**
- ✓ All devices validated in development platform
- ✓ FQDN created and DNS configured
- ✓ Modems configured with correct TR-069 credentials
- ✓ Production validation tests completed successfully
# Configuring STUN (UDP-based connection request)
## Overview
[STUN](https://en.wikipedia.org/wiki/STUN) (Session Traversal Utilities for NAT) is a [TR-069](https://en.wikipedia.org/wiki/TR-069) [connection-request](https://www.qacafe.com/resources/connection-request-basics/) helper protocol that enables the ACS (Auto Configuration Server) to reach CPE (Customer Premises Equipment) devices that cannot be accessed via direct HTTP requests. STUN is typically required when the CPE is located behind a firewall or a [NAT](https://en.wikipedia.org/wiki/Network_address_translation) (Network Address Translation) process.
[](https://docs.zequenze.com/uploads/images/gallery/2022-03/sDrkfQJ9NZQYWCwj-stun-diagram.png)
## Configuration Requirements
To enable STUN functionality, both the CONTROL ACS platform and the CPE must be properly configured.
## CPE Configuration
Configuring STUN on the CPE is straightforward and requires only two parameters:
- **STUN Server FQDN**: The [Fully Qualified Domain Name](https://en.wikipedia.org/wiki/Fully_qualified_domain_name) of the STUN server
- **Port**: The UDP port number for STUN communication
### Development Environment Settings
For testing and development purposes, use the following configuration:
```
STUN Server: control-stun-dev.zequenze.com
Port: 3478
```
## CONTROL ACS Configuration
On the CONTROL ACS platform, STUN-related variables must be added to the Device Profile. A typical configuration example:
[](https://docs.zequenze.com/uploads/images/gallery/2022-03/opn9ALR5ivocjboL-stun-config.png)
## How STUN Connection Requests Work
Once STUN is configured on both the ACS and CPE:
1. The CPE establishes a UDP binding with the STUN server
2. The CPE reports this UDP binding address to the ACS using the TR-181 parameter: `Device.ManagementServer.UDPConnectionRequestAddress`
3. The ACS uses this reported address for all subsequent connection-request procedures
This mechanism allows the ACS to communicate with CPE devices even when they are not directly accessible via traditional HTTP connection requests.
# FAQ ACS | MVNO ALTAN
# Plataforma ACS Zequenze para MVNO ALTAN
## Preguntas Frecuentes
---
## ¿Qué es y para qué sirve la plataforma ACS Zequenze?
La plataforma ACS Zequenze permite al MVNO gestionar y operar los dispositivos de cliente (por ejemplo, módems) de forma remota, segura y automatizada.
[](https://docs.zequenze.com/uploads/images/gallery/2022-03/cF5RWBFh8Lv4x61X-acs-diagram-es.png)
### Principales funcionalidades
Las principales tareas que se pueden realizar y automatizar a través de la plataforma ACS Zequenze son:
- Aprovisionamiento y *onboarding* de dispositivos en la plataforma
- Visualización de la configuración y valores operacionales del módem (por ejemplo, red LTE, red WiFi)
- Cambios en la configuración de los dispositivos (por ejemplo, nombre/contraseña WiFi, canal de red WiFi)
- Operaciones de *Reboot* y *Factory Reset* en el dispositivo
- Gestión de actualizaciones de firmware/software de los dispositivos
- Gestión de pruebas de desempeño (Download, Upload, Delay/Jitter) en los dispositivos
### Reportes y analíticos
Adicionalmente, la plataforma provee extensos reportes y analíticos sobre los dispositivos, incluyendo:
- Estatus en tiempo real de los dispositivos (con conectividad a Internet)
- Analíticos sobre marca y modelo de dispositivos en la red
- Analíticos sobre versión de software en los dispositivos
- Analíticos en tiempo real sobre parámetros LTE de los dispositivos (RSSI, SINR, otros)
### Interfaces de gestión
Como se indica en el diagrama anterior, la gestión de los dispositivos está disponible mediante:
- **WebGUI**: Para operadores NOC o Ingeniería
- **REST API**: Para integración con plataformas CRM o similares (por ejemplo, operadores de Call Center)
---
## ¿Qué necesito para gestionar mis dispositivos con la plataforma ACS Zequenze?
El único requisito es que los dispositivos de usuario (módems) soporten el **protocolo estándar TR-069** y que estén apropiadamente configurados para reportar hacia la plataforma ACS Zequenze.
### Configuración para pruebas
Para fines de **pruebas**, los dispositivos pueden ser fácilmente configurados para reportar a la plataforma con solo estos tres parámetros:
- **URL**: `https://prueba-altan.zequenze.com/`
- **Usuario**: *a ser acordado*
- **Contraseña**: *a ser acordado*
### Configuración para producción
Una vez validada la integración de cada tipo de dispositivo, se podrá acordar el mecanismo con el cual se configurarán en forma masiva los dispositivos de usuarios. Los métodos más típicos son:
**Para nuevos dispositivos:**
- Pre-configuración TR-069 vía firmware/software en el dispositivo (URL, Usuario, Contraseña)
**Para dispositivos existentes:**
- Actualización del firmware/software (FOTA) que integre la apropiada configuración TR-069 del dispositivo (URL, Usuario, Contraseña)
---
## ¿Puedo migrar mis dispositivos de un ACS existente a la plataforma ACS Zequenze?
Absolutamente.
Una de las ventajas del protocolo utilizado por las plataformas ACS (TR-069) es que es estándar y no permite hacer *lock-in* de los clientes en una plataforma ACS en particular.
Una vez que se valide la integración de tus dispositivos con la plataforma ACS Zequenze, podremos establecer un plan para esta migración, lo cual es tan sencillo como:
- Cambiar el URL del ACS en tus dispositivos (vía la plataforma ACS actual), o bien
- Reconfigurar el FQDN del URL al que apuntan tus dispositivos actualmente
---
## ¿Cómo gestiono mis dispositivos vía la plataforma ACS Zequenze?
Según lo mencionado anteriormente, la plataforma provee interfaces **WebGUI** y **REST API** para la gestión de los dispositivos.
[](https://docs.zequenze.com/uploads/images/gallery/2022-03/LWvobLRMWJn33Vjl-acs-gui.png)
This completes the IPsec VPN tunnel configuration between RouterOS and CONTROL. The tunnel should now be active and passing traffic between the configured networks.
# Setting up TR-069 client on mikrotik hAP ac2
## Prerequisites
Before configuring the TR-069 client, ensure your MikroTik hAP ac2 device has an active internet connection.
## Required Configuration Parameters
You will need the following credentials and settings to configure the TR-069 client in CONTROL:
- **ACS URL:** The endpoint URL where your device will report its status and receive management commands
- **Username:** Authentication username for the ACS URL
- **Password:** Authentication password for the ACS URL
> **Note:** These credentials should be provided by your CONTROL administrator or obtained from your CONTROL portal settings.
## Configuration Steps
Follow the video tutorial below for step-by-step instructions on configuring the TR-069 client on your MikroTik hAP ac2:
## Additional Information
The TR-069 protocol enables remote management and monitoring of your MikroTik device through the CONTROL platform. Once configured, your device will automatically establish communication with the ACS server and appear in your CONTROL dashboard.
# Stun and Ejabberd monitoring
# Ejabberd API
## Overview
The Ejabberd API provides RESTful endpoints for managing and monitoring XMPP server operations within CONTROL. All requests require HTTP basic authentication and use JSON for request/response payloads.
## Authentication
All API endpoints require basic authentication using admin credentials:
- **Username**: `root@control-xmpp-dev.zequenze.com`
- **Password**: Your admin API token
- **Base URL**: `https://127.0.0.1:5443/api/`
## API Endpoints
### Get Registered Stats Hosts
Retrieves statistics for registered hosts, including online user counts.
**Endpoint**: `/stats_host`
**Request Parameters**:
- `name` - The statistic name (e.g., "onlineusers")
- `host` - The XMPP host domain
**Example**:
```bash
curl -k --basic --user root@control-xmpp-dev.zequenze.com:6N3Zne3ByoSCnZ3d46Gerf452nxLBcNp \
-H 'Content-Type: application/json' \
-d '{ "name": "onlineusers", "host": "control-xmpp-dev.zequenze.com" }' \
'https://127.0.0.1:5443/api/stats_host'
```
### Get Connected Users
Returns a list of all currently connected users.
**Endpoint**: `/connected_users`
**Example**:
```bash
curl -k --basic --user root@control-xmpp-dev.zequenze.com:6N3Zne3ByoSCnZ3d46Gerf452nxLBcNp \
'https://127.0.0.1:5443/api/connected_users'
```
### Get Registered Users
Retrieves all registered users for a specific host.
**Endpoint**: `/registered_users`
**Request Parameters**:
- `host` - The XMPP host domain
**Example**:
```bash
curl -k --basic --user root@control-xmpp-dev.zequenze.com:6N3Zne3ByoSCnZ3d46Gerf452nxLBcNp \
-H 'Content-Type: application/json' \
-d '{ "host": "control-xmpp-dev.zequenze.com" }' \
'https://127.0.0.1:5443/api/registered_users'
```
### Get Connected Users Info
Returns detailed information about all connected users.
**Endpoint**: `/connected_users_info`
**Example**:
```bash
curl -k --basic --user root@control-xmpp-dev.zequenze.com:6N3Zne3ByoSCnZ3d46Gerf452nxLBcNp \
'https://127.0.0.1:5443/api/connected_users_info'
```
### Get User Presence
Retrieves the presence status for a specific user.
**Endpoint**: `/get_presence`
**Request Parameters**:
- `user` - The username
- `host` - The XMPP host domain
**Example**:
```bash
curl -k --basic --user root@control-xmpp-dev.zequenze.com:6N3Zne3ByoSCnZ3d46Gerf452nxLBcNp \
-H 'Content-Type: application/json' \
-d '{ "user": "hy400219100000286", "host": "control-xmpp-dev.zequenze.com" }' \
'https://127.0.0.1:5443/api/get_presence'
```
### Get User Session Info
Returns detailed session information for a specific user.
**Endpoint**: `/user_sessions_info`
**Request Parameters**:
- `user` - The username
- `host` - The XMPP host domain
**Example**:
```bash
curl -k --basic --user root@control-xmpp-dev.zequenze.com:6N3Zne3ByoSCnZ3d46Gerf452nxLBcNp \
-H 'Content-Type: application/json' \
-d '{ "user": "hy400219100000286", "host": "control-xmpp-dev.zequenze.com" }' \
'https://127.0.0.1:5443/api/user_sessions_info'
```
### Get User Resources
Retrieves all active resources (connections) for a specific user.
**Endpoint**: `/user_resources`
**Request Parameters**:
- `user` - The username
- `host` - The XMPP host domain
**Example**:
```bash
curl -k --basic --user root@control-xmpp-dev.zequenze.com:6N3Zne3ByoSCnZ3d46Gerf452nxLBcNp \
-H 'Content-Type: application/json' \
-d '{ "user": "hy400219100000286", "host": "control-xmpp-dev.zequenze.com" }' \
'https://127.0.0.1:5443/api/user_resources'
```
# Customer Engineering
# ACS Operational Launch Checklist
## Overview
This checklist ensures a successful ACS operational launch for CONTROL. Complete each step in sequence before deploying devices to end-customers.
---
## Prerequisites Checklist
### 1. Device Testing and Integration
All devices **must be tested and integrated** in the development platform before proceeding to production.
**Development Platform:** [control-dev.zequenze.com](https://control-dev.zequenze.com/admin/)
Ensure all device profiles are validated and functioning correctly in this environment.
---
### 2. DNS Configuration
Configure your own [FQDN](https://en.wikipedia.org/wiki/Fully_qualified_domain_name) pointing to Zequenze's production environment. This allows your devices to use a domain under your management.
**Typical DNS Configuration:**
```
acs.myMVNO.com CNAME control.zequenze.com.
```
Replace `myMVNO.com` with your actual domain name.
---
### 3. TR-069 Credentials Configuration
All devices (modems) must have TR-069 credentials properly configured with the following parameters:
- **URL:** `https://acs.myMVNO.com/cwmp`
- **Username:** To be agreed (typically the same as used in the development platform)
- **Password:** To be agreed (typically the same as used in the development platform)
**Important:** These TR-069 settings **must** be configured by default in the device's firmware/software. This ensures that devices continue reporting to the ACS platform even after a factory reset.
---
## Production Validation Testing
Before deploying to end-customers, perform the following validation tests on the production environment. This step requires completion of steps 1-3 above.
### Required Validation Tests
- [ ] **Configure test modem** — Ensure the modem has Internet access and can reach the ACS
- [ ] **Validate onboarding** — Verify proper device onboarding and visualization through both WebGUI and REST API
- [ ] **Validate operations** — Test configuration changes and operational commands (Reboot, Factory Reset)
- [ ] **Validate use cases** — Test any additional validations or specific use cases required for your deployment
All tests must complete successfully before proceeding to deployment.
---
## Deployment Authorization
Once all validation tests are successful, you are authorized to begin deploying devices to end-customers.
**Final Verification:**
- ✓ All devices validated in development platform
- ✓ FQDN created and DNS configured
- ✓ Modems configured with correct TR-069 credentials
- ✓ Production validation tests completed successfully
# Configuring STUN (UDP-based connection request)
## Overview
[STUN](https://en.wikipedia.org/wiki/STUN) (Session Traversal Utilities for NAT) is a [TR-069](https://en.wikipedia.org/wiki/TR-069) [connection-request](https://www.qacafe.com/resources/connection-request-basics/) helper protocol that enables the ACS (Auto Configuration Server) to reach CPE (Customer Premises Equipment) devices that cannot be accessed via direct HTTP requests. STUN is typically required when the CPE is located behind a firewall or a [NAT](https://en.wikipedia.org/wiki/Network_address_translation) (Network Address Translation) process.
[](https://docs.zequenze.com/uploads/images/gallery/2022-03/sDrkfQJ9NZQYWCwj-stun-diagram.png)
## Configuration Requirements
To enable STUN functionality, both the CONTROL ACS platform and the CPE must be properly configured.
## CPE Configuration
Configuring STUN on the CPE is straightforward and requires only two parameters:
- **STUN Server FQDN**: The [Fully Qualified Domain Name](https://en.wikipedia.org/wiki/Fully_qualified_domain_name) of the STUN server
- **Port**: The UDP port number for STUN communication
### Development Environment Settings
For testing and development purposes, use the following configuration:
```
STUN Server: control-stun-dev.zequenze.com
Port: 3478
```
## CONTROL ACS Configuration
On the CONTROL ACS platform, STUN-related variables must be added to the Device Profile. A typical configuration example:
[](https://docs.zequenze.com/uploads/images/gallery/2022-03/opn9ALR5ivocjboL-stun-config.png)
## How STUN Connection Requests Work
Once STUN is configured on both the ACS and CPE:
1. The CPE establishes a UDP binding with the STUN server
2. The CPE reports this UDP binding address to the ACS using the TR-181 parameter: `Device.ManagementServer.UDPConnectionRequestAddress`
3. The ACS uses this reported address for all subsequent connection-request procedures
This mechanism allows the ACS to communicate with CPE devices even when they are not directly accessible via traditional HTTP connection requests.
# FAQ ACS | MVNO ALTAN
# Plataforma ACS Zequenze para MVNO ALTAN
## Preguntas Frecuentes
---
## ¿Qué es y para qué sirve la plataforma ACS Zequenze?
La plataforma ACS Zequenze permite al MVNO gestionar y operar los dispositivos de cliente (por ejemplo, módems) de forma remota, segura y automatizada.
[](https://docs.zequenze.com/uploads/images/gallery/2022-03/cF5RWBFh8Lv4x61X-acs-diagram-es.png)
### Principales funcionalidades
Las principales tareas que se pueden realizar y automatizar a través de la plataforma ACS Zequenze son:
- Aprovisionamiento y *onboarding* de dispositivos en la plataforma
- Visualización de la configuración y valores operacionales del módem (por ejemplo, red LTE, red WiFi)
- Cambios en la configuración de los dispositivos (por ejemplo, nombre/contraseña WiFi, canal de red WiFi)
- Operaciones de *Reboot* y *Factory Reset* en el dispositivo
- Gestión de actualizaciones de firmware/software de los dispositivos
- Gestión de pruebas de desempeño (Download, Upload, Delay/Jitter) en los dispositivos
### Reportes y analíticos
Adicionalmente, la plataforma provee extensos reportes y analíticos sobre los dispositivos, incluyendo:
- Estatus en tiempo real de los dispositivos (con conectividad a Internet)
- Analíticos sobre marca y modelo de dispositivos en la red
- Analíticos sobre versión de software en los dispositivos
- Analíticos en tiempo real sobre parámetros LTE de los dispositivos (RSSI, SINR, otros)
### Interfaces de gestión
Como se indica en el diagrama anterior, la gestión de los dispositivos está disponible mediante:
- **WebGUI**: Para operadores NOC o Ingeniería
- **REST API**: Para integración con plataformas CRM o similares (por ejemplo, operadores de Call Center)
---
## ¿Qué necesito para gestionar mis dispositivos con la plataforma ACS Zequenze?
El único requisito es que los dispositivos de usuario (módems) soporten el **protocolo estándar TR-069** y que estén apropiadamente configurados para reportar hacia la plataforma ACS Zequenze.
### Configuración para pruebas
Para fines de **pruebas**, los dispositivos pueden ser fácilmente configurados para reportar a la plataforma con solo estos tres parámetros:
- **URL**: `https://prueba-altan.zequenze.com/`
- **Usuario**: *a ser acordado*
- **Contraseña**: *a ser acordado*
### Configuración para producción
Una vez validada la integración de cada tipo de dispositivo, se podrá acordar el mecanismo con el cual se configurarán en forma masiva los dispositivos de usuarios. Los métodos más típicos son:
**Para nuevos dispositivos:**
- Pre-configuración TR-069 vía firmware/software en el dispositivo (URL, Usuario, Contraseña)
**Para dispositivos existentes:**
- Actualización del firmware/software (FOTA) que integre la apropiada configuración TR-069 del dispositivo (URL, Usuario, Contraseña)
---
## ¿Puedo migrar mis dispositivos de un ACS existente a la plataforma ACS Zequenze?
Absolutamente.
Una de las ventajas del protocolo utilizado por las plataformas ACS (TR-069) es que es estándar y no permite hacer *lock-in* de los clientes en una plataforma ACS en particular.
Una vez que se valide la integración de tus dispositivos con la plataforma ACS Zequenze, podremos establecer un plan para esta migración, lo cual es tan sencillo como:
- Cambiar el URL del ACS en tus dispositivos (vía la plataforma ACS actual), o bien
- Reconfigurar el FQDN del URL al que apuntan tus dispositivos actualmente
---
## ¿Cómo gestiono mis dispositivos vía la plataforma ACS Zequenze?
Según lo mencionado anteriormente, la plataforma provee interfaces **WebGUI** y **REST API** para la gestión de los dispositivos.
[](https://docs.zequenze.com/uploads/images/gallery/2022-03/LWvobLRMWJn33Vjl-acs-gui.png)